

December 16 (Tue): [Bollinger Bands] Nikkei 225 vs. NASDAQ
[Note]
I don’t know what will happen in the year-end and New Year market.
Trade with ample margin and caution!
At the beginning of 2019“Flash Crash”occurred.
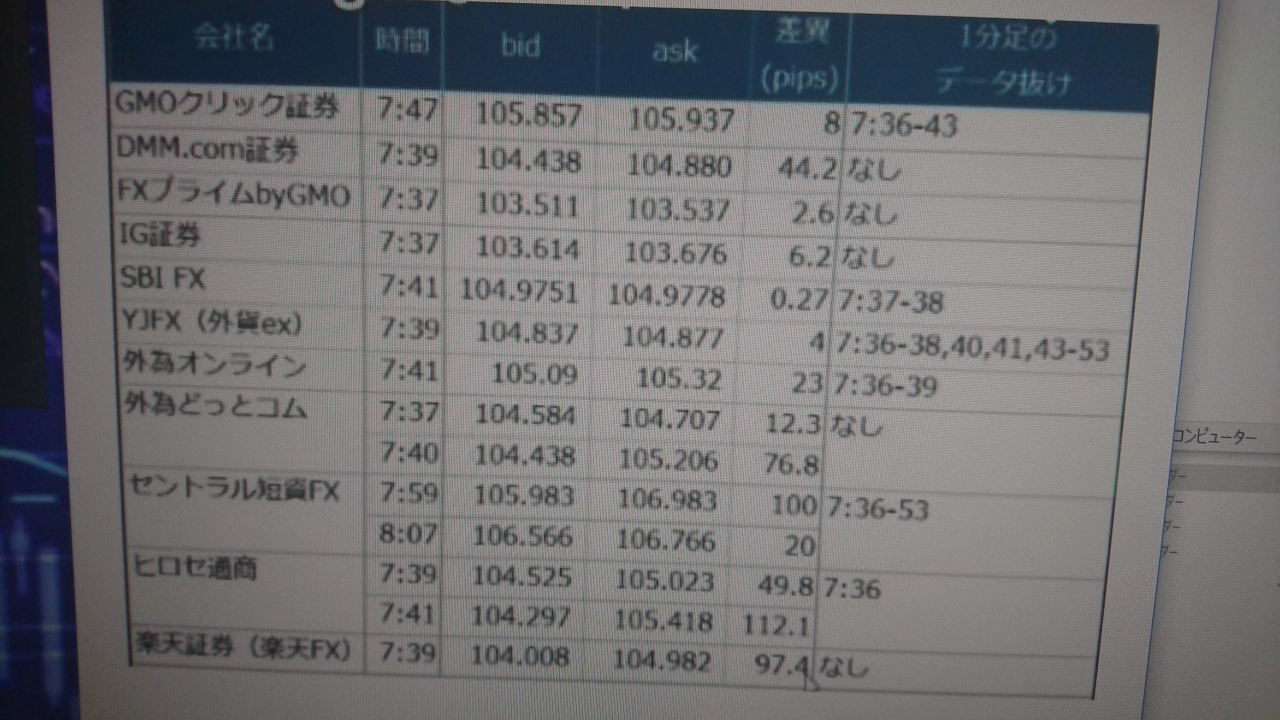
As you can see in the figure below,
some brokers had spreads widen to 100 pips, leading to a slaughter of stop-outs and margin calls.
Many investors recommend closing positions by year-end for that reason.
Basically, I also avoid holding positions over year-end and New Year, or if I do hold them, I reduce their size.
Please keep in mind that this kind of thing can happen!
History tends to repeat itself...
[Anomaly]
‘Dashi-metsu tenkō, go-shiri sagari, misho-bodo, shin-yōsō, inu warai, i-koma, ko wa hanayaka, ushi-takadzuki, tora senri o hashiru, u no tsubame’
It is said.
Next year is…‘Go-shiri sagari’
Therefore the market could cool down, but…
In fact, next year’s “Year of the Horse” is“Bing-Wu (Hinōe uma)”.
Even in the Year of the Horse and the Bing-Wu year, the market can surge in one go.
However, even if it surges, it may cool quickly, so there is a possibility of a sharp rise followed by a sharp fall, ultimately leading to a “Go-shiri sagari.”
This is an anomaly that tends to occur.
Please remember this as well! (*^^)v
This time
‘NASDAQ’
will be compared with it.
【Overall Scenario Probability】
This week’s overall market is…
“Up: 50% / Down: 50%”
【This Week’s Market Points to Watch】
This week, NASDAQ and the Nikkei 225 are at a turning point between “continued rally” and “correction.” For both assets, on the daily chart the moving average is biased upward due to the close 21 bars ago, and an upward scenario is considered as if prices are pulled toward the MA.
Meanwhile, NASDAQ has progressed to a weekly “squeeze,” and depending on price movement, there is a remaining possibility of developing into a downward expansion.
Also, Bitcoin, which tends to lead the four major U.S. indices, has entered a sideways time-adjustment (Blue Zone), and future movements could affect the entire stock market.
In the paid section, we explain in detail the specific scenarios and probabilities taking these correlations into account.
➥The rest is explained in detail in the members-only report.
If you’re not registered yet, please join from here ↓
● ‘Demystifying Bollinger Bands’ for daily chart analysis
https://www.gogojungle.co.jp/finance/navi/series/1613?via=articles_detail_aside
● Use ‘Harmonics Prescription’ to draw a Zone where the chart should stopZoneto be drawn!https://www.gogojungle.co.jp/finance/navi/series/1668?via=articles_detail_aside
(※The following content is for members only.)


