【Intervention Aftermath Pro】The World Seen by Triangular Currency Parity NOWCAST
Hello!TriParity Labs Tokyo is Kaz.This time,Intervention Wave Pro featuring “NOWCAST is something I would like to delve into. The past view is the statistics dashboard, but
The most important thing in trading is “now is the time!” (a bit old, but…)
For future outlooks“Forecast” is used, and the future is built upon the accumulation of the present“NOWCAST”, which is why it is named as such.
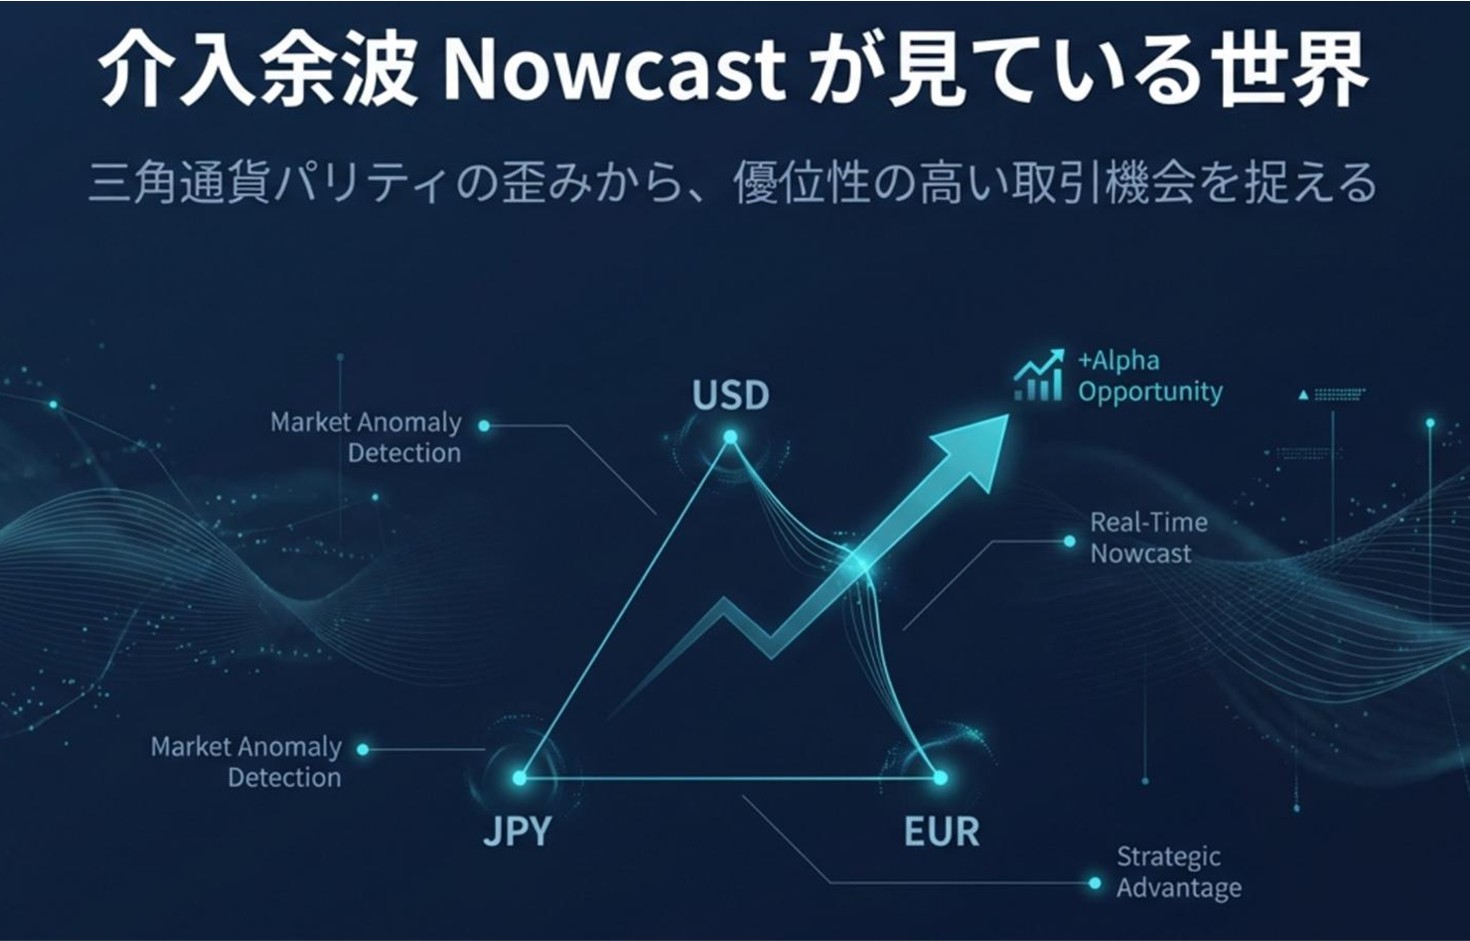
1.Idea of Intervention Waves — Relationship between Triangular Currency Parity and Large-Volume Flows―
1-1.What is Triangular Currency Parity?
In FX, for example, consider
- EURUSD
- GBPUSD
- EURGBP
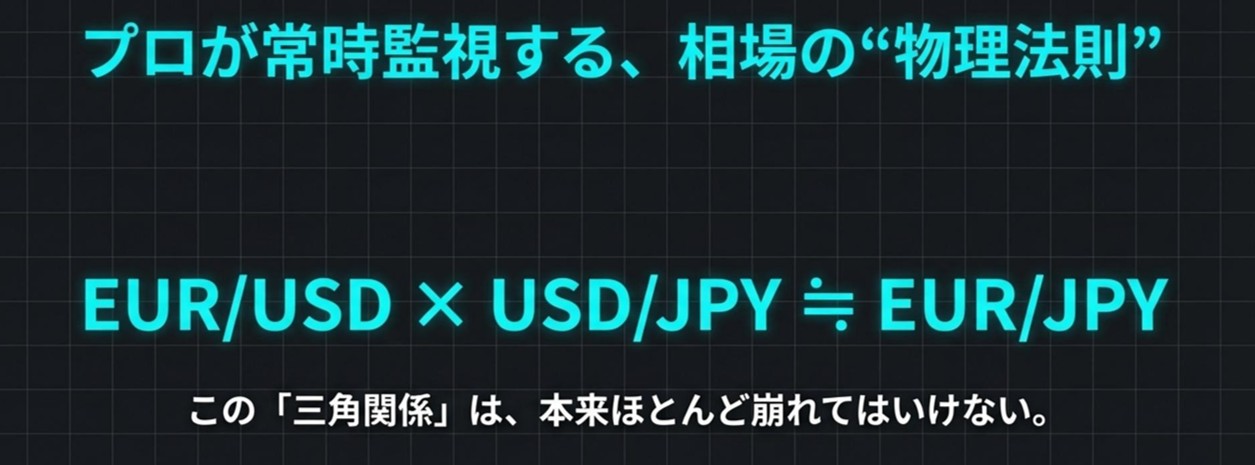
such that3 currency pairs form a consistent multiplicative relationship. This relationship is calledTriangular Currency ParityTriCurrency Parity.Roughly speaking, the “theoretical cross-rate” calculated from two rates and the actual cross-rate should be almost the same according to the rule.
But in real markets,
- differences in order book depth
- execution timing misalignments
- delayed rate feeds
- short-term risk-off actions and news flows
can cause this balance to temporarily break. This is the distortion of Triangular Currency Parity.
1-2.What happens after that?―Role of Flows and Interventions
From here, the concept of ““Intervention Waves” comes into play., typical movements are as follows.
- HFT and arbitrageurs identify this as an arbitrage opportunity and initiate trades
- Financial institutions and market makers move large positions to adjust inventories
- In some cases, real-demand interventions by central banks or similar entities occur
Many of these flows and interventions tend to push in the direction of restoring the broken parity to its original state.
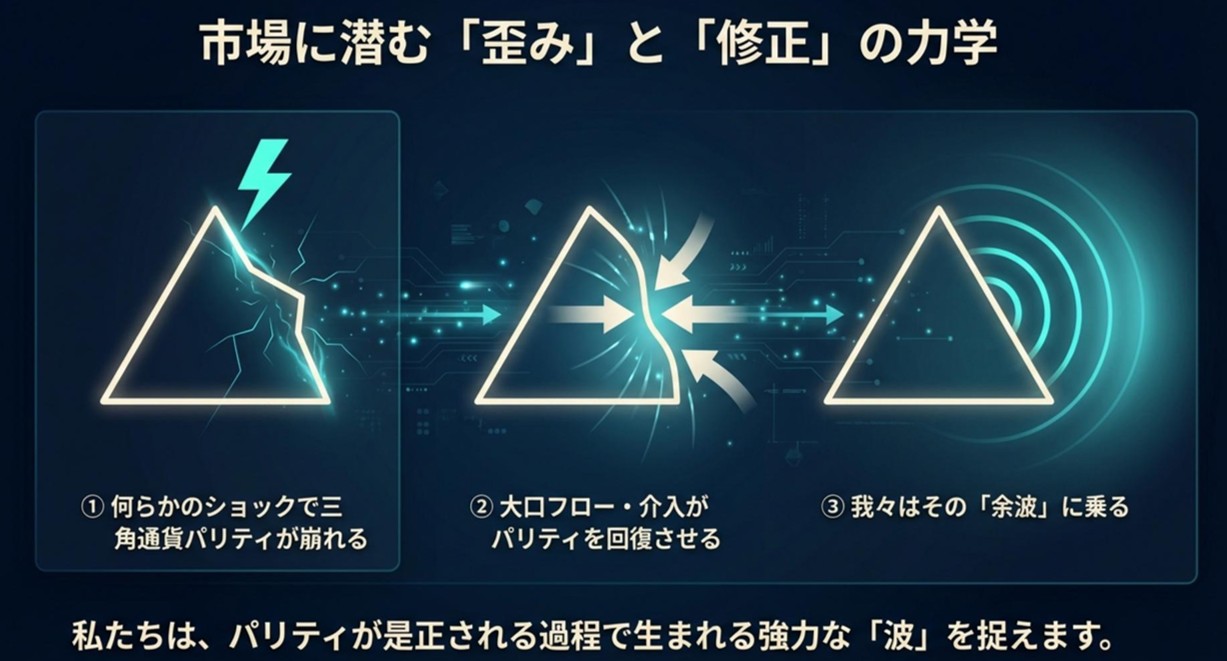
In other words,
- First, a shock causesparity to break
- Seeing that, large flows and interventions move swiftly toward parity restoration
- Within that “moving back” process, individual traders can also share some of the gains
This ②②〜③“the late-arriving movements” are the “Intervention Waves”.
In this series, we aim to capture as simply as possible the sequence “parity break → large-flow/intervention to correct it → its fallout,” and apply it to trading.
1-3.Visualization of Real GAP: Free Tool “Intervention WavesTriParity LiveGAP”
The real-time deviation of triangular parity, i.e., how far it is from the parity today (GAP), is displayed in a free indicator“GAP” called “TriParity LiveGAP.
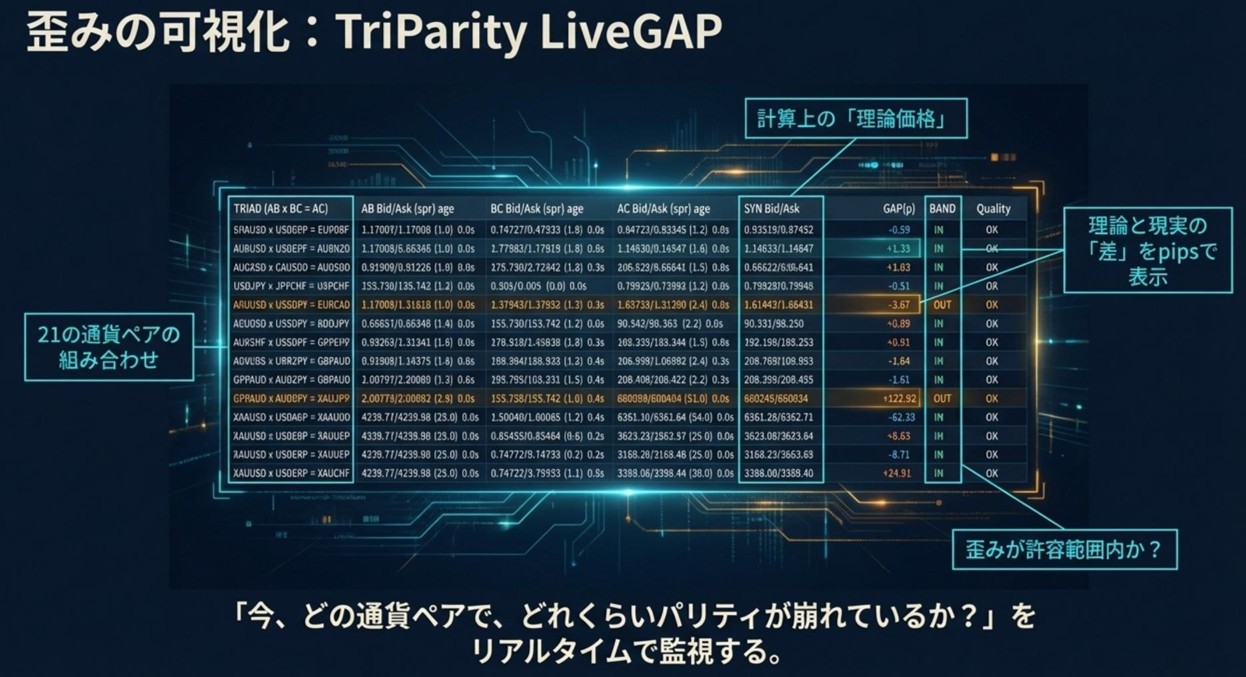
LiveGAP shows, for 21 representative Triads
- TRIAD: the combination of three currencies (AB×BC=AC)
- AB / BC / AC3 legs each have Bid/Ask and spreads, and elapsed seconds since the update
- SYN:theoretical AC (synthetic theoretical price) calculated from AB and BC
- GAP: difference between theoretical price and actual AC (in pips)
- BAND: whether GAP is inside or outside a predefined band (IN / BAND OUT / WARN)
This information is displayed in real time. When you want to know “which Triad and how much parity is broken now?” you can directly see it with this tool.LiveGAP is the simplest and most intuitive tool for that.
The Nowcast introduced in this article and the Intervention Wave CatcherNowcast and Intervention Waves Catcher are designed to reflect the real-looking GAP movements seen inLiveGAP, combining withreal-timeGAP
- statistically standardizedZscore
- environmental information such as pivot points and Fibonacci
- multi-time-frame flow
combined to assess whether the GAP (parity correction fallout) is worth trading now, acting as a
“second opinion”.
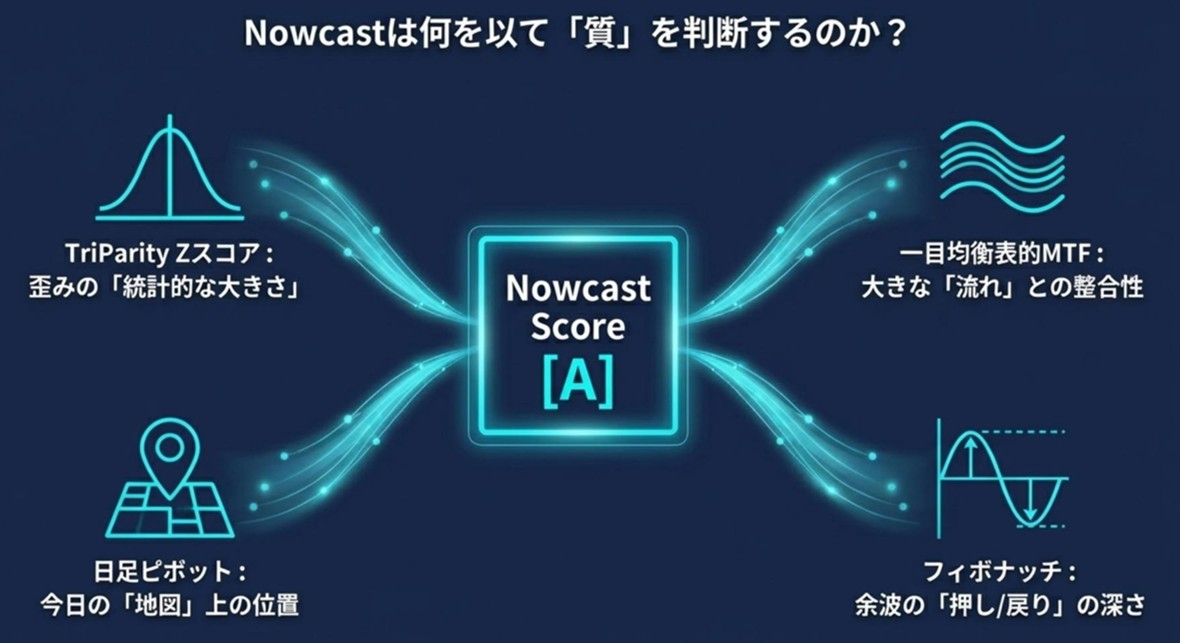
2.The role of Intervention Waves Nowcast
2-1.What the Catcher sees vs. What Nowcast sees
The “Intervention Waves Catcher” usesTriParity Z-score to determine
- which currency pairs
- at what timing
“Whether fallout from parity restoration is likely to appear” as a signal.
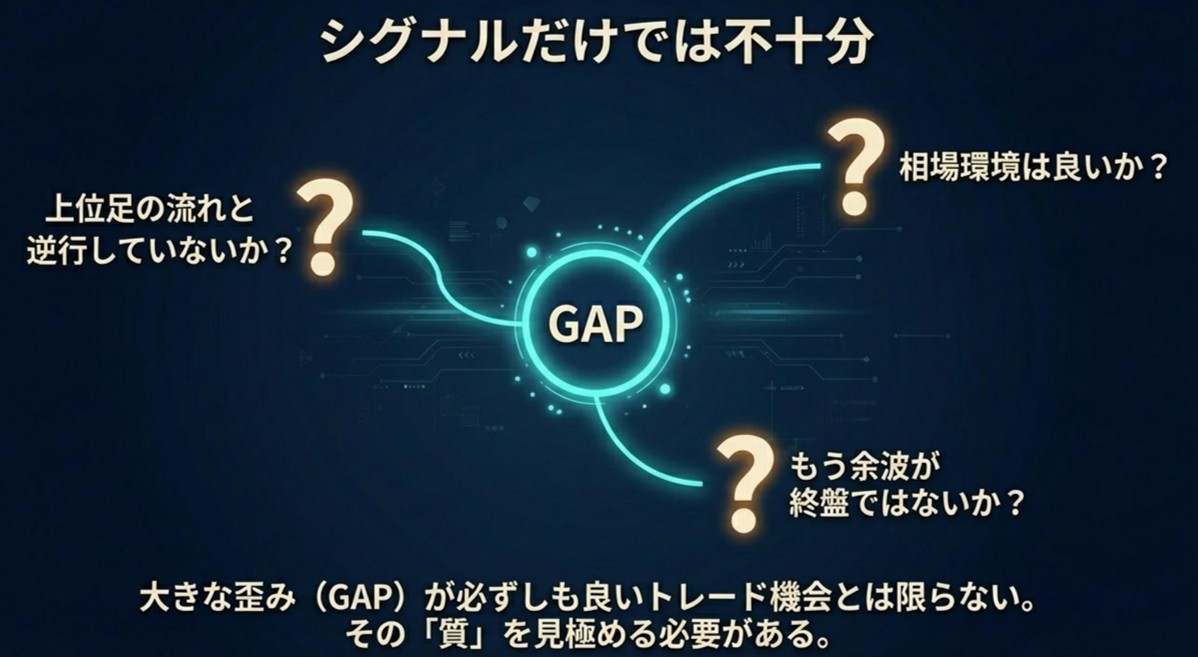
However, whether to actually enter depends on
- whether the current market environment is conducive to trading
- whether the fallout is not already nearing its end
- whether it does not contradict the trend of higher timeframes
and other factors called the “quality of environment.”
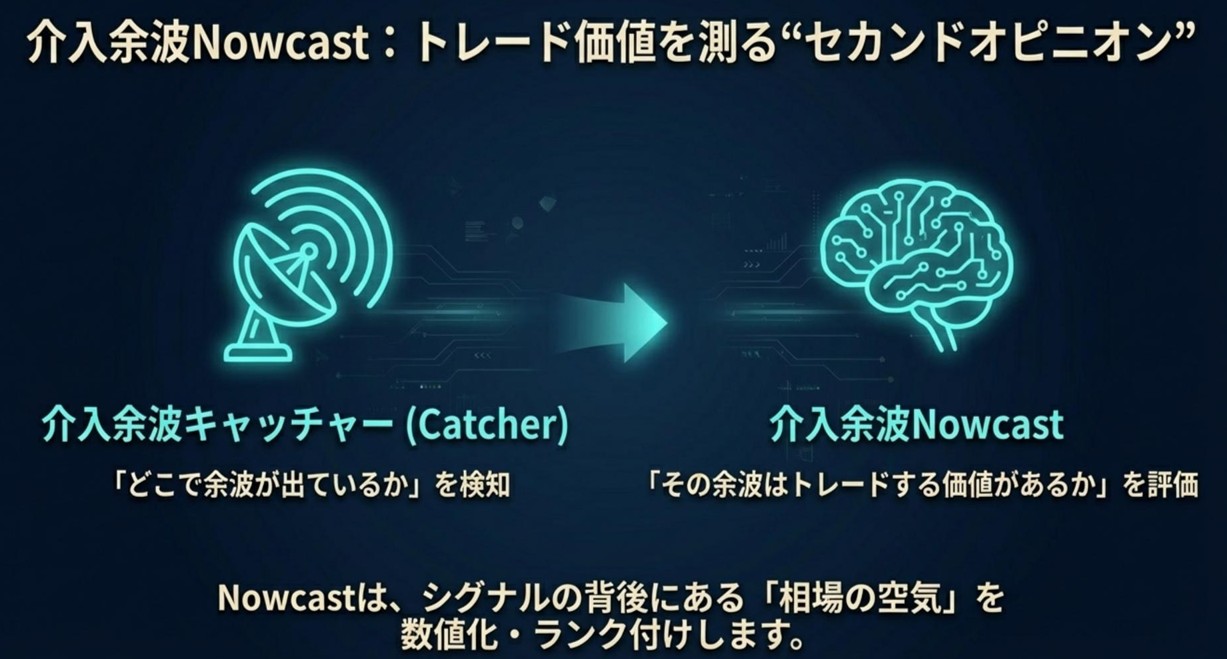
To address this, we prepared the“Intervention WavesNowcast”panel.
- Catcher:
“Where is the parity correction movement ( fallout ) occurring?” to indicate - Nowcast:
“Is that fallout in a state worth trading now?” (In “Intervention Waves Pro,” only A signals can be generated. Other settings include B+, C+, all, etc.)
That is the role allocation.
2-2.Why adopt the “standard logic”?
We adopted the following three as the axes of environmental recognition.3
- Daily Pivot Point
- Ichimoku-like multi-time-frame flow(Approximate by TriParity slope)
The reasons are simple:
- Many traders already know or have heard of them
- They succinctly express core environmental elements like “where to enter,” “how far back,” and “which direction is the major flow.”
- They combine naturally with the slightly special logic of Triangular Parity
That’s why.
3.Grasping the image of the standard logic
3-1.Daily Pivot Point ―“Know the map of one day”
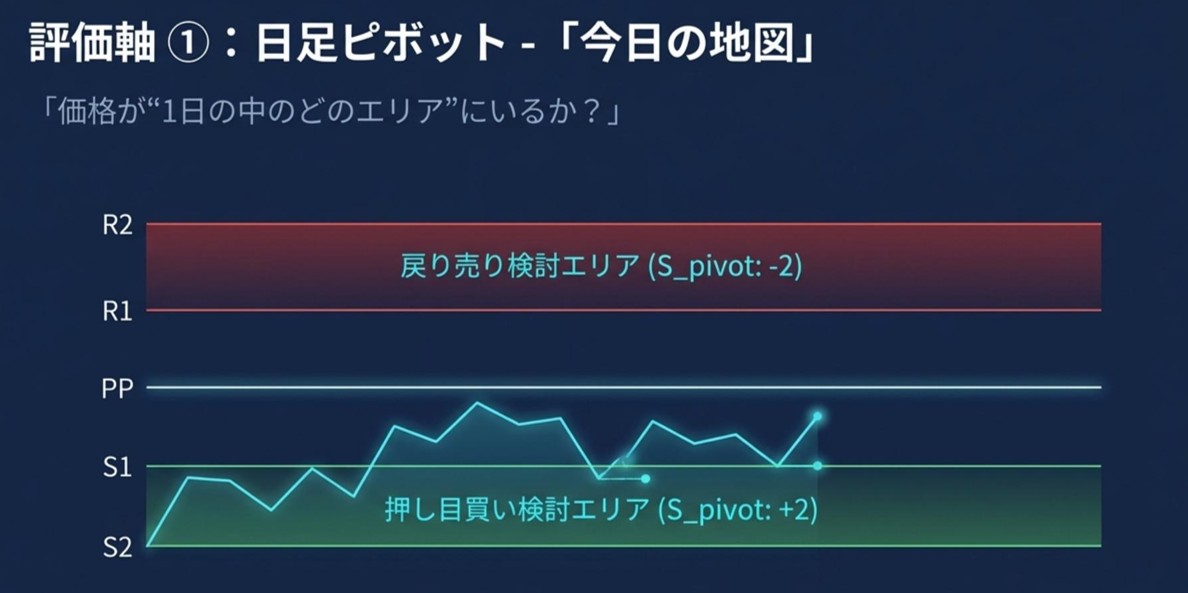
Pivot points are calculated from the previous day’s high, low, and close, and serve as the “basis value for today.”
- Center: PP
- Lower: S1 / S2(Support)
- Upper: R1 / R2(Resistance)
so
- If price moves far below PP into S1–S2
- Conversely near R1–R2
This gives a rough idea of the one-day position.
If it has already reached the edge of the map → don’t chase; if still near the middle → fallout early stages.
These are the decision aids.
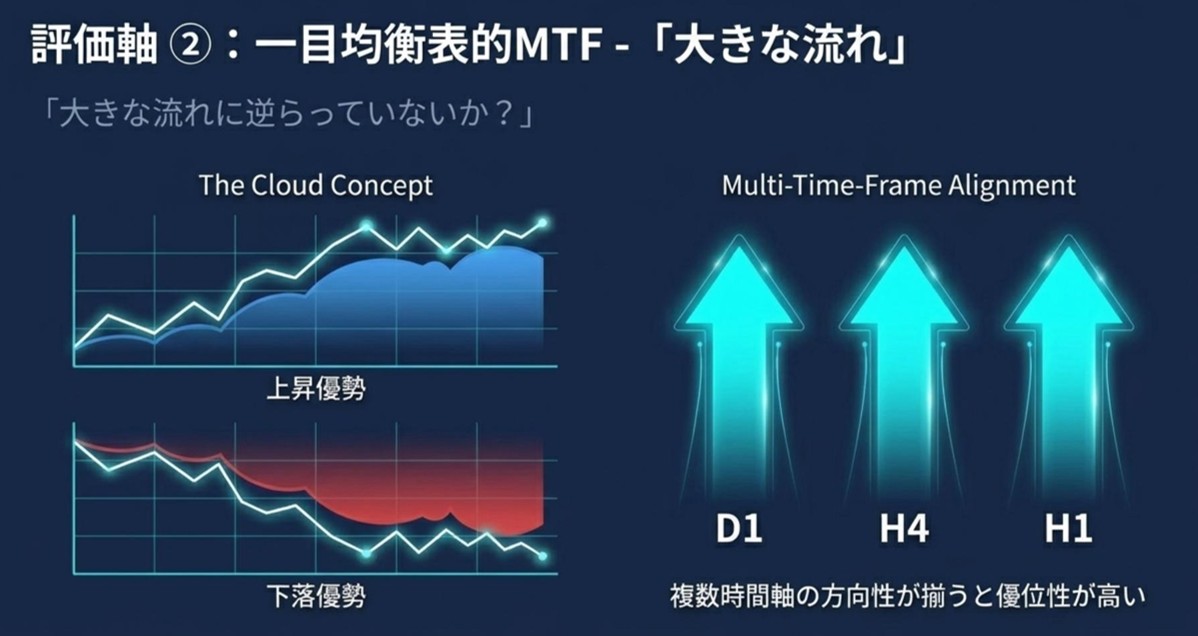
3-2.Ichimoku-like MTF Judgment ―“Are we not going against the big trend?”
Ichimoku includes
- Cloud (Leading Span)
- Conversion Line / Base Line
- Lagging Span
and is used to see
“how the current price compares to a time-shifted balance”.
Typical readings are:
- Price above the cloud and Lagging Span above price → Uptrend favored
- Price in the cloud → Range
- Price below the cloud → Downtrend favored
Thus, it captures the direction and strength of the big trend in a rough way.
In Intervention Wave trading,
- If the big trend is up, but short-term fallout is downward, avoid forcing trades
- Alternatively, select fallout moving in the same direction as the big trend and ride it
Then the expected value changes.
Nowcast does not draw Ichimoku directly on the chart, but
- Evaluate the slope of TriParity Z score using base and higher timeframes (e.g.,H1,H4,D1)
- Quantify each timeframe as Long/Short/Neutral
to reproduce, in a near form, the effect ofone look at the Ichimoku “flow.”.
3-3.Fibonacci Retracement ―“Where in the fallout are we?”
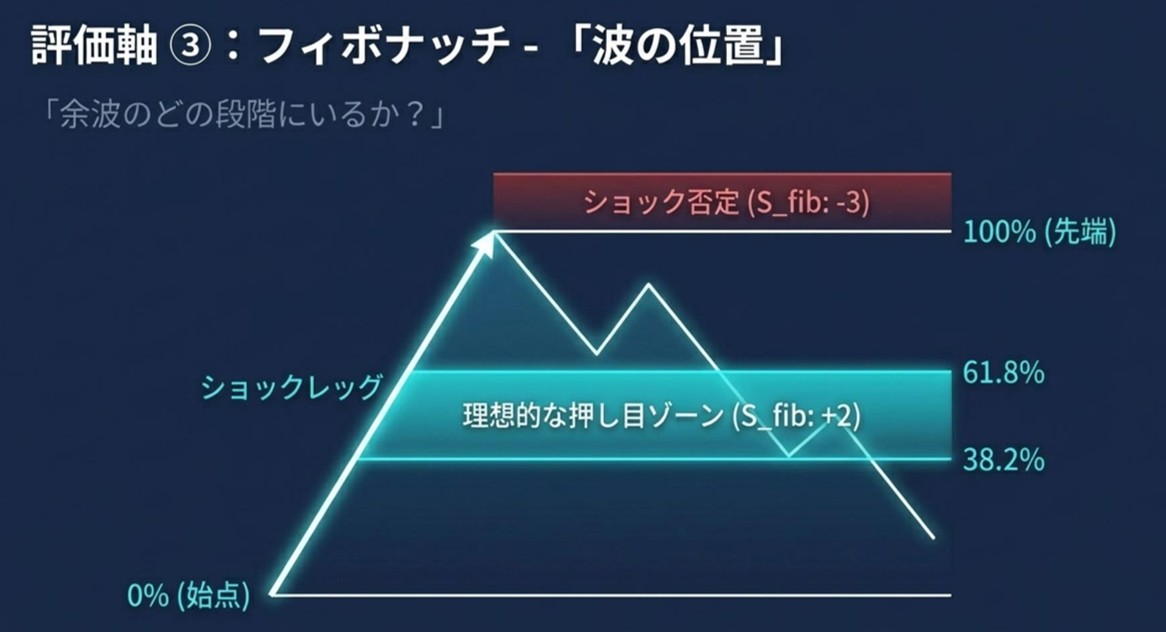
Fibonacci Retracement is a tool to measure the extent of push/pull from 0% to 100% of a move.
Common references are:
etc.
- Triangular parity breaks, large-flow moves to parity restoration → a strong “shock leg” forms in one direction
- Then, profit-taking and contrarian moves create pullbacks and retracements
- If pullbacks are around 38.2%–61.8%, it’s a zone where you can ride the second or third wave of fallout
This is the image.
Nowcast quantifies the depth and quality of push/pull via Fibonacci, and assesses whether the current fallout remains within an attractive pullback/press range.
3-4.What do the four combine tell us?
To summarize thus far,Nowcast includes:
- TriParity Z score
- “How broken is parity” and “how strong is the correcting move”
- (Real GAP visualization is LiveGAP; statistical standardization is Nowcast)
- Whether that movement occurs in which zone today
- Whether the base-to-upper timeframe flow aligns
- Whether fallout pullback/pressure is just right as a move up or down
All of these are summarized into a single score and rank (A/B/C/NG).
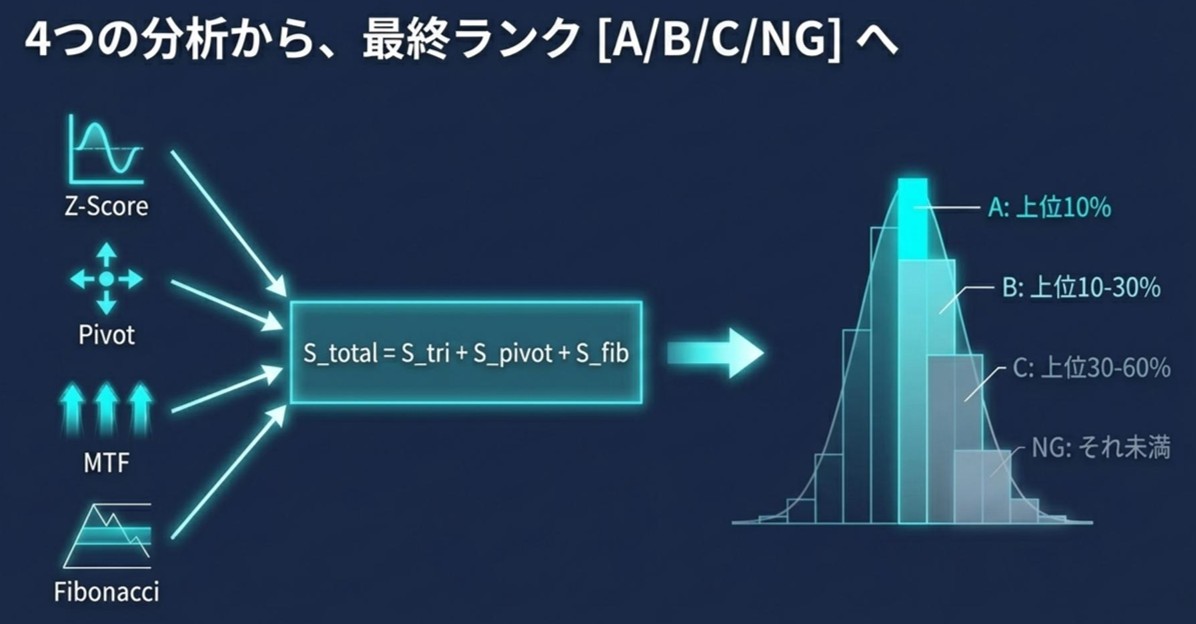
- A
- B
- C
- NG
3-5.Practical usage in trading
In practice, you could think like this:
- When catcher signal appears, first look at Nowcast
- Only enter seriously on A; be cautious on B; skip C
- If after entry ranks fall from A → B → C, then consider taking profit as the fallout nears its end
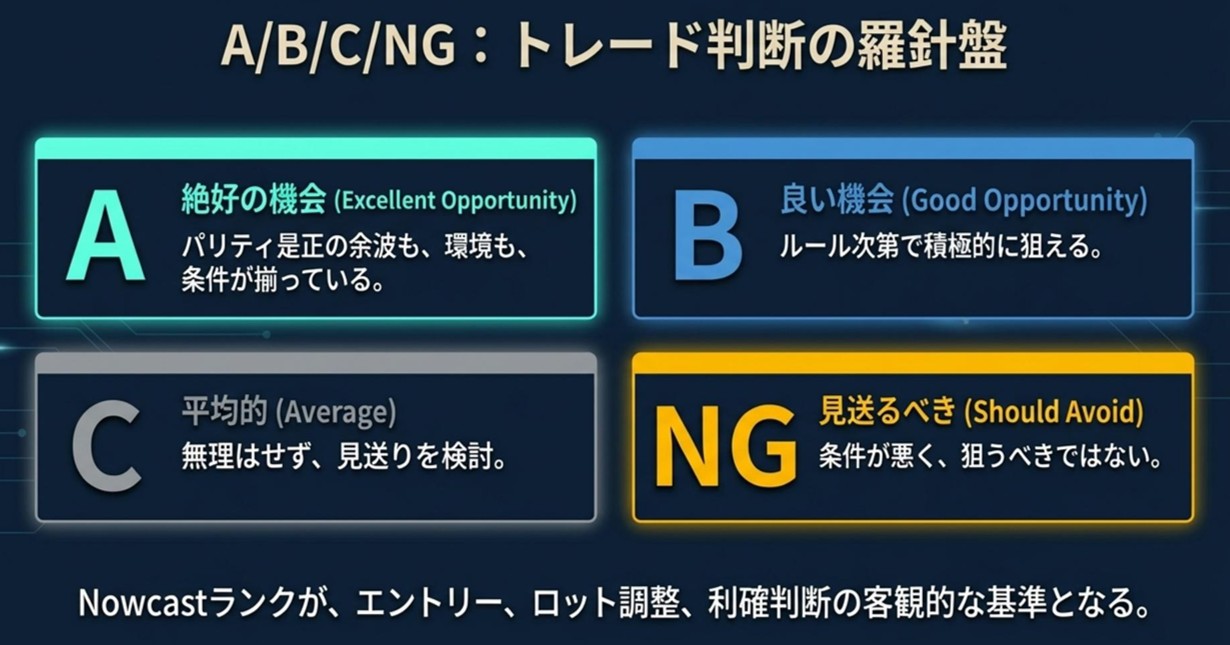
In other words, Nowcast is a second opinion that clearly shows the market sentiment behind signals in numbers, which is acceptable.
4.Nowcast Panel
4-1. NowcastPanel Structure
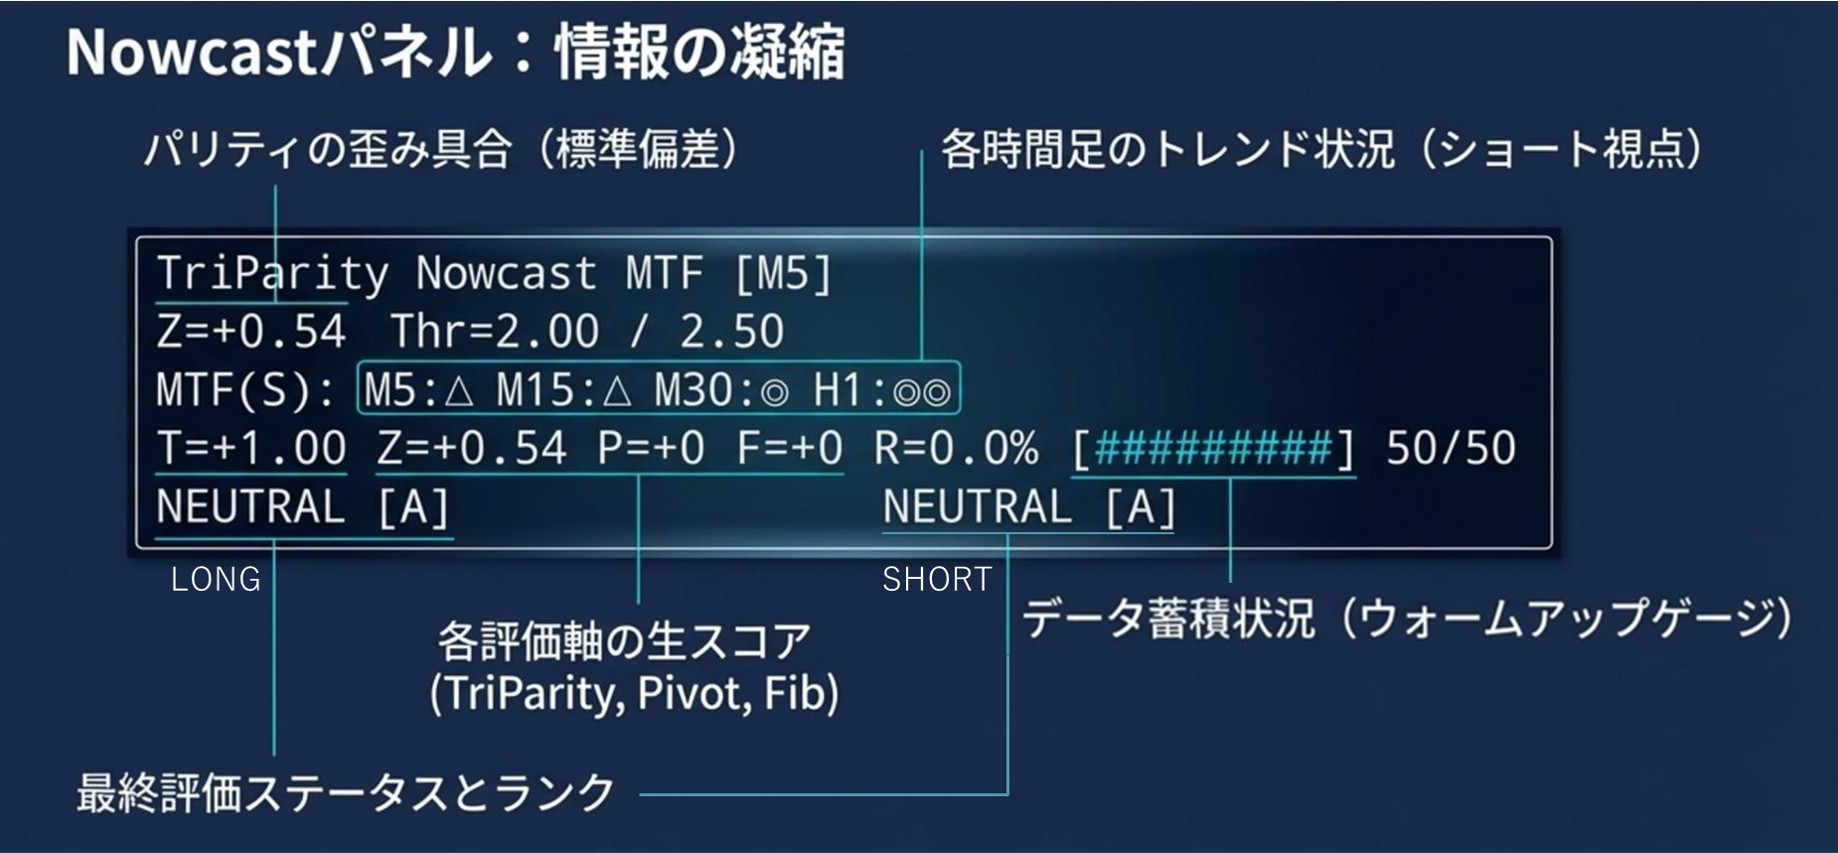
In the oscillator window’s top-left, you will see boxes like the following.
TriParity Nowcast MTF [H1]
Z=+1.94 Thr=2.00 / 2.50
MTF(S): H1:△ H4:△ D1:△
T=+1.00 Z=+1.94 P=+0 F=-3 R=114.5% [##########] 50/50
NEUTRAL [C] NEUTRAL [A]
Each row represents the following.
- 1Row: Title
- TriParity Nowcast MTF [H1]
- “TriParity Nowcast” is viewed with H1 as the base timeframe.
- 2Row:Zrow
- Z=+1.94
- just-closed bar’sTriParity Z score.
- Thr=2.00 / 2.50
- Entry consideration threshold (standard) and a second threshold for being considered a strong distortion.
- 3Row:MTF row
- MTF(S): H1:△ H4:△ D1:△
- show the slope levels of each timeframe with icons.
- ◎◎: very strong
- ◎: somewhat strong
- △: neutral
- ×: somewhat weak
- ××: quite weak
- 4Row: Score row + Warm-up gauge
- T=+1.00:TriParity score (S_tri described below)
- Z=+1.94:same Z score as the second row (reposted for debugging)
- P=+0:Pivot score calculated from the daily pivot position
- F=-3: score
- R=114.5%:retracement rate for the shock leg
- [##########] 50/50:
- Gauge showing whether enough samples have accumulated to compute a distribution-based rank.
- Right side, 50/50 means there are currently 50 samples out of 50 needed.
- 5Row:LONG / SHORT
- Left: Longs evaluation
- status + rank
- Right: Shorts evaluation
- Example: NEUTRAL [C] NEUTRAL [A]
- Although both directions are neutral, the rank shows that Short is more favorable, i.e., A (quite favorable).
5.Summary―Grasp Intervention Waves as an overall environment”
Finally, here is a compact recap of the flow so far.
- Triangular currency parity breaks
- Large flows and interventions move to restore parity
- The subsequent pullbacks and “waves” 2nd/3rd orders are what we target“Intervention Waves”.
- Free tool“Intervention WavesTriParity LiveGAP” provides, as a preface,
a real GAP view in 21 21 across a list.
- “Intervention Waves Catcher” signals fallout timing using the TriParity Z score.
- And“Intervention Waves Nowcast” uses
TriParity Z score with - Daily Pivot
- One-Goal MTF Judgment
- Fibonacci retracement
to determine, in a simplified rank of A / B / C / NG, whether the fallout remains an attractive opportunity.
- First, focus on signals A and B
- As you gain experience, adjust lot sizes (large on A, small on B)
- Use exit logic (A → B → C; take profit if it falls)
Such steps seem realistic.
The combination of the “physical law of Triangular Currency Parity” with familiar Pivot / Ichimoku / Fibonacci logic forms the core of the Intervention Waves Series—Nowcast—it is hoped this article helps you visualize the approach and uses more clearly.