

[Free Gift Included] Do Distortions Truly Exist? [Aftermath of Intervention] LiveGAP Triangular Currency Parity (MT5 Indicator) Visualizes the 21-Trinity GAP for the First Time
Hello,TriParity Labs Tokyo here is Kaz.
In the previous articles, we examined the FX market’s“Triangular Parity”窶ヲthe fundamental law of market movement窶ヲ and the distortions (Distortion) that arise the moment this law breaksfrom an arbitrage logic and a statistical perspective.

In particularIntervention Aftermath Provisualizes those distortions asZ-scores (deviation from equilibrium)and has proposed using the short-lived misalignments as “traces” for trading decisions.
However, to be honest—
this explanation left readers with a natural question that many would ask.
「Does that distortion really constitute a misalignment in price?」
「I get the Z-score. But please show me how many pips the misalignment actually was」
This time, we have finally reached a stage where we can answer this question directly.
Before the Z-score distortion, I wanted to establish the GAP first
The Triangular Parity can be written as a formula like this.
AB × BC = AC
Example:EURUSD × USDJPY = EURJPY
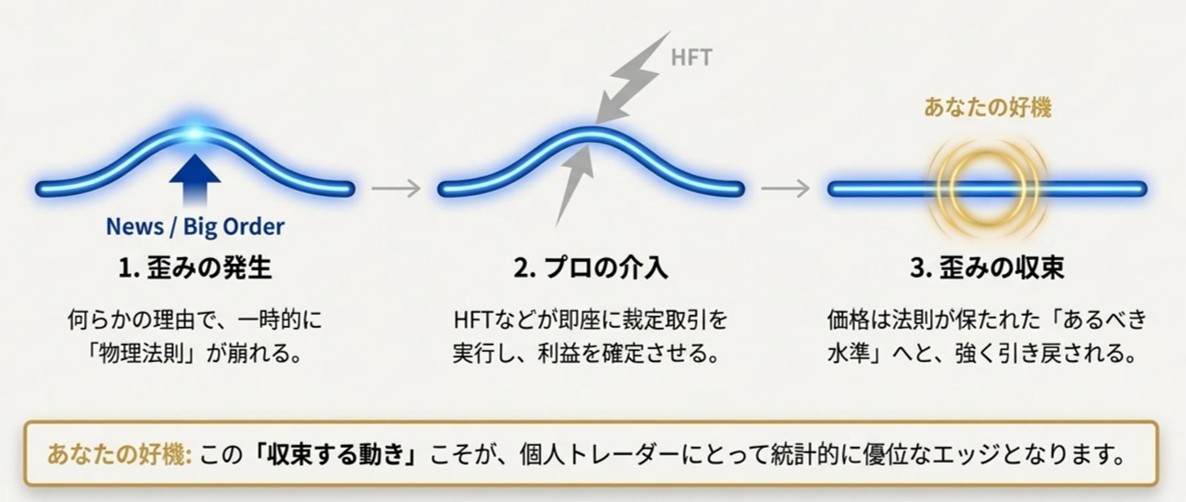
The logic is that if AB and BC are known, AC can be calculated, and the market price of AC must match that calculation.
If even a small deviation occurs, an arbitrage opportunity arises, and professional flow will “instantaneously correct it”—that is how the market structure has been described.
However, it had not been demonstrated in a visible way whether this can be observed as a price (pips) misalignment.
I believe this is where the series had a gap.
We created a free tool that displays 21 Triad GAPs in real time
So this time,a tool to visualize the existence of GAP as a price differencehas been newly developed. It is the new product (free) 【Intervention Aftermath】 Triangular Parity LiveGAP for MT5(Free).Scheduled for mid-December release⇒ Released on December 16

This toolfor all 21 Triad setswill
-
AB / BC / ACLIVE Bid/Ask
-
Derived from AB×BCTheoretical value (SYN Bid/Ask)
-
Difference between theoretical value and LIVEGAP (pips)
-
Whether inside or outside the theoretical rangeBAND (IN/OUT)
-
Data reliabilityQuality (OK/WRN/BAD)
will beconstantly updated in a tabular form.
In other words, what has been discussed as “distortion” so far has been put into a directly observable form as
“the raw price difference (GAP) prior to the Z-score”that anyone can see.
Key point this time: highlighting the moment it exceeds the tolerance threshold (the theoretical range)
This time, simply displaying the GAP is not enough.
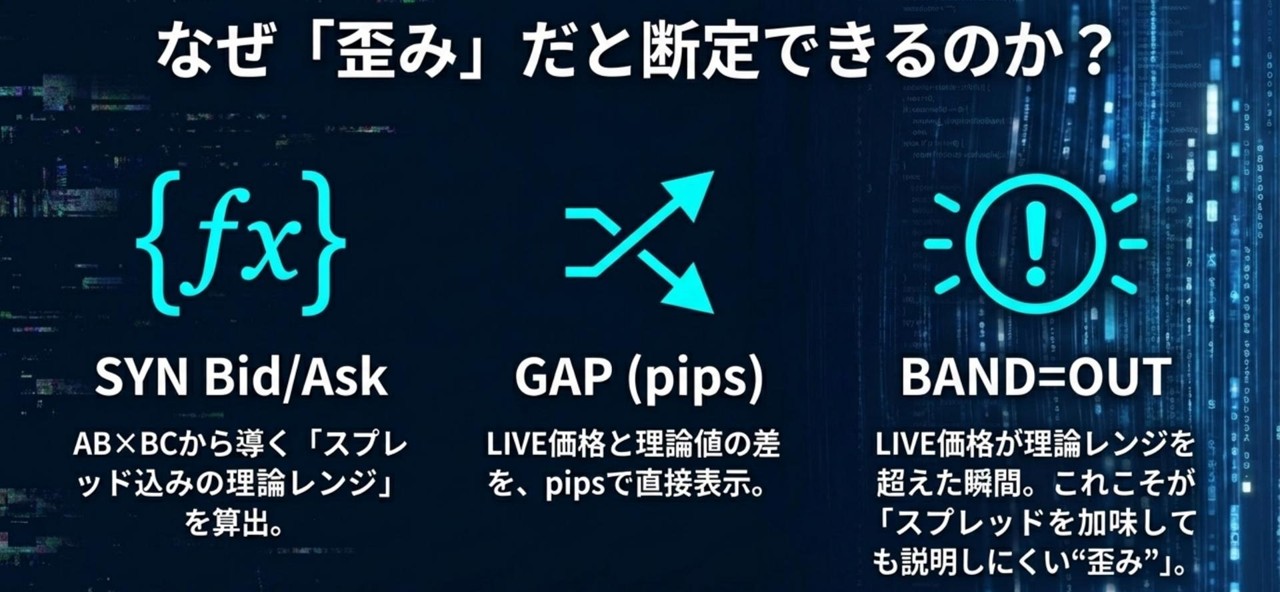
LiveGAP calculates the theoretical value not as a simple Mid comparison but asSYN Bid/Ask(theoretical range including the spread)
And when the LIVE price of AC moves outside this theoretical range, it is judged asBAND=OUT.
-
BAND=IN: inside the theoretical range (within an explainable spread)
-
BAND=OUT: outside the theoretical range (a distortion that is hard to explain even when accounting for spread)
Furthermore, the rows with BAND=OUT arehighlighted.
To me, this BAND=OUT carries the following meaning.
GAP temporarily exceeding the allowable threshold
→arbitrage flow becomes more noticeable
→(as a result) there is a tendency to return to the Band
Of course, the “arbitrage intervention by professionals” mentioned here is not definite. However, at leastthe fact that parity’s theoretical range has been exceeded by priceis recorded and visualized by the tool in real time.

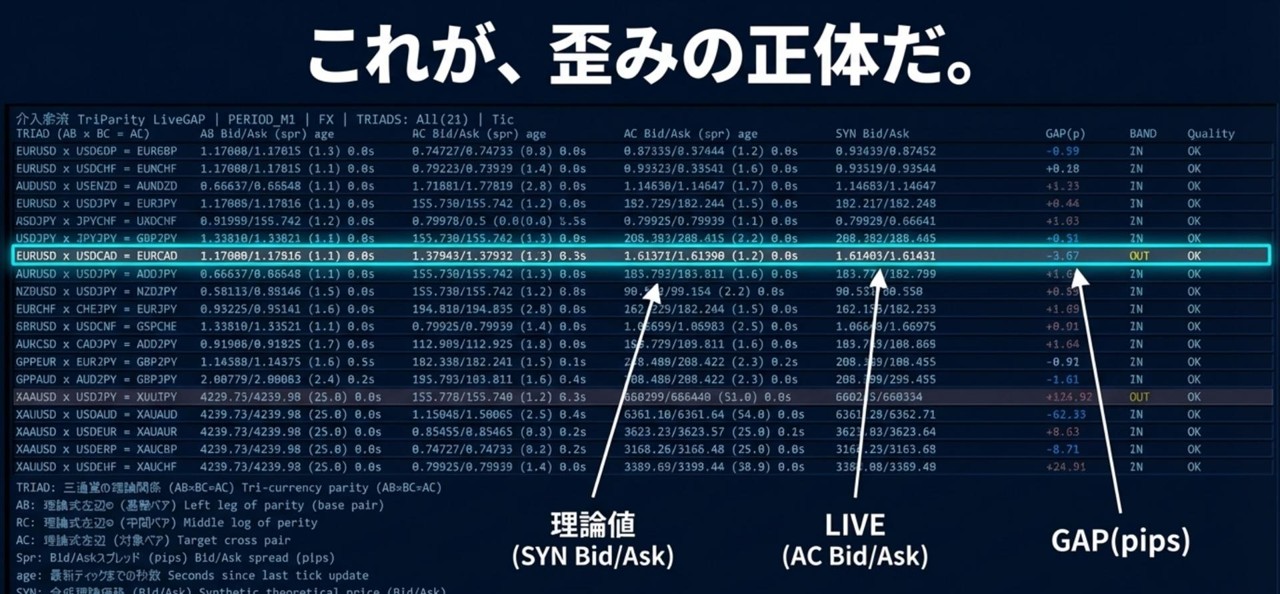
Look at it in a screenshot and you’ll know instantly: Highlight row = Gap proof
Here is an actual screen example.
Highlighted Triadshows that
-
AB×BC=ACis displayed in the left column
-
On the right,SYN Bid/Ask (theoretical value)andAC Bid/Ask (LIVE)are lined up
-
That difference appears asGAP (pips)as a numeric value
-
And because it moved outside the theoretical rangeBAND=OUTlights up the row and highlights it
This is what I wanted to achieve this time.
“Distortion is not a concept, it can actually be observed as a price difference (pips)”
“And it tells you where in the 21 Triads it occurs”
Relation to Intervention Aftermath Pro: Free versionis for “verification and observation,”Prois for “judgment and practical use.”
As you can see from reading up to here, LiveGAP (free) is not a tool that issues buy/sell signals.
Rather, it is a dashboard for
-
verifying that a distortion (GAP) exists
-
observing which Triads it occurs in
-
separating data factors from market factors with BAND/Quality
forobservational purposes.
On the other hand, to apply this in practice, you need the following:
Thisjudgment and timingare provided by the previously introducedIntervention Aftermath Pro (Scanner / Catcher / Nowcast)

In other words,
-
LiveGAP (free): entry point to observe the existence of distortions as price differences
-
Intervention Aftermath Pro: decision set to more practically handle the distortion→reversion phase
The relation is thus.
I don’t want to push too hard, butfor those who want to “interpret and utilize the visible distortions”the Pro-side design philosophy should mesh well.
Summary: Meaning of this update (new tool)

Three points:
-
So far we spoke of distortions; we nowverify them as GAP (pips).
-
Display that GAP across21 Triads in real time.
-
Highlight within BAND=OUT in high-probability situationsthe logic implemented.
This gives a sense that the backbone of the series is now connected.
Finally, we can answer concretely the question, “Do distortions really exist?”
First, experience the free LiveGAP and feel the “observable facts.” Once you can see it, your view of the market will change a little.