

December 15th (Mon): [Bollinger Bands] Nikkei 225 VS Russell 2000
【Note】
I don’t know what will happen in the year-end and New Year market.
Trade with plenty of margin for safety!
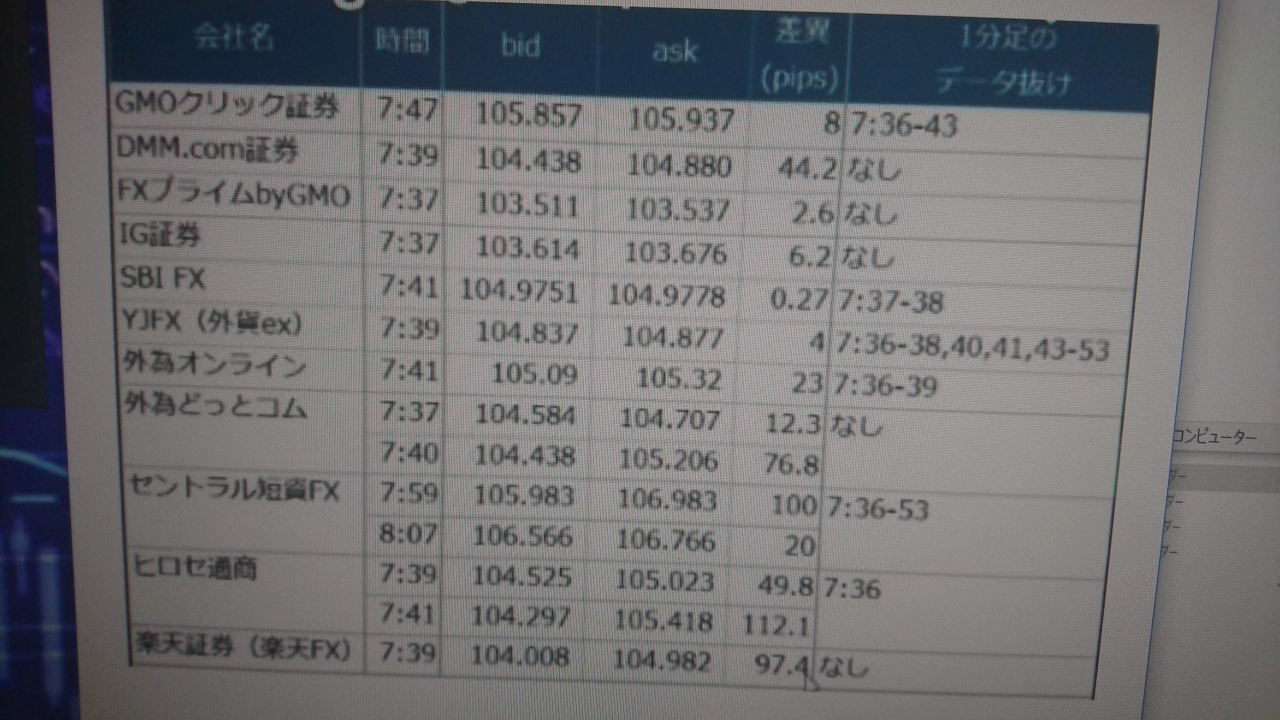
At the beginning of 2019“Flash Crash”occurred.
As you can see in the figure below,
some brokers widened the spread to 100 pips, triggering a loss-cut festival and a margin-call festival.
That is why many investors recommend closing positions at year-end.
Basically, I also avoid holding positions during year-end and New Year, or if I do hold, I keep positions small as a precaution.
Please keep in mind that this kind of thing can happen!
History tends to repeat itself...
【Anomoly】
‘Dragon Year High, Horse Year Low, Sheep Year Impatient, Monkey and Rooster Stir, Dog Laughs, Pig Hardens, Rat Prosperous, Ox Stumbles, Tiger Runs a Thousand Miles, Rabbit Jumps’
is said.
Next year is…‘Horse Year Low’
thus the market may weaken...
Actually next year’s “Horse Year” is“Bing-Wu (fire horse)”.
Even in a “Horse Year,” the market can surge rapidly, but it may also cool quickly, leading to a rapid rise followed by a rapid fall, so the result could be a ‘Horse Year Low’...
That is the general tendency of the anomaly.
Please remember this as well! (*^^)v
This time,
we will compare the “canary in the coal mine” leading the downtrend,
the Russell 2000.
We will compare with it.
【Overall Scenario Probability】
This week’s overall market is...
“Up: 55% / Down: 45%”
Note: Upward MA maintenance suggests a limited upward bias.
Presented for reference only.
【This Week’s Market Highlight Points】
This week’s market highlights include the major four U.S. indices and the Nikkei 225 entering a “limited correction phase.”
The Russell 2000, as a canary in the coal mine, has the leading edge, and while signs of a reversal appear, it is not yet a safe environment.
Meanwhile, the Nikkei 225 is moving near the MA on the daily chart, and the focus is whether it can rebound by catching the rising MA.
Also, Bitcoin is trading flat while its MACD is rising, showing a possible bearish divergence. If Bitcoin develops into a downward expansion, the impact could spread to the four major U.S. indices.
In the paid section, we explain in detail the time-frame specific scenarios and probabilities for each market.
➥The rest is explained in detail in the members-only report.
If you are not yet registered, please go here ↓
● Use “The Decode of the Bollinger Bands” to analyze daily charts
https://www.gogojungle.co.jp/finance/navi/series/1613?via=articles_detail_aside
● Use “The Prescription of Harmonics” to draw a “Zone where charts should stop”Zoneand see how it works!https://www.gogojungle.co.jp/finance/navi/series/1668?via=articles_detail_aside
(Note: The following content is for members only.)


