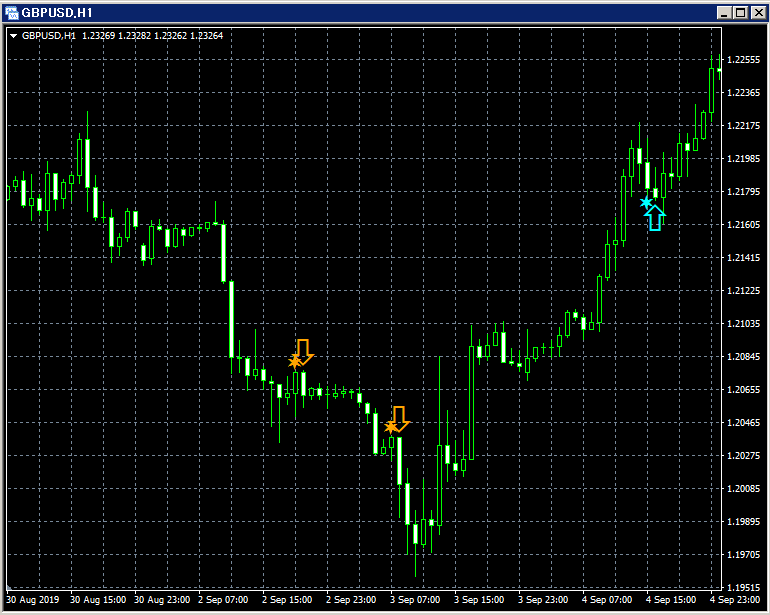
Chart Sign Hunter "SRF2" captures shallow pullbacks
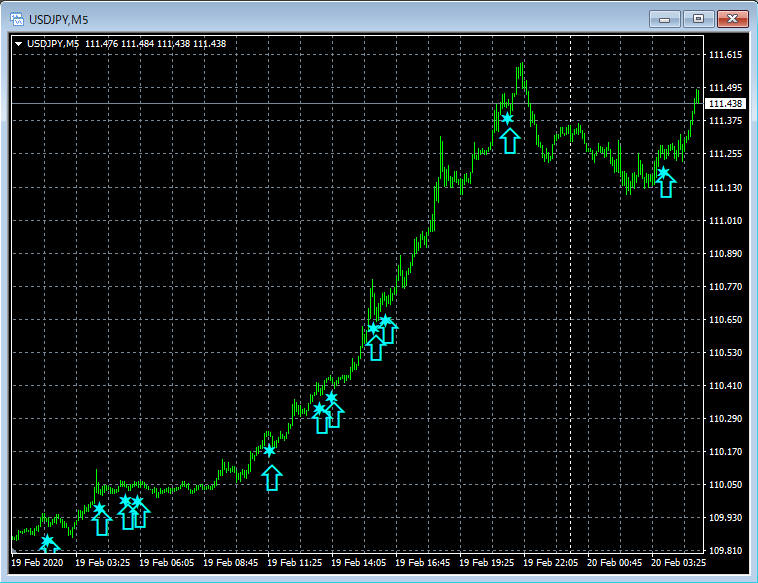
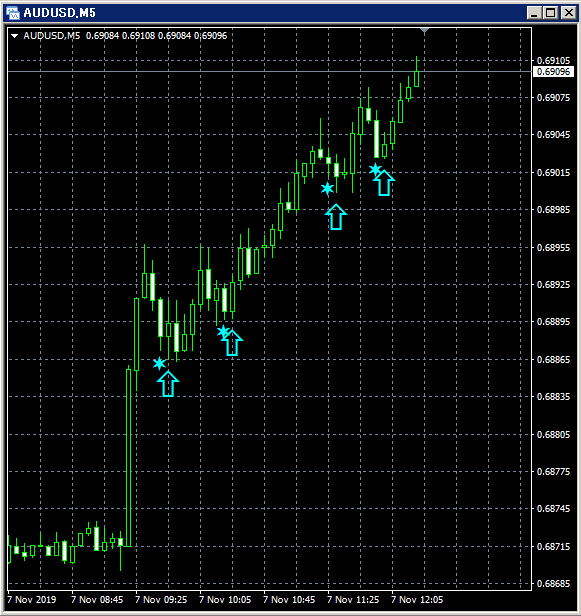
In the below example, SRF2 captures shallow pullbacks that are difficult for oscillators such as RSI and RCI to catch, as can be seen.
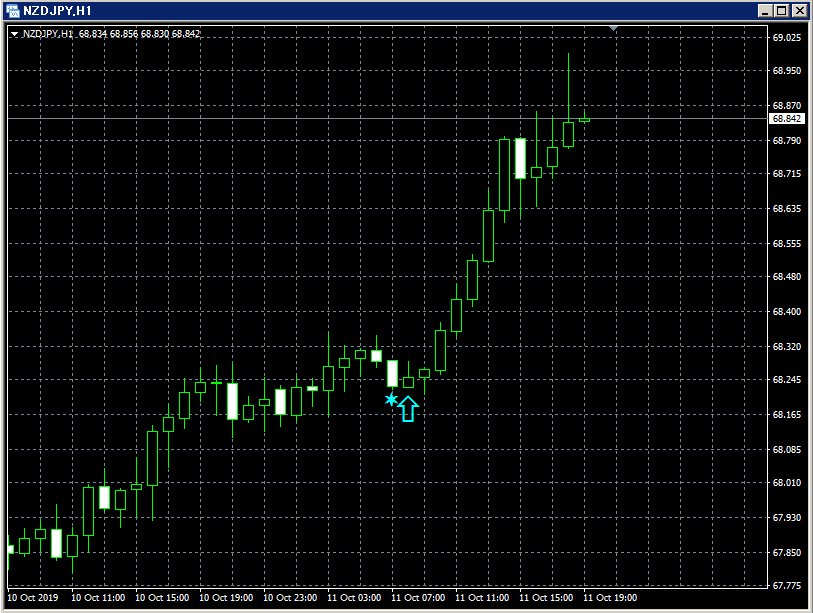
Kiwi Dollar 15-minute chart
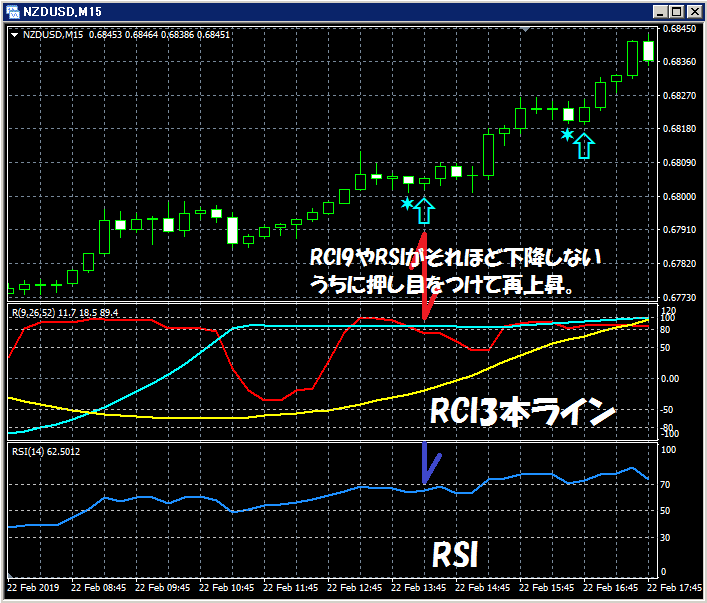
Chart Sign Hunter “SRF2”
During sudden surges or falls and strong trends, oscillators may
fail to capture shallow pullbacks and pullbacks, so you can target pullback buying and pullback selling
× ![]()