

【BTCJPY】20190220 Daily Pivot
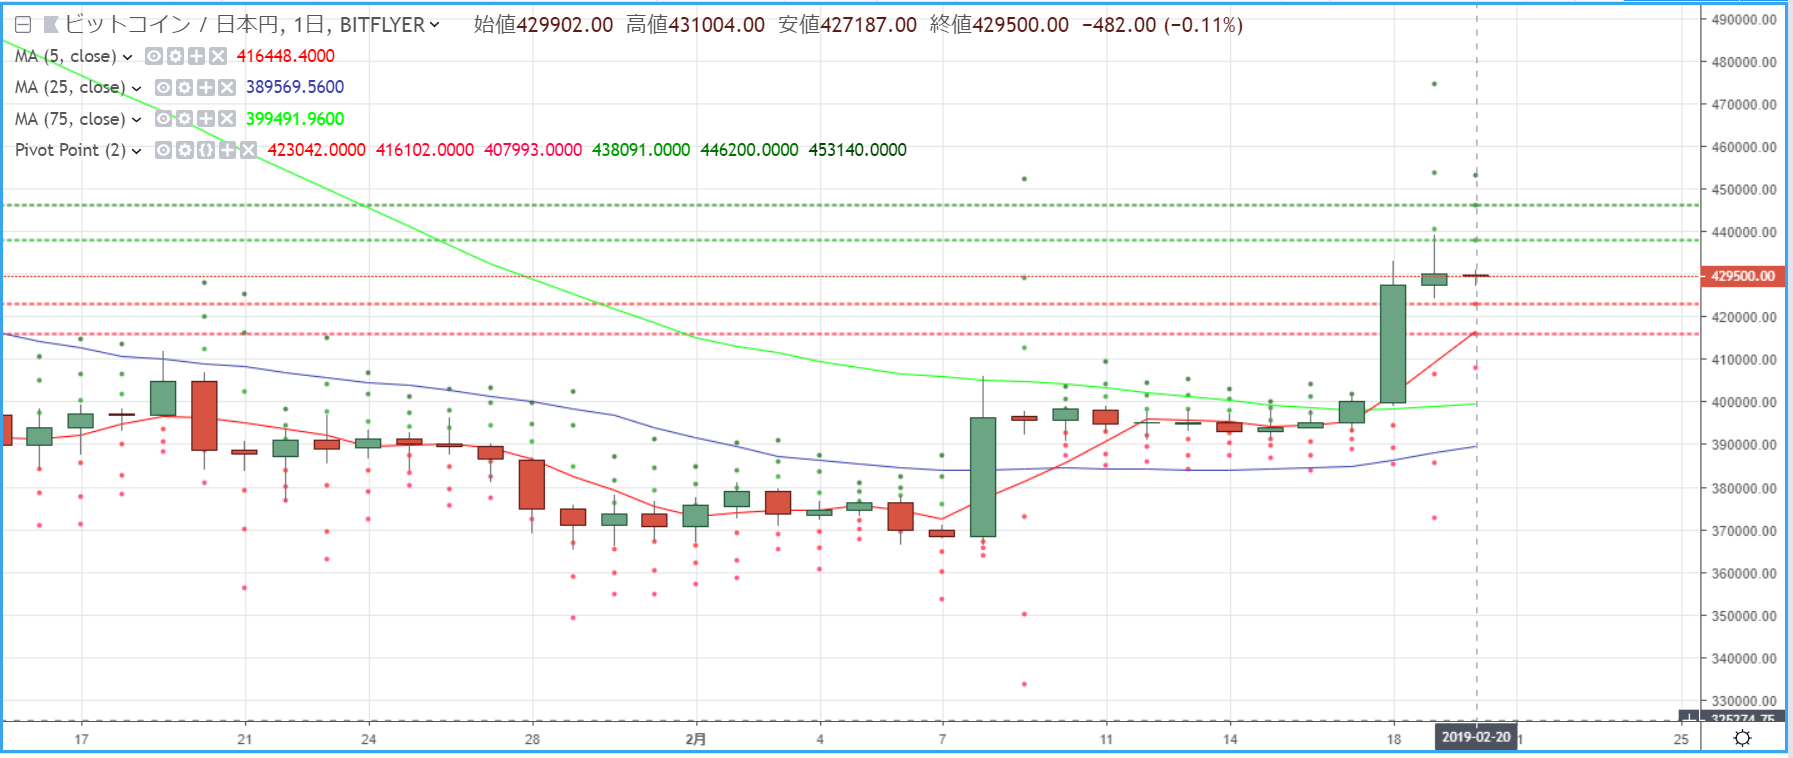
R2=446,200
R1=438,091
S1=423,042
S2=416,102
※ A pivot is a technical indicator that predicts the price movement range for the day based on the previous day's activity. Centered on the Pivot Point (PP), draw resistance lines (R1, R2) and support lines (S1, S2) above and below, using them as a guide for trading decisions.
【Calculation Formula】
Pivot Point (PP) = (Previous Day Close + Previous Day High + Previous Day Low) / 3
Resistance Line 1 (R1) = PP + (PP - Previous Day Low)
Support Line 1 (S1) = PP - (Previous Day High - PP)
Resistance Line 2 (R2) = PP + (Previous Day High - Previous Day Low)
Support Line 2 (S2) = PP - (Previous Day High - Previous Day Low)


