

【BTCJPY】20190212 Daily Pivot
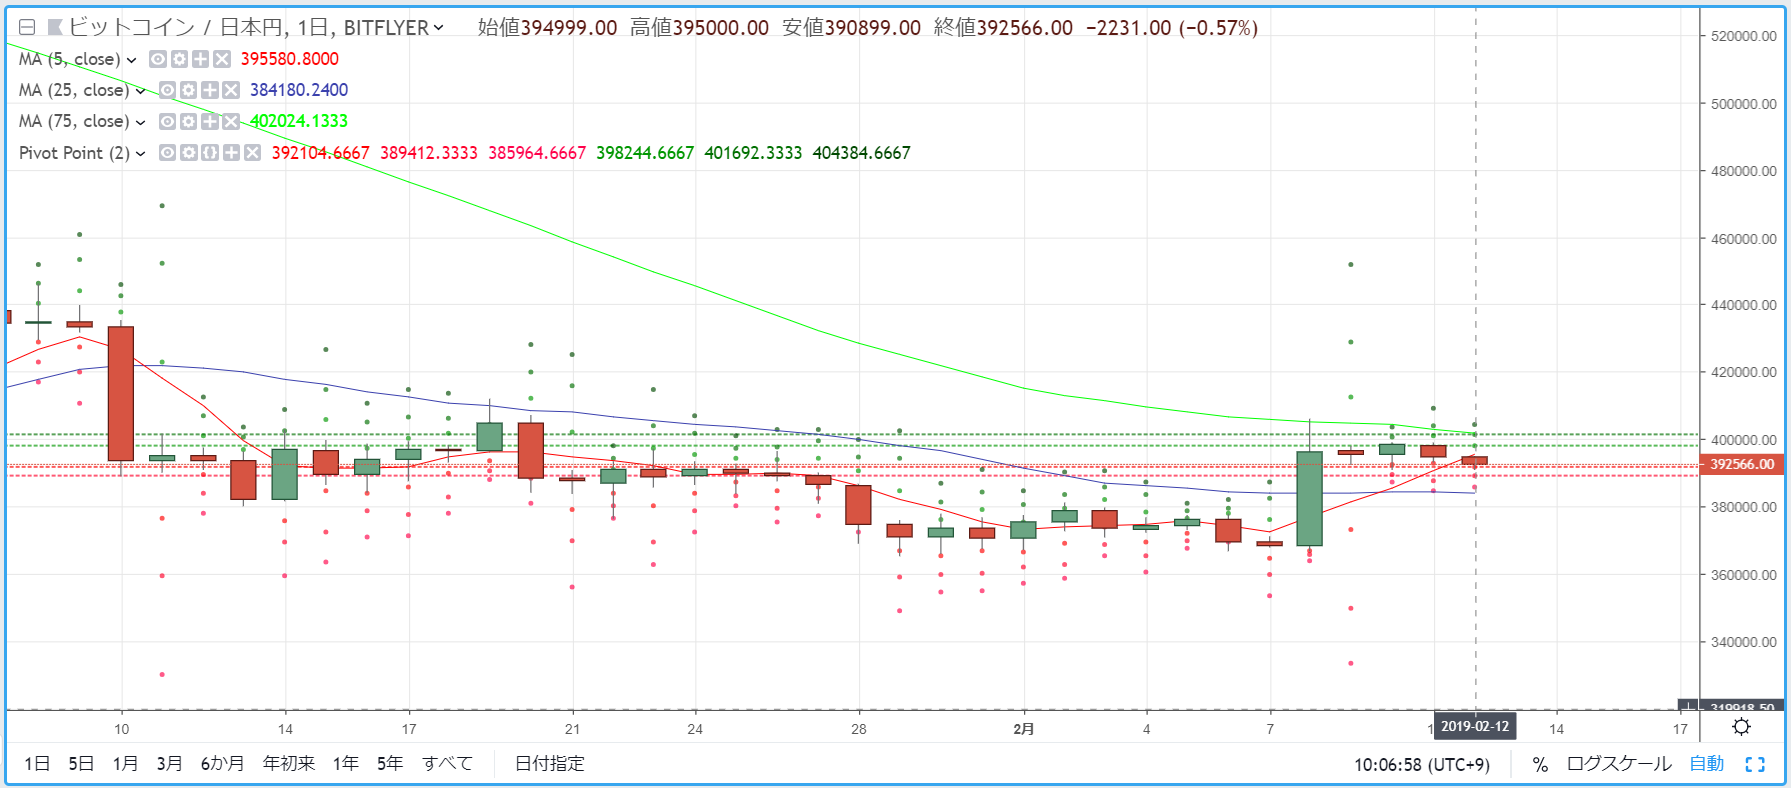
R2=401,692
R1=398,244
S1=392,104
S2=389,412
※ A pivot point is a technical indicator used to predict the price movement for the day based on the previous day's activity. Centered on the Pivot Point (PP), resistance lines (R1, R2) and support lines (S1, S2) are drawn above and below, and these are used as trading references.
【Calculation Formula】
Pivot Point (PP) = (Previous day's close + previous day's high + previous day's low) / 3
Resistance Line 1 (R1) = PP + (PP - previous day's low)
Support Line 1 (S1) = PP - (previous day's high - PP)
Resistance Line 2 (R2) = PP + (previous day's high - previous day's low)
Support Line 2 (S2) = PP - (previous day's high - previous day's low)


