Bollinger Bands FX Method Perspective USD/JPY February 9
How to Read Bollinger Bands: USD/JPY Monthly Chart (Forecast for Next Week)
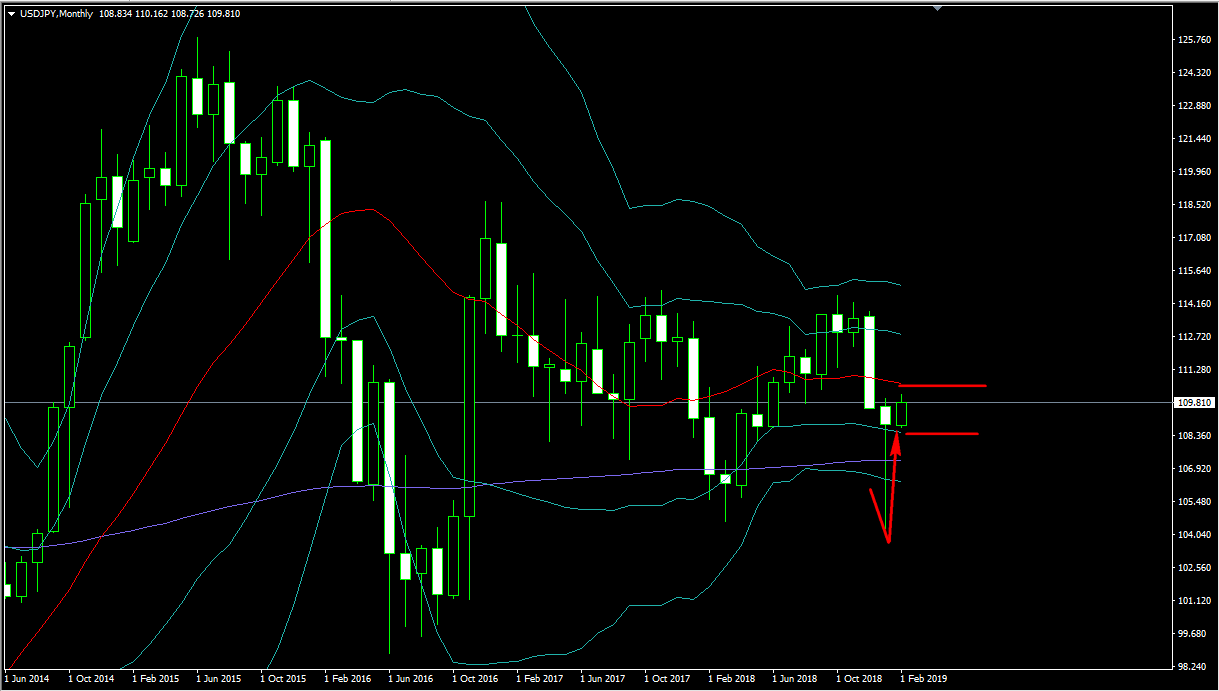
In terms of how to read Bollinger Bands on the USD/JPY monthly chart, the abrupt plunge at the very start of January last month carved a long lower wick and broke through -1σ, -2σ, and the 200MA, which even institutional investors pay attention to. However, since it was only a temporary plunge, there was a rebound greater than the drop, and it is currently confirmed that a bullish uptrend with candles rising between -1σ and the middle band, the 20MA.
× ![]()