

【雲海 UNKAI】【光明 KOMYO】【砂丘 SAKYU】Before reading the market, obtain “visible by looking” understanding. Create your own set of personal rules; here are the materials to do that.
This time, I overlapped and displayed all of the clouds UNKAI, KOMYO, and SAKYU.
At first glance it seems like there would be a lot of information,
but in reality it is built with a “not messy structure.
Each indicator handles a different “layer,” and
even when stacked, there is no visual noise.
【UNKAI CLOUDS (UNKAI)
【KOMYO Light,
【SAKYU Dunes
Originally, these were not designed to be used all at once, but
when actually combined,
“if this happens, do this” becomes easier to systematize in my own mind.
In other words──
“A visual logic that remains unshaken even when overlaid”is common to all of them.
Therefore, for those who want to clarify discretionary judgments or
build more precise personal rules,
this combination serves as an effective training tool.
When stacking, by aligning the “response speed” and “sensitivity” of each tool,
the overall clarity of the chart changes dramatically.
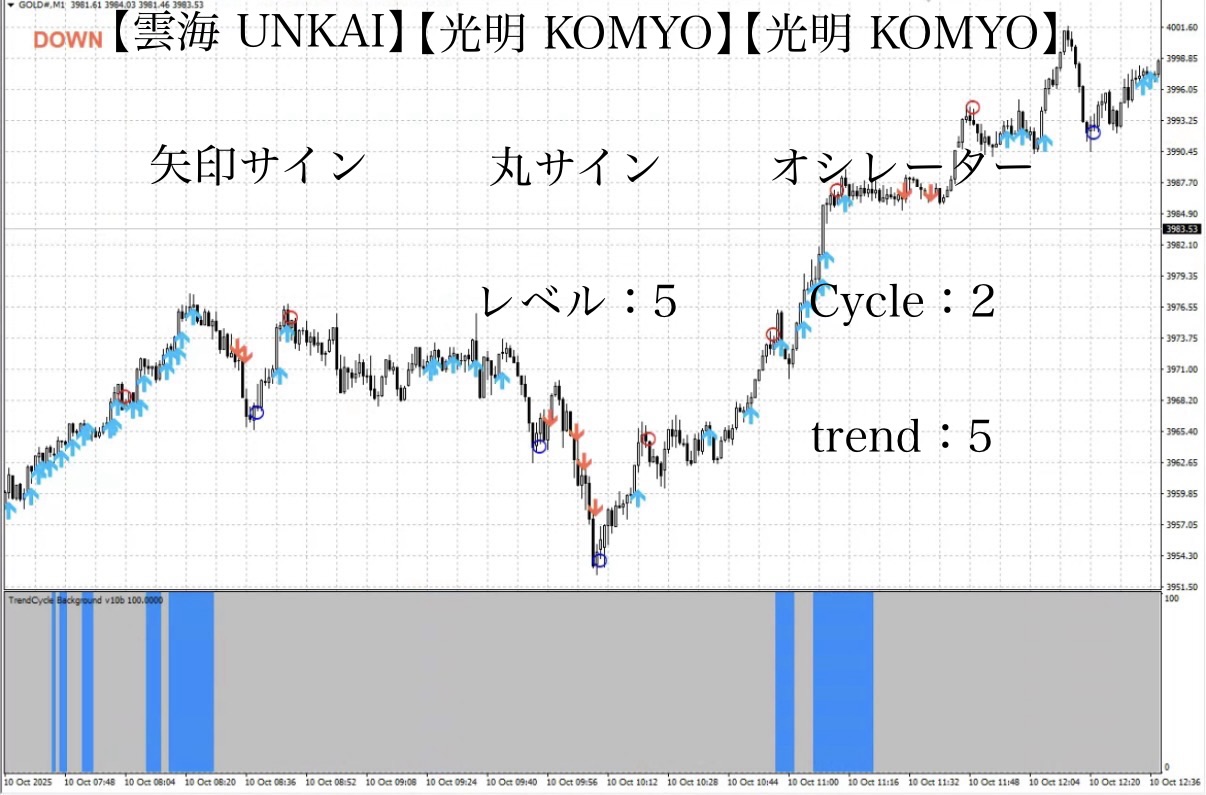
• Clouds (UNKAI)
Because it forms the base that draws the flow,there are no elements that particularly need to be changed.
The ideal is to always be able to overlook the direction of the chart.
• KOMYO (KOMYO)
It serves to capture changes in momentum.
Level (4–5) when set to
it suppresses excessive reactions while pinpointing major momentum changes.
• SAKYU Dunes
An indicator that expresses the thickness and persistence of a trend with color.
Cycle (cycle) 2–3, Trend strength 3–5, when set
reduces noise and improves visibility even further.
With this setting, the three indicators keep their respective roles while presenting the chart more cleanly.
【SAKYU SAKYU】, Learn with a single lunch budget. The trend-viewing indicator born behind the scenes of UNKAI.

Other tool: CLOUDS ↓
Through October 13 (Mon) inclusive
Regular price20,000 yen→Commemorative price 11,111 yenis offered.
Also,during October, related tools are available at special pricesfor use.
Both are designed to reduce trading hesitation.
KOMYO (KOMYO) MT4 version indicator, and other tools to prepare the entire environment, I think this is an optimal timing.
Please, at this opportunity,use as a tool to strengthen your own rulesif you can.
We would be happy if you could.
If you want to use a signal-reading UNKAI entry EA,
purchase either “UNKAI” or “KOMYO” and use it from the thread in “Trail to the Narrow Gap.”

This EA is not made paid; however,
the password check will notify who downloaded it.
Therefore, we would appreciate your cooperation with the usage terms.
Also, we have created a manual.
You can view it in the manual thread of the same community.
Optimize operation with level adjustments to fit the market
In ranging markets, entries and settlements following UNKAI signals are not highly recommended.
Only in markets where a trend is present can UNKAI signs perform their true power.
However, in a truly ranging environment,by combining “UNKAI entry” with “KOMYO level 1–3 settlements,”
you can repeatedly trade rhythmically even with small price moves.
On the other hand, where a clear trend appears,
UNKAI acts as a guide to pullbacks and pullbacks,
raising KOMYO levels to 4–5 to operate,
enabling settlements when profit has largely accumulated.
⸺
Automating trend judgment with the “UNKAI Entry EA”
UNKAI Entry EA includes a trend judgment function using the ADX value.
This allows entries to be made automatically after some automatic range/trend assessment,
reducing unnecessary entries when momentum is absent,
and letting the EA ride the wave only when momentum appears.
Also, KOMYO sign has a level adjustment function from 1–5,
• In a range with weak momentum →Levels 1–3
• When a clear trend appears →Levels 4–5
Adjusting in this way allows flexible operation according to market conditions.
⸺
◆ Notes about settlements
Regarding settlements, you may refer to trading examples, or decide the rule for settlement after you are in profit.
Leaving it idle and letting a do-then-trade operate can yield hundreds of pips when a large trend runs.
However,so please use with defined profit-taking and stop-loss criteria.
Lastly
If you have any requests like “please verify with this rule,” please tell me in the comments or messages.
By treating verification as a topic, it can lead to future updates and improvements.
There are scenes where the UNKAI signs are particularly evident during Tokyo time early hours or New York time; the charts on Investor Navigator may be helpful, so please take a look as well.
In GOLD 1-minute charts, there are times when markets extend even beyond what was seen as scary when a contrary sign appeared in Investor Navigator articles, and if you had entered as the sign indicated you might have large unrealized profits, which could be unsettling.
Nevertheless, what I want to emphasize is that UNKAI is a supplement that reflects the market’s flow, not a sole predictor. Don’t rely solely on signs; combine with your own rules and use it as an indicator to confirm momentum. It will be a powerful tool if used as a supplement, without complacency.
Key point: introduce UNKAI into your own rules in a way that supports them.
That way you can visually confirm momentum directions and add more confidence to trading.
(Note) While we do not necessarily recommend using it together with the Sky Between Heaven and Sky, in post-trade reviews you can consider things like
“Was it good to target the Heaven zone here?”
“There are many signs, so be mindful of the Heaven zone.”
“There are few signs, so settle in the floating or air zones.”
Such judgments become easier.
Color-coding of zones reduces decision-making burden, which is a big advantage
For example
• Rule based on trend-followingWhen paired with UNKAI’s blue arrows (upward momentum) and red arrows (downward momentum), they serve as a “directional confirmation boost,” making it easier to avoid unnecessary counter-trend trades..
• Rules using zones or linesIf you combine, after zone reach, confirming momentum with arrows allows you to simply judge whether “this is a good moment to enter.”This is a simple decision.
• Logic prioritizing small losses, big gainswhen arrows appear in succession, trades can be made to “only ride when it expands.”
UNKAI is not meant to be used for entering and exiting exactly as signs say without any control.
Rather, relying solely on signs increases the risk of“buying at high price or selling at low price.”.
UNKAI’s role is to visually reflect the market flow.
• If more blue arrows appear on top, momentum upward is strengthening
• If more red arrows appear below, momentum downward is strengthening
This way you can intuitively feel the momentum direction
“A tool to confirm the flow” is how it’s designed.
We prepared a short video to show how these signs appear, so please take a look.
⸺
■ How the signs work
•
When the previous candle closes, momentum is determined, and arrows appear at the opening of the next candle.
• Blue arrows (up arrows):Displayed when the previous momentum was upward
• Red arrows (down arrows)Displayed when the previous momentum was downward
If the blue-arrowed candle is a bullish candle, it means “range was captured.”
If the red-arrowed candle is a bearish candle, it visualizes the result that you could have taken profit on the downside.
•
•
Sky Between Heaven and Sky Entry EA is here

Complete Entry EA manual
“Between Heaven and Sky” delegates entries to an automatic entry EA, letting the trader focus solely on monitoring after entry and executing the settlement rules.
The EA continuously monitors the chart and can enter precisely at breakout moments.This eliminates the stress of staying glued to the screen before entry and the anxiety of missing timing.
ADX, ATR, SMA and other filters are built-in.
As a bonus for purchasers, this EA is made available.
Between Heaven and Sky main page here

White clouds dyed by the light of fibers

For those who already have solid rules—UNKAI CLOUDS will further strengthen your approach.
Why publish negative results?
Investor Navigator+ intentionally publishes negative results without hiding them.
The reason is that “trading cannot always be profitable.”
Rather, by recording losses you can analyze under what conditions you lose, making the logic more robust.
Rather than focusing on each win or loss,
1 week, 1 month and beyond—what matters most is that the total result is positiveover a span.
• “I’m glad I won today”
• “I’m worried today because I lost”
To eliminate these emotional fluctuations, let the EA enter, and have humans focus on “settling according to the rules.”
“Not just to win”—this mindset is essential for building long-term profits.
Stability gained by following the rules
The common point of people who lose big in trading is thedesire to winthat leads to rule violations
Between Heaven and Sky is
•
•
Thus,human intervention is minimized, removing hesitation.
⸺
There are countless methods in technical analysis, including moving averages, RSI, MACD, Stochastic, Parabolic SAR, ADX, ATR, CCI, trendlines and channels, Fibonacci retracements and expansions, Ichimoku, volume, and support/resistance lines—these are but examples.
There is no single correct method; what matters isto decide on one’s own rule that feels right and actually test it. By doing so you gain a confidence in the market that cannot come from knowledge alone and an intuition for expected value.
⸺
We will verify using a “maximum profit” type rule in the sky-between strategy,
and even if there are many breakeven settlements, by following the rules you can calmly seize the next opportunity.
Even in scenes where you could have earned more,
by closing at break-even according to the rules you maintain overall profit. This is the strength of this strategy.
In trading, the important thing is not “win rate” but “reproducibility.”Most traders worry about win rate, buteven with a 50% win rate, if risk-reward is good, capital grows.
What matters is having a rule that yields the same result no matter who executes it.
Between Heaven and Sky is,
•EA entry → mechanical stop loss → fixed take profit
Carrying out this sequence with zero emotion emphasizes the idea of making trading a “business.”
⸺
Strategies aimed at total profit
It is dangerous to fixate on daily wins and losses.
For example, when viewed over a week or a month,even with some negative days, as long as the total is positive, that’s OK.
EA has no emotions, so it is ideal for long-term capital management as well.
By operating under a mindset of “earn” rather than “win,” the capital growth curve tends to stabilize.
If you’re interested in Between Heaven and Sky, you can join the online community
Join the online community here

Within the online community, we cannot explain concrete trading logic, but
you can participate in a “chart critique community” that uses Between Heaven and Sky.
To you who are interested in Between Heaven and Sky
Build a foundation to judge rules without hesitation in short-term trading—
that is the basic philosophy of Between Heaven and Sky.

Free materials here:
▶︎ Download “Trail to the Narrow Gap”
In “Trail to the Narrow Gap,” how exactly can you trade in which situations?
We explain these judgments more clearly.
This detail could not be fully conveyed on the sales page for “Between Heaven and Sky,”
and we also thoroughly supplement specific entry points and zone selections with diagrams and case studies.
Even first-time readers will find it easy to reproduce, so
if you’re curious, please make use of it as well.
If you’re interested, please first receive the free material “Trail to the Narrow Gap.”
From there, your first step in the Narrow Gap begins.
“Can I include this chart?”
When you hesitate,I hope this helps you switch to thinking in terms of rules rather than intuition.