

【BTCJPY】20190207 Daily Pivot
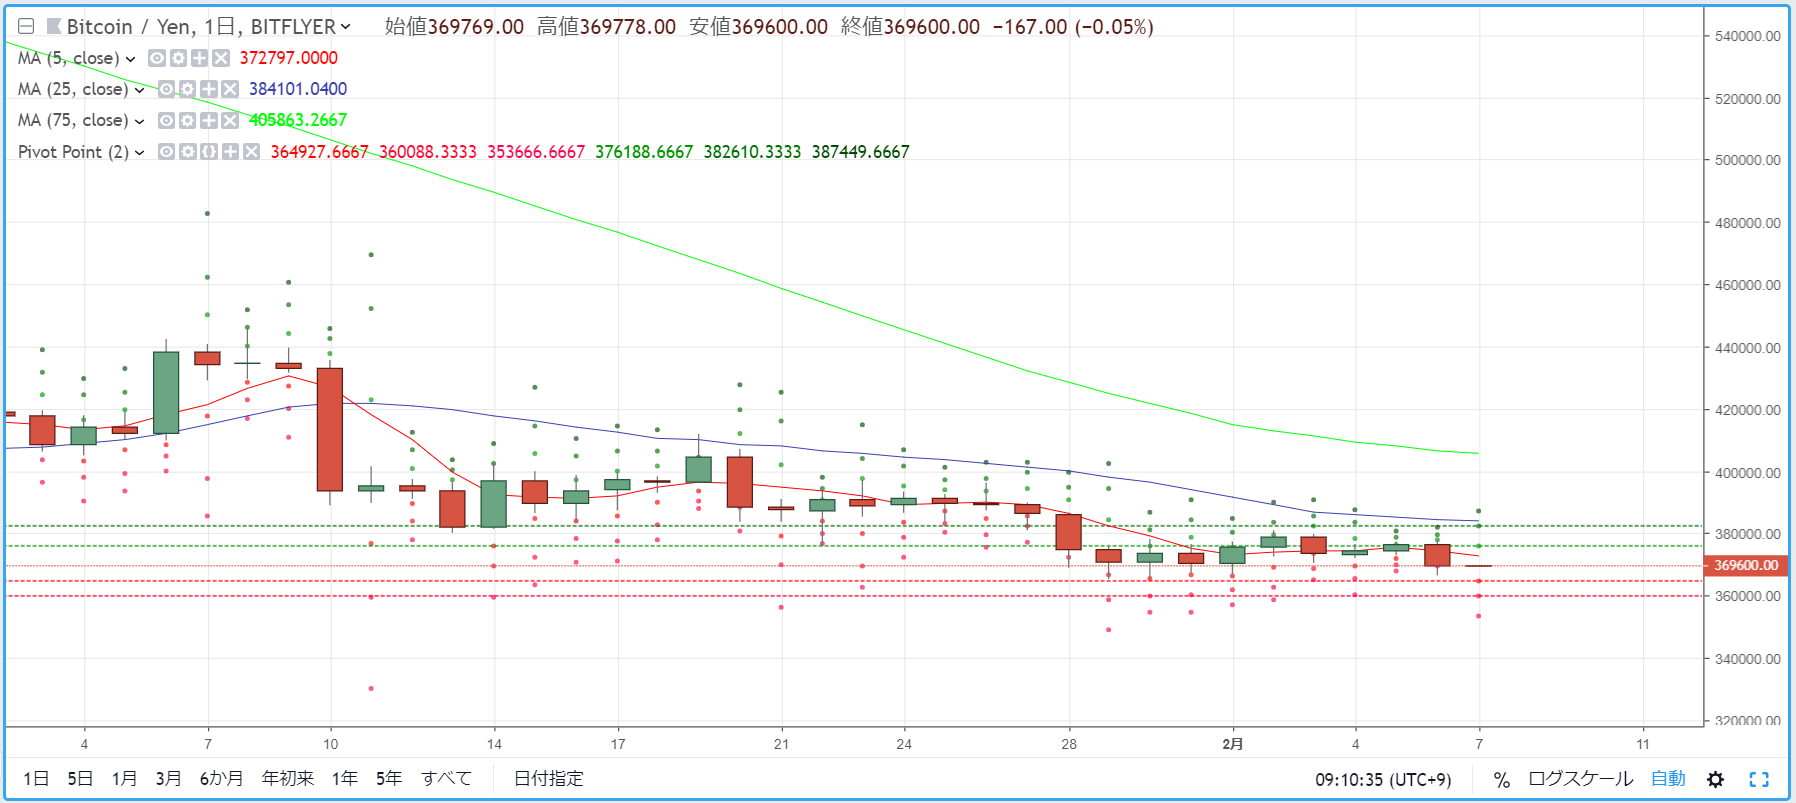
R2=382,610
R1=376,188
S1=364,927
S2=360,088
※ A pivot is a technical indicator used to forecast the price movement range for the current day based on the previous day's price action. Around the pivot point (PP), resistance lines (R1, R2) and support lines (S1, S2) are drawn, and they are used as guides for trading decisions.
【Calculation formulas】
Pivot Point (PP) = (Previous day close + previous day high + previous day low) / 3
Resistance Line 1 (R1) = PP + (PP - previous day low)
Support Line 1 (S1) = PP - (previous day high - PP)
Resistance Line 2 (R2) = PP + (previous day high - previous day low)
Support Line 2 (S2) = PP - (previous day high - previous day low)


