

【BTCJPY】20190206 Daily Pivot
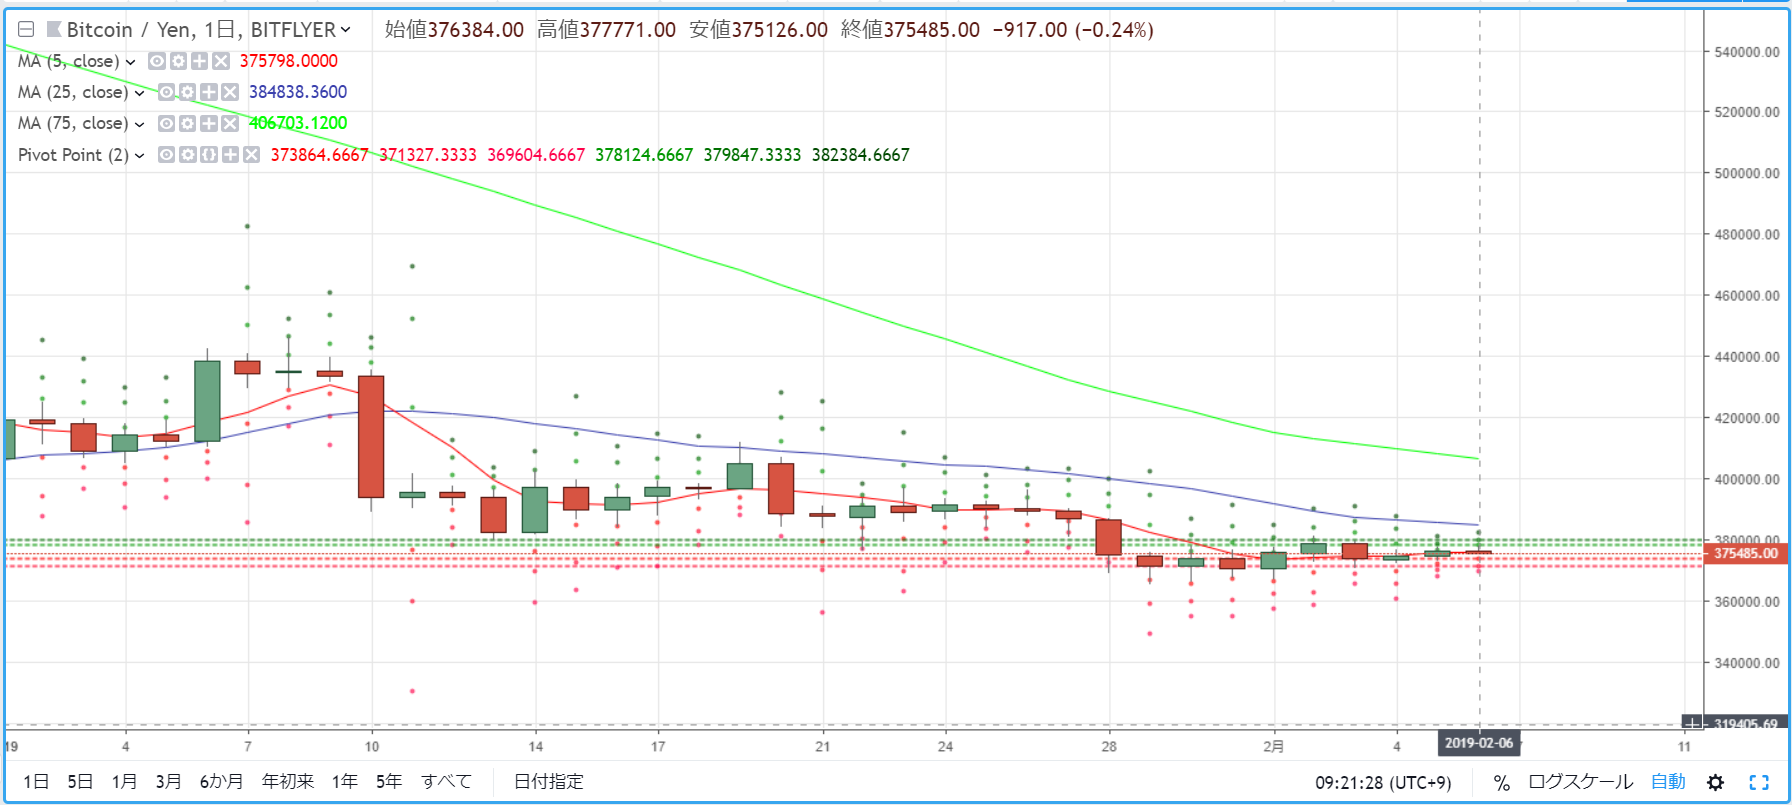
R2=379,847
R1=378,124
S1=373,864
S2=371,327
※ A pivot is a technical indicator that forecasts the price movement for the day based on the previous day's movement. Centered on the Pivot Point (PP), resistance lines (R1, R2) and support lines (S1, S2) are drawn above and below, and these are used as trading references.
[Calculation Formula]
Pivot Point (PP) = (Previous day close + previous day high + previous day low) / 3
Resistance Line 1 (R1) = PP + (PP - previous day low)
Support Line 1 (S1) = PP - (previous day high - PP)
Resistance Line 2 (R2) = PP + (previous day high - previous day low)
Support Line 2 (S2) = PP - (previous day high - previous day low)


