

【BTCJPY】20180204 Daily Pivot
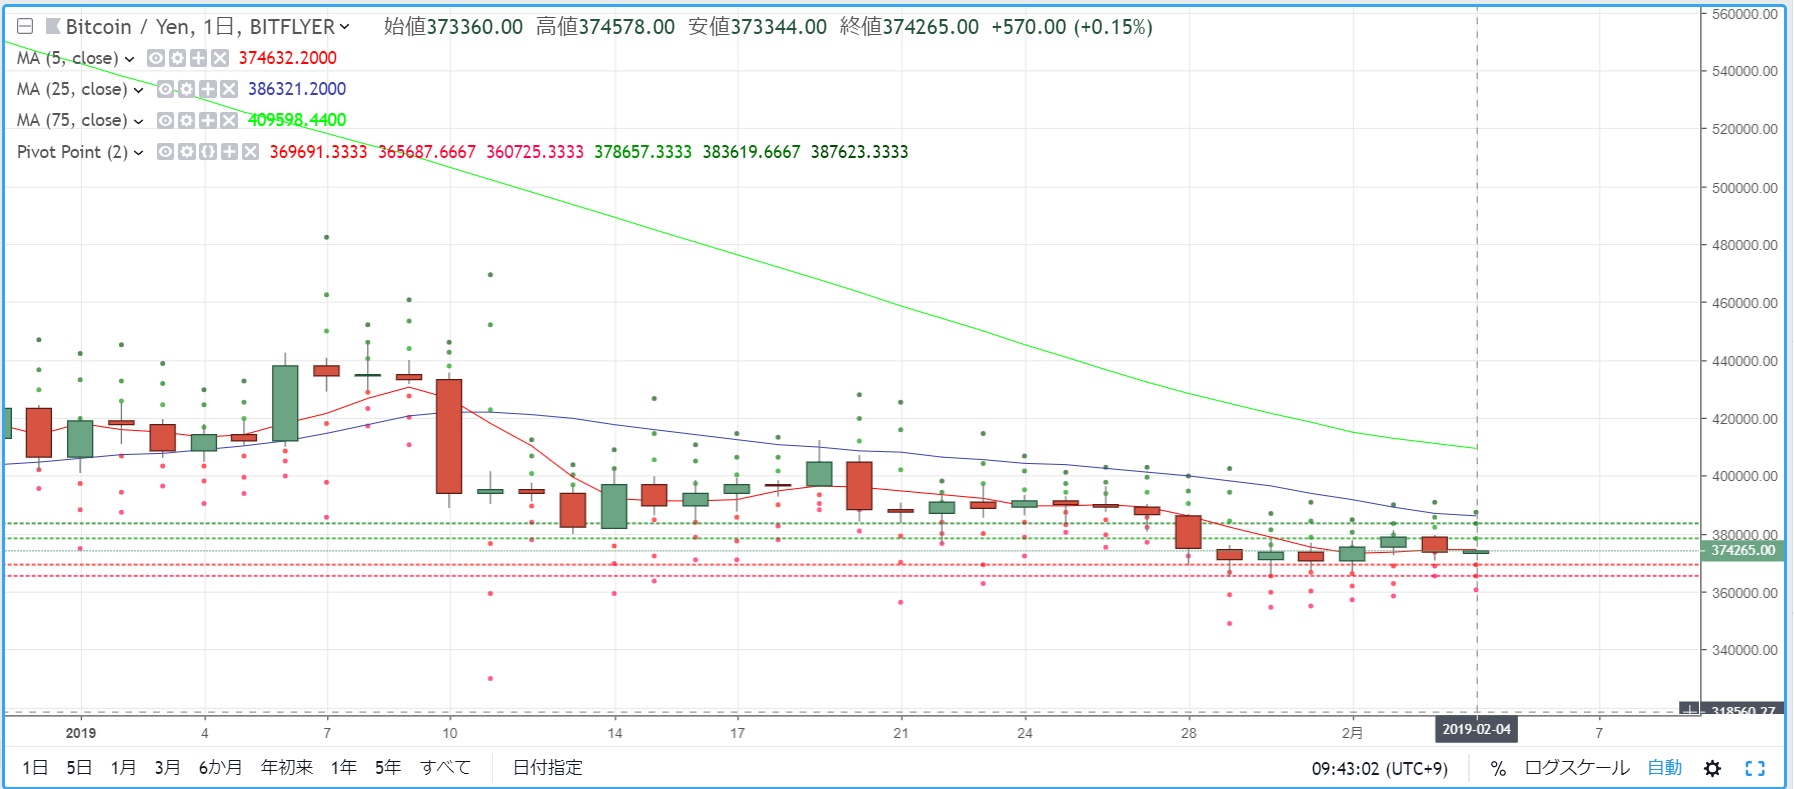
R2=383,619
R1=378,657
S1=369,691
S2=365,687
※ Pivot is a technical indicator that estimates the price movement for the day from the previous day's price action. Centered on the Pivot Point (PP), resistance lines (R1, R2) and support lines (S1, S2) are drawn above and below, and they are used as trading guidelines.
【Calculation Formula】
Pivot Point (PP) = (Previous Day's Close + Previous Day's High + Previous Day's Low) / 3
Resistance Line 1 (R1) = PP + (PP - Previous Day's Low)
Support Line 1 (S1) = PP - (Previous Day's High - PP)
Resistance Line 2 (R2) = PP + (Previous Day's High - Previous Day's Low)
Support Line 2 (S2) = PP - (Previous Day's High - Previous Day's Low)


