

?Keys_RSI×Automated trading: Easy automated trading with signal tool integration + AI judgment for evaluation!
This time, we introduce a verification video that links the free FX Keys Stone's popular signal tool "Keys_RSI" with the fully automatic trading EA "One-Click FX Arrows."One-Click FX Arrows
Since trades are executed in response to the arrows, there is no discretionary input, allowing you to confirm the signal’s performance itself. After each trade, we also present objective analyses by AI judgments.
What is keys_RSI?
keys_RSI is an original indicator for MT4/MT5, a signal tool based on RSI (Relative Strength Index). This tool is freely distributed by FX Keys Stone, detects overbought and oversold conditions of RSI, displays arrow signals on the chart, and outputs alerts (sound, email, push notifications).
✅ Main features
- Signal display: When RSI reaches specified levels, arrows pointing upward (buy signal) or downward (sell signal) appear on the chart.
- Alert function: Plays an alert when RSI threshold is reached, notifying via email or push notification.
- Integration with related tools: Easily combines with derivatives like keys_RSI3 and Stochastic RSI, and can add filters with Bollinger Bands and MA.
In this video, the arrows of this tool trigger fully automated entries and exits on MT4. We evaluate performance through actual signal accuracy and AI-based analysis results.
■ Settings and testing environment for One-Click FX Arrows
Connecting this signal to automated trading is done withOne-Click FX Arrows.
Product details=>https://www.gogojungle.co.jp/tools/indicators/64130
Testing environment settings are as follows:
- Currency pair: USDJPY
- Timeframe: 15 minutes (M15)
- Verification period: 2017-04-05 to 2017-05-12
- Model: Control Point
- Fixed spread: 0.2 pips
- Profit-taking/stop-loss: not set (no discretion)
- Trailing stop: chandelier exit
- Confirmed candle entry (because of painting)
- Reverse arrows trigger a flip (no hedging)
- Maximum number of positions: unlimited (additional entries allowed)
With these settings, automated trading is executed based solely on the entry instructions from the signal tool, without any discretionary input.
Initial Setup
Launch Strategy Tester and select One-Click FX Arrows. In Expert settings,One-Click FX Arrowsparameters and the signal tool integration parameters are configured.
Since this is a buffer-type signal tool, you set the indicator name and index number. Next, set the period, currency pair, and model, and start testing in visual mode.
Starting Auto-Trading
As the chart moves, the keys-RSI indicator appears and arrows show up in response to signals. First, we verify that entries are executed correctly in step with the signals.
Usually, arrows appear when the bottom RSI chart exceeds 60 or falls below 40. Arrows appear in the same direction consecutively, and many arrows may appear. Since the maximum position is unlimited, additional entries occur frequently.
Therefore, when a trend forms, we keep buying, so we set a chandelier exit with trailing stop.
When arrows appear, entries are automatically executed, and when a reverse-arrow appears, we exit and immediately re-enter in the opposite direction (no hedging).
Having confirmed the automated trading operates correctly, we disable automatic stop and proceed with live trading.
At the bottom of the screen, a real-time profit and loss graph is displayed, so you can see the trading status at a glance even if playback speed is increased.
Because we used more than a month of historical data, the video advances the playback speed. Actual trading processing completed in about 7 minutes.
End of Period and Summary
Three weeks of trading have finished. A CSV file for AI judgment and a folder of output images automatically open. Also, One-Click FX Arrows automatically compiles statistics such as total profit/loss, win rate, and profit factor on the screen.
AI Judgment Analysis Results
Let's review those AI analysis results.
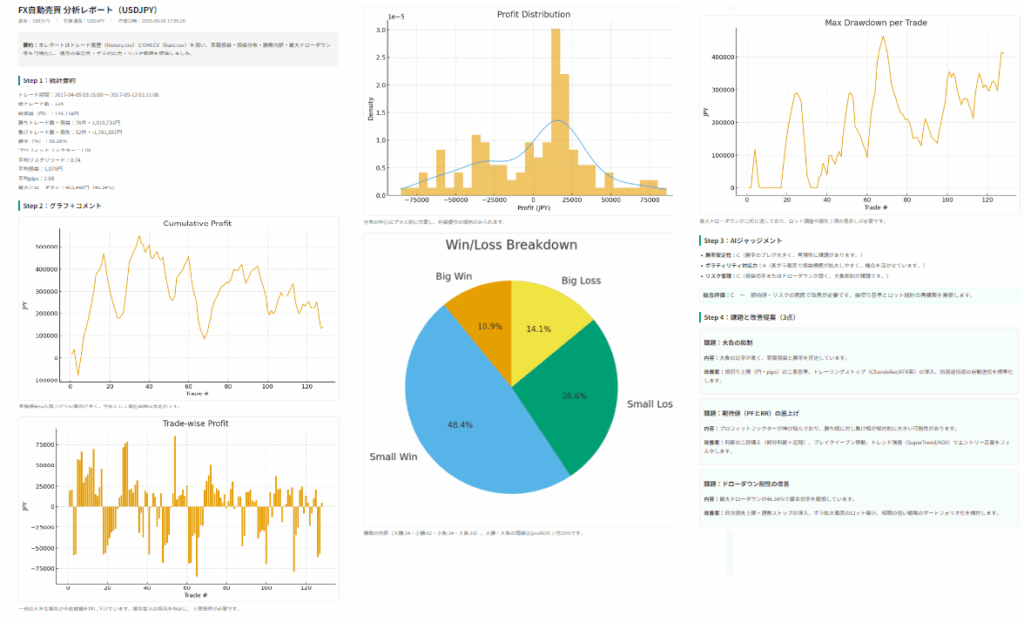
Step 1: Summary Statistics
Total trades: 128
Total profit/loss (yen): 138,174 yen
Winning trades/profit: 76 trades, 1,919,731 yen
Losing trades/loss: 52 trades, -1,781,557 yen
Win rate (%): 59.38%
Profit factor: 1.08
Average risk-reward: 0.74
Average profit/loss: 1,079 yen
Average pips: 2.08
Maximum drawdown: 463,448 yen (46.34%)
Step 2: Graphs and Comments
Cumulative Profit
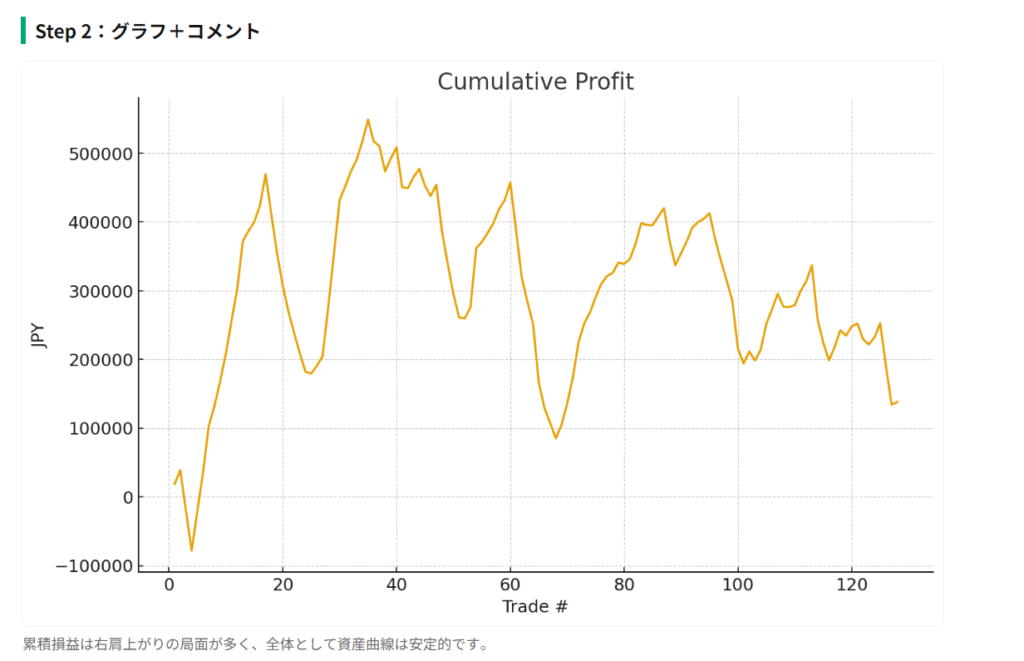
Cumulative profit mainly shows an upward trend, and the overall asset curve is steady.
Trade-wise Profit
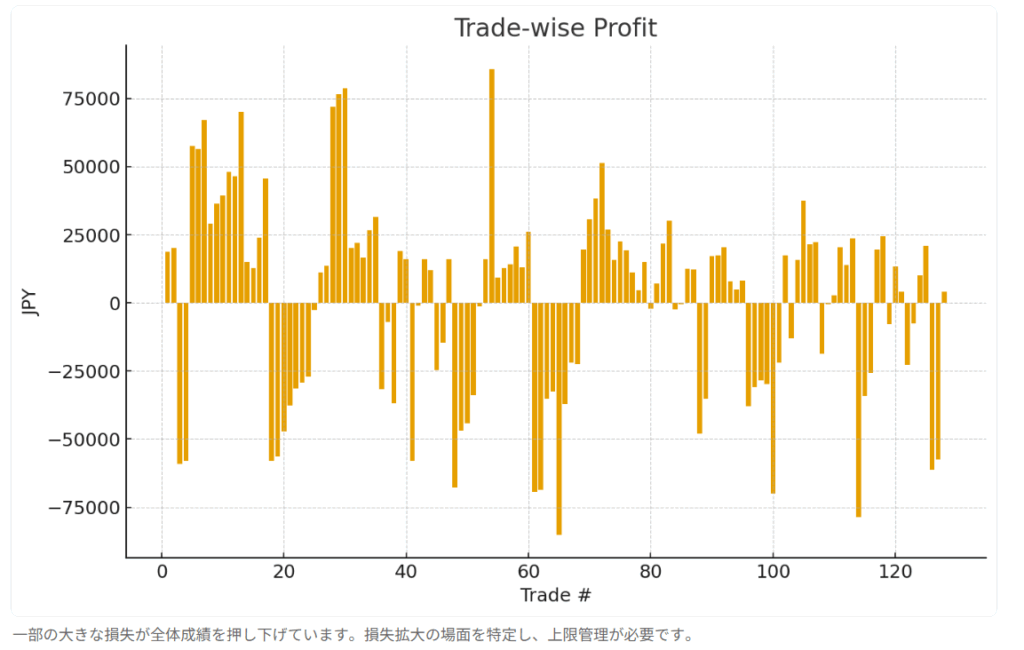
A few large losses drag down overall performance. Identify times of loss expansion and implement upper limit management.
Profit Distribution
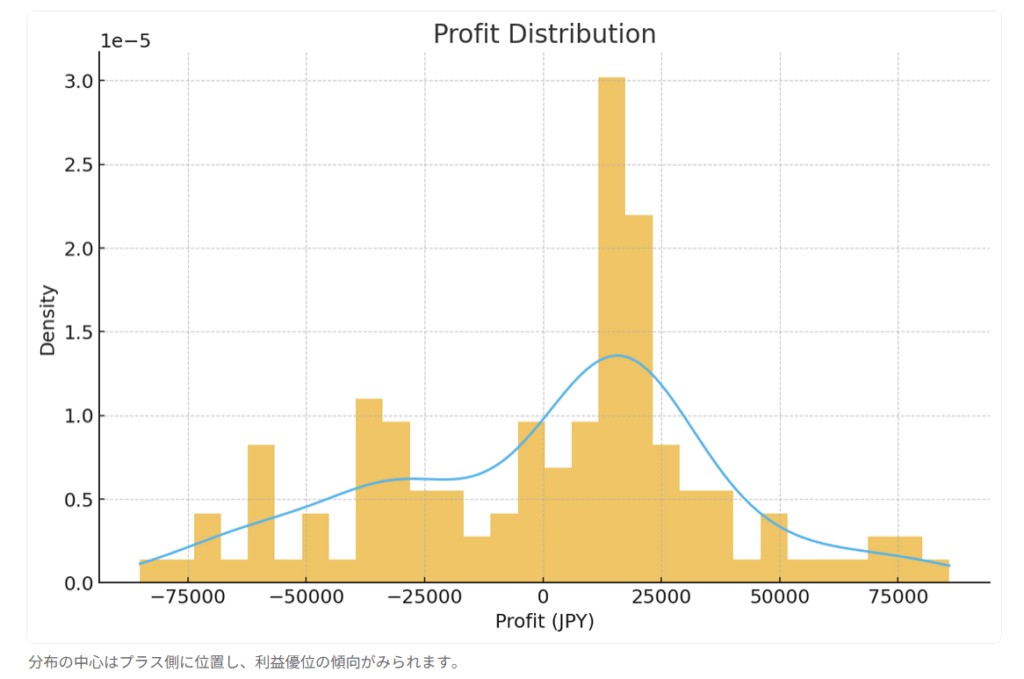
The distribution centers on the profit side, showing a tendency toward profitability.
Win/Loss Breakdown
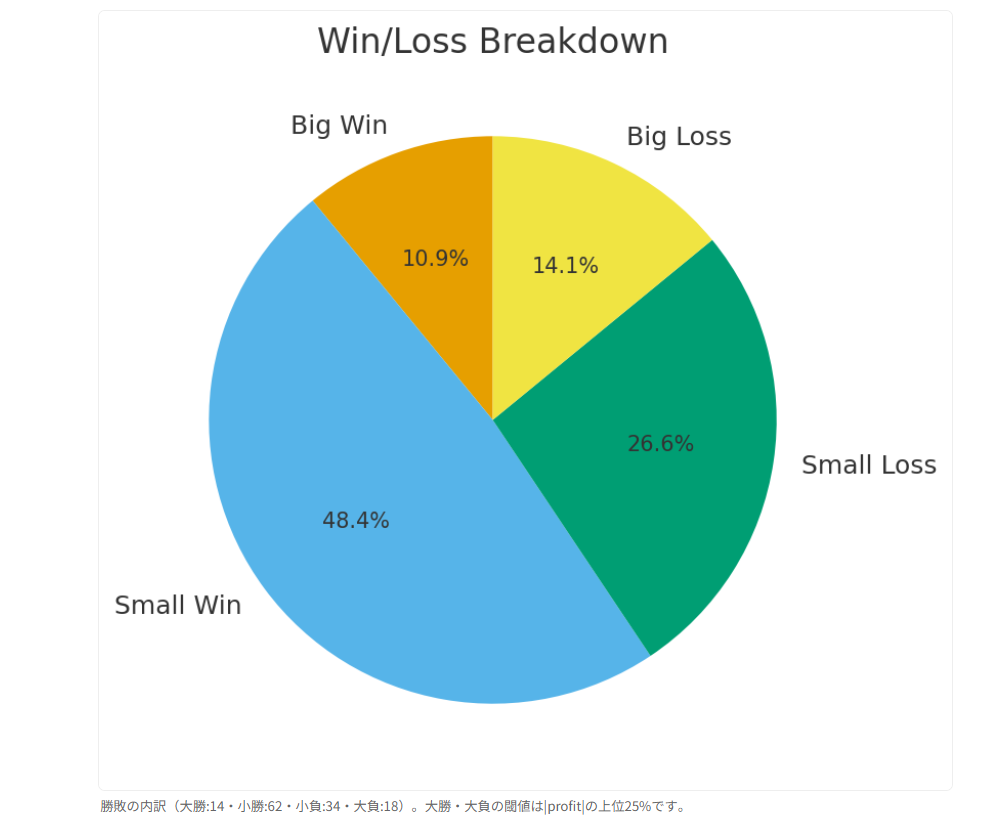
Win/Loss breakdown (large win: 14, small win: 62, small loss: 34, large loss: 18). Thresholds for large wins/large losses are the top 25% of |profit|.
Max Drawdown per Trade
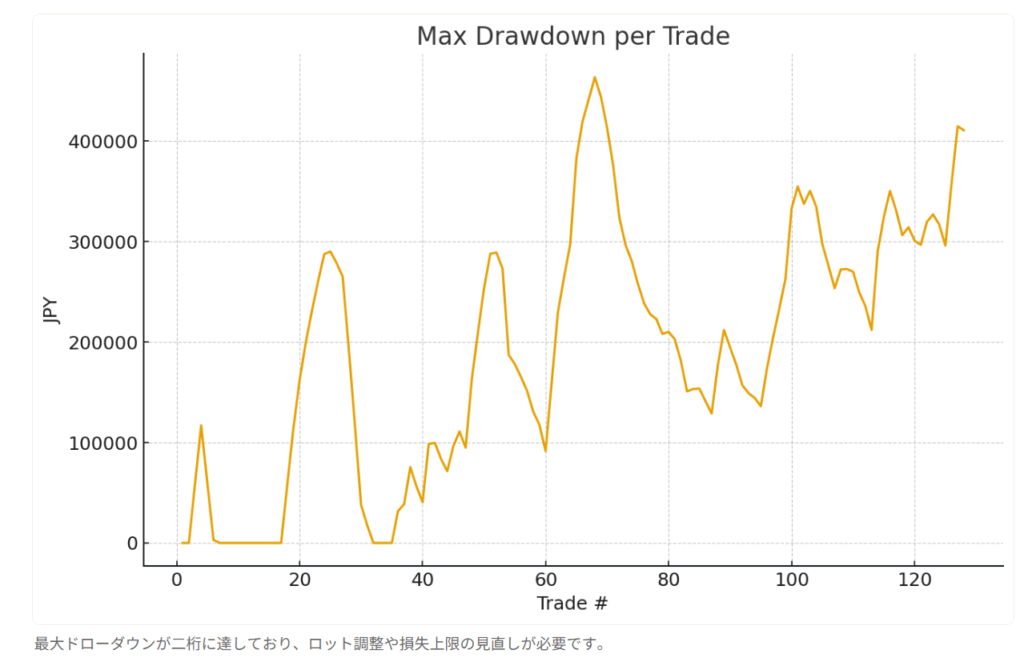
The maximum drawdown has reached double digits, indicating a need to adjust lot sizes or reconsider loss limits. (The drawdown chart may be inaccurate due to continued additional entries; see note.)
Step 3: AI Judgment
Stability of win rate:C (significant fluctuation in win rate and reproducibility challenges.
Volatility handling capability:A (in high-volatility periods, profit/loss scale tends to expand, opportunities are utilized effectively.)
Risk management:C (profitability or drawdown is weak; large loss suppression is a challenge.)
Overall evaluation:C; both expected value and risk require improvement. Rebuild stop-loss criteria and lot sizing.
Step 4: Issues and Improvement Proposals
Issue: Suppression of large losses
Content:The proportion of large losses is high, which pressures cumulative profit/loss and win rate.
Improvement proposal:Standardize dual criteria for stop-loss (yen/pips), introduce trailing stops (Chandelier/ATR-based), and automate sending limit orders and stop orders.
Issue: Raising expected value (PF and RR)
Content:Profit factor is stalling, and the loss side may be relatively large compared to wins.
Improvement proposal:Two-stage take profit (partial take profit + trail), move to breakeven, and filter entry quality with trend strength (SuperTrend/ADX).
Issue: Improving drawdown resilience
Content:Maximum drawdown is 46.34%, harming capital efficiency.
Improvement proposal:Introduce daily loss limits and run-stop for string losses, reduce lot sizes in volatile periods, and consider portfolioing strategies with low correlations.
Note that this result is just one example.
Results can vary greatly depending on market conditions, signal settings, and period, so view this as a reference.
Practice and verify freely with a completely risk-free trading simulator!
One-Click FX Training MAX detailed page