
USD/JPY as expected. Short-term rise target (target based on assumed rate) (points & figures)
0
30-minute chart 0.05 yen range P&F chart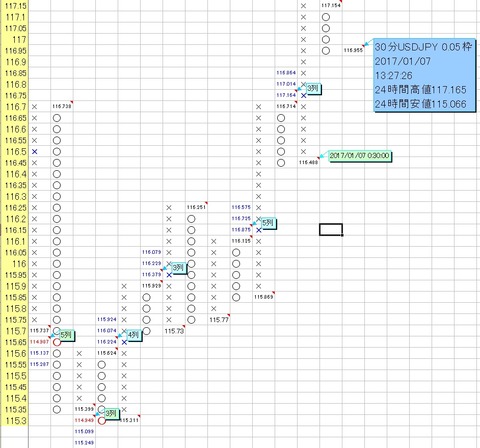
1-hour chart 0.1 yen range P&F chart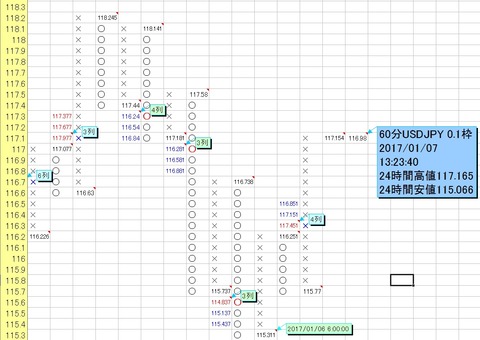
30-minute chart 0.05 yen range P&F chart (assumed rate)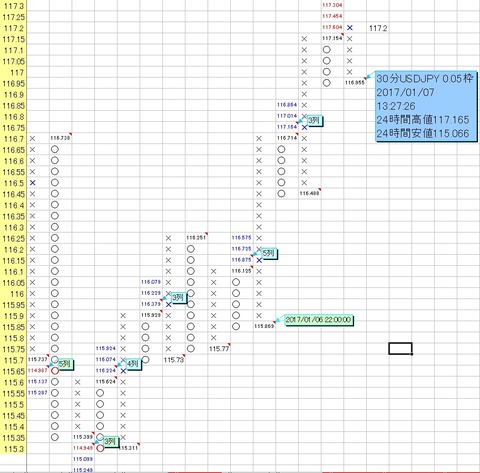
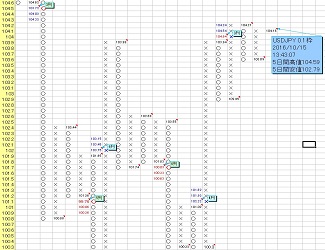
USD/JPY on January 6thUSD/JPY consecutive decline signal, near-term downside target predicted “around 114.837 to 115.137 yen as the near-term downside target”; it fell to 115.066 yen but then reversed and rose.
As shown above, in the 30-minute chart with 0.05 yen range points & Figures, a continuous upward signal was generated and, after reaching the maximum target of 117.164 yen, a small pullback occurred.
In the 1-hour chart with 0.1 yen range P&F chart, an upward signal also occurred, and targets other than 117.451 yen have already been reached.
Also, from the 30-minute chart with 0.05 yen range P&F, if it reaches above 117.2 yen an additional upward signal will occur, and if it falls below around 116.4 yen a downward signal will occur.
Here, assuming it rises above 117.2 yen,
Using the function, calculating the projected up target for the 30-minute chart with 0.05 yen range P&F, as shown above, yields a target of 117.304 yen to 117.604 yen.
From the above, as long as it does not clearly fall below around 116.4 yen, the near-term upside target is expected to be around 117.304 yen to 117.604 yen.
We have improved the “Market Forecast Tool”
Introduction and usage of the “Market Forecast Tool”
We have improved the “Market Forecast Tool”
Introduction and usage of the “Market Forecast Tool”
× ![]()