
Product outline
Community(0)

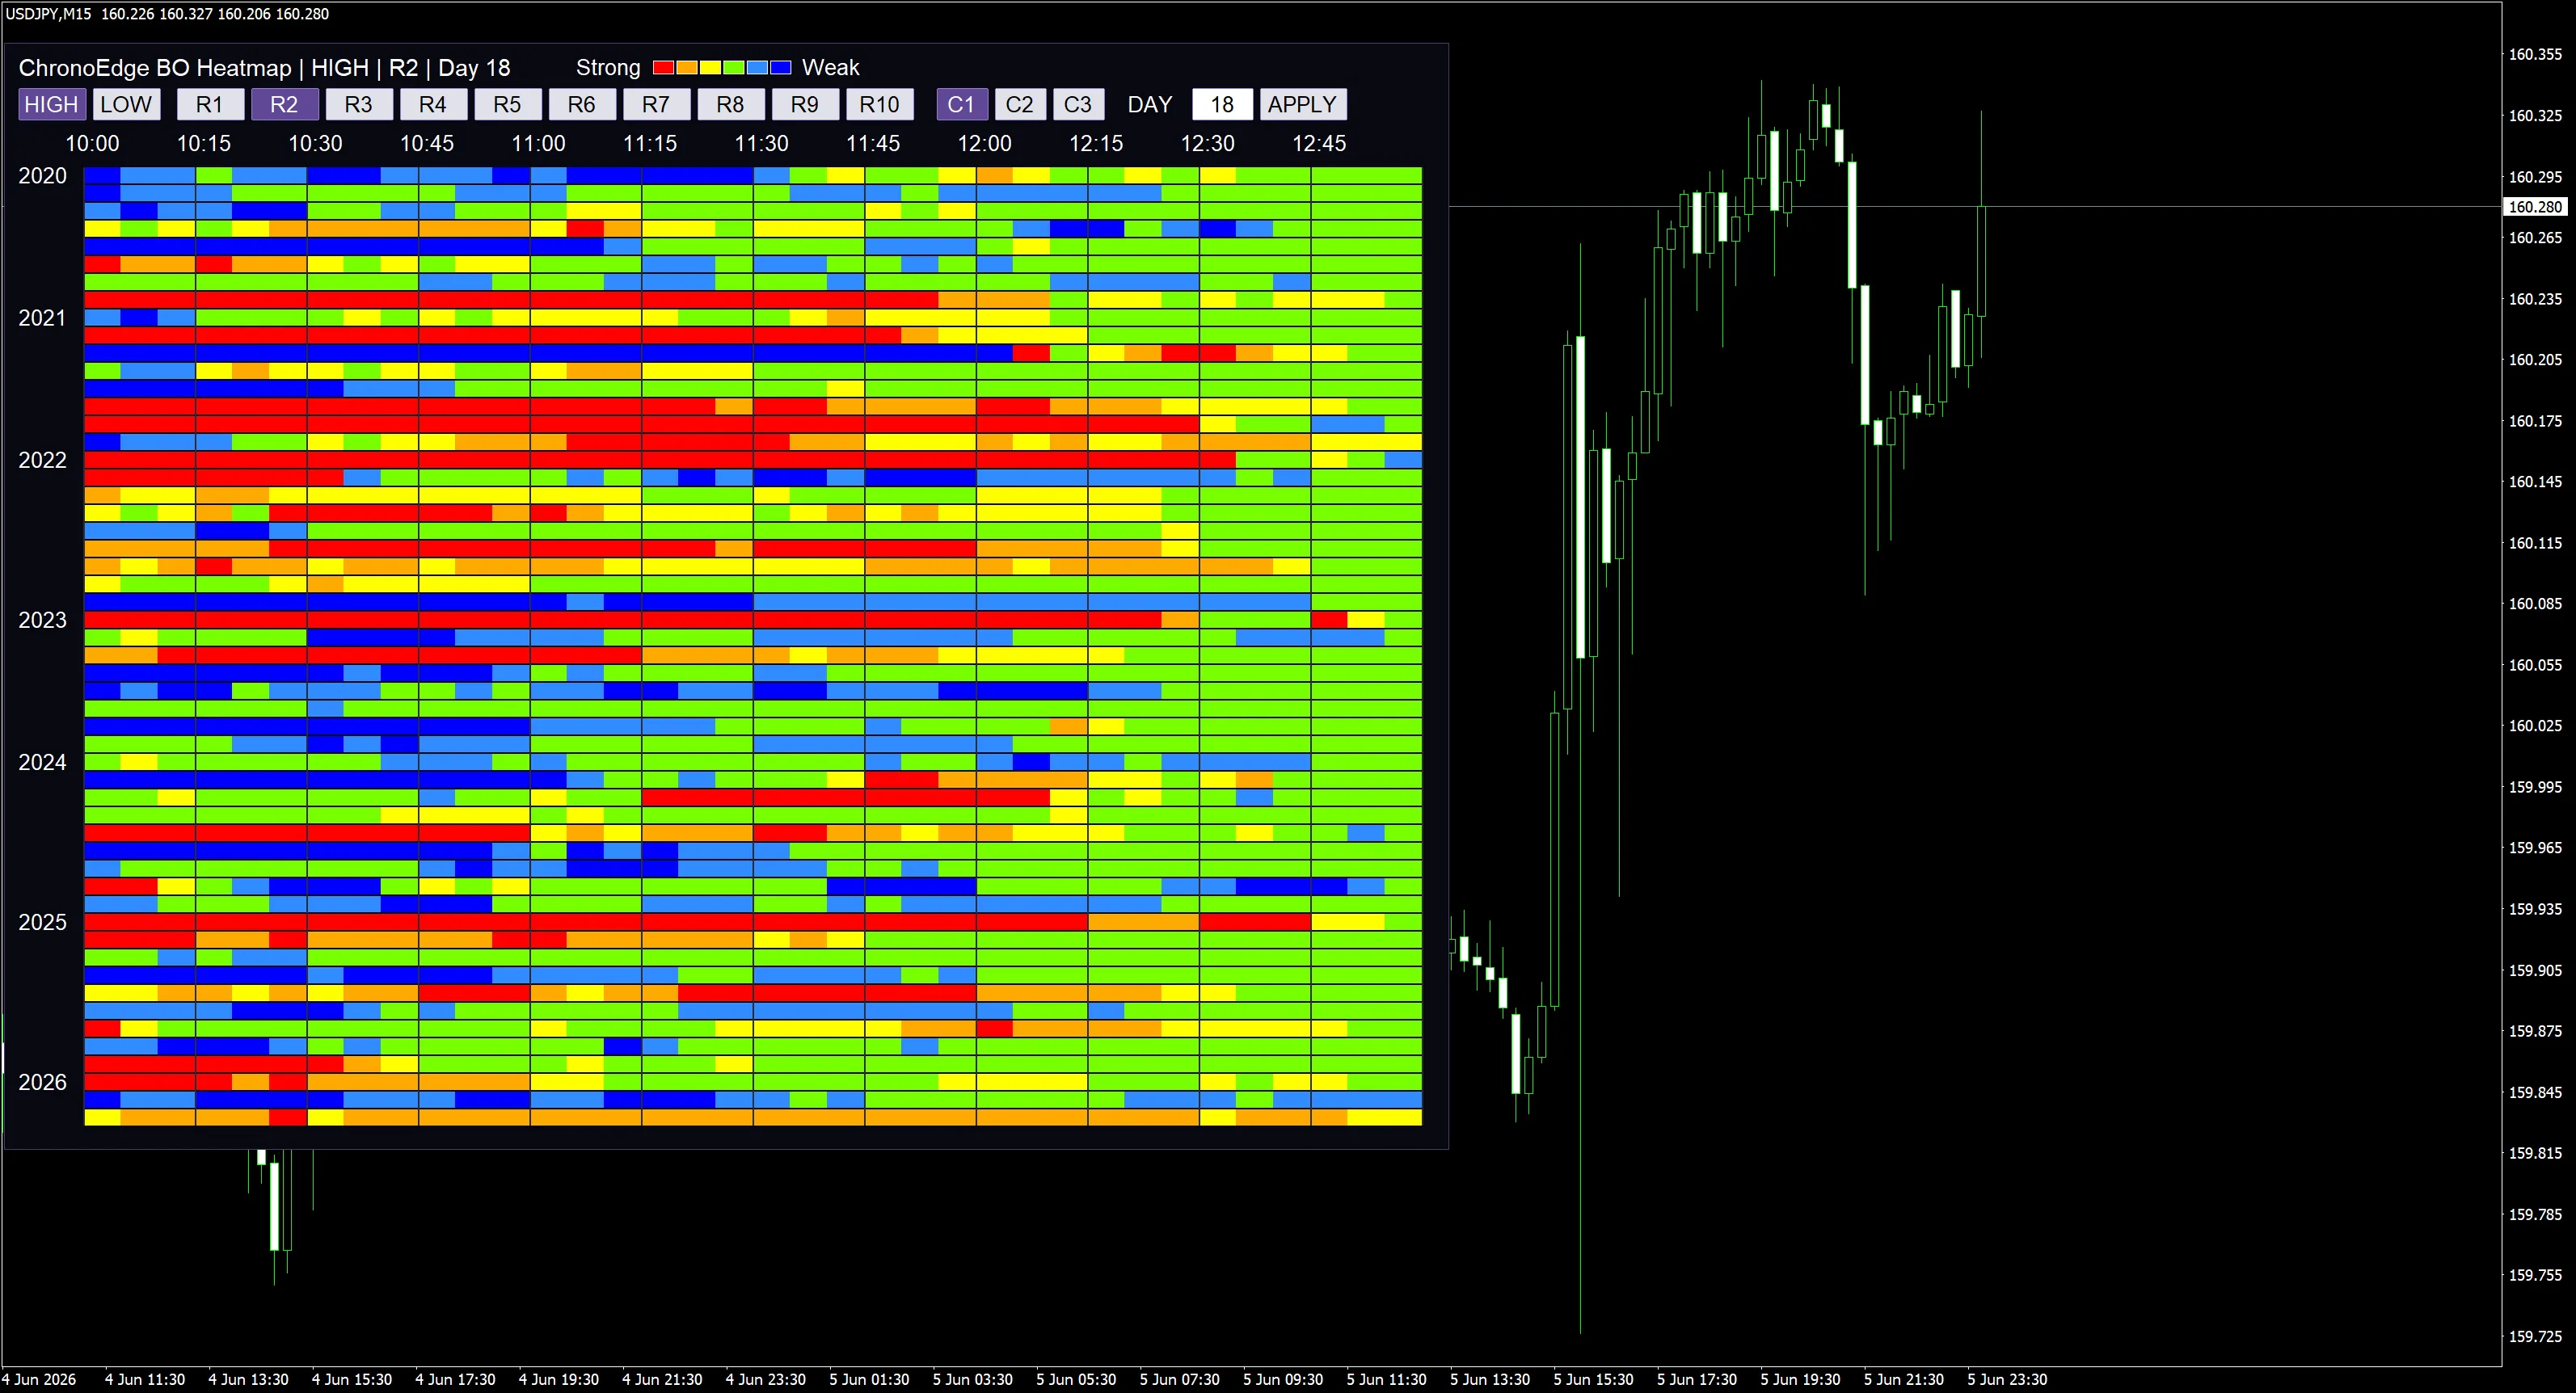
ChronoEdge BO ヒートマップ
判定時間から逆算してHIGH / LOWの偏りを色で見る
Reviews:
Category:
How to provide:
Indicator
Sales from:
06/09/2026
Last Updated:
06/09/2026
Version:
1.00
Web Authentication:
Enable
Available company:


¥19,800(taxed)
Provider/Distributor:
Sales site:
GogoJungle
●Payment


Product outline
Community(0)
Best Seller Ranking
Recommended Products (Campaigns)
For those using GogoJungle for the first timeEasy 3 steps to use the product!
At GogoJungle, we provide services to enrich your investment life for our members. In addition, product purchases are limited to members. Why not register as a member now and make use of GogoJungle!
01
Enter user information and register as a member
02
Follow the instructions to make a purchase
03
Download from My Page