
商品概要
コミュニティ(0)

AutoTrendLine【TradeStation】
自動でトレンドラインを描画します


概要
直近の高値・安値を算出し、自動で上昇トレンドライン・下降トレンドラインを描画します。
イメージ
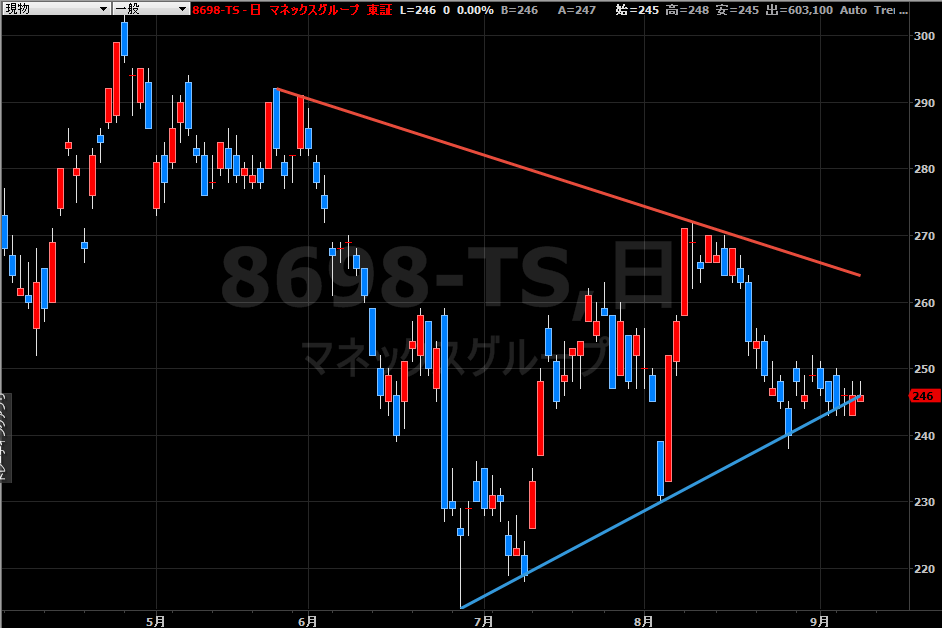
上の画像では青いラインが上昇トレンドライン、赤いラインが下降トレンドラインです。
チャートの変化に応じて常に直近の上昇・下降トレンドライン各1本ずつが描画されます。
パラメータ
パラメータ名
内容
期間
高値安値を判定する期間を入力します。
Period の値を大きくするほど長い期間でのトレンドラインを計算します。
Period の値を大きくするほど長い期間でのトレンドラインを計算します。
ラインの太さ
表示するトレンドラインの太さを設定します。
太さは0~6の7段階で設定できます。
数字が大きいほど太くなります。
太さは0~6の7段階で設定できます。
数字が大きいほど太くなります。
上昇トレンドラインカラー
上昇トレンドラインの色を指定します。
下降トレンドラインカラー
下降トレンドラインの色を指定します。
無料
すでに 213 人が利用中!
提供元 / 販売元:
販売サイト:
GogoJungle
●お支払い方法


商品概要
コミュニティ(0)
人気商品ランキング
おすすめ商品(キャンペーン商品)
GogoJungleを初めてご利用する方へ 商品のご利用まではかんたん3ステップ!
GogoJungleでは、会員様向けに、あなたの投資生活を豊かにするサービスをご用意しております。また、商品をご購入いただけるのは、会員様のみとなっております。今すぐ会員登録をして、GogoJungleを活用してみませんか!
01
ユーザー情報を入力し会員登録
02
案内に従い購入
03
マイページからダウンロード