
商品概要
コミュニティ(0)
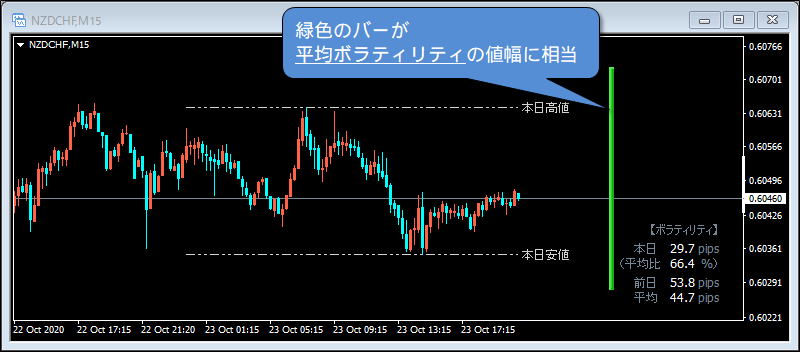
平均ボラティリティの値幅を示すバーをチャート上に表示
【zz_VolatilityBar MT4版Ver1.04 / MT5版Ver1.03】平均ボラティリティの値幅を示すバーをチャート上に表示。MT4版/MT5版の2種類同梱。

無料
すでに 4,899 人が利用中!
提供元 / 販売元:
販売サイト:
GogoJungle

機能概要
トレード前に、あらかじめ1日で動く値幅の目安が分かればちょっと安心しませんか?
このインジケーターは「1日で大体このくらいの範囲で動いてますよ」ということをバーで
視覚的に表示します。
1日の値幅の限界付近が近づいてるのに、さらに伸びることを期待して高値掴み/安値掴みをしてしまったり、
まだ動く余地がたっぷり残ってるのに早まったエントリー/利確をしてしまったりと、
「ちょっと待った!」をかける判断材料にもなるかと思います。
値幅の算出方法として、過去20日間の値幅(1日ごとの高値と安値の差)の単純な平均値、または
前日のATR値のいずれかを選択できます。
実際の画面
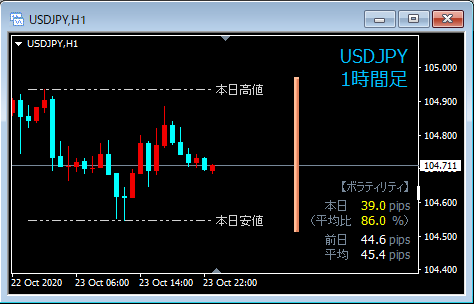
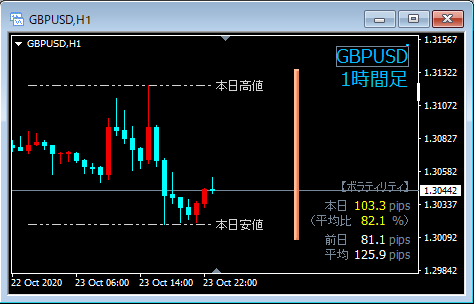
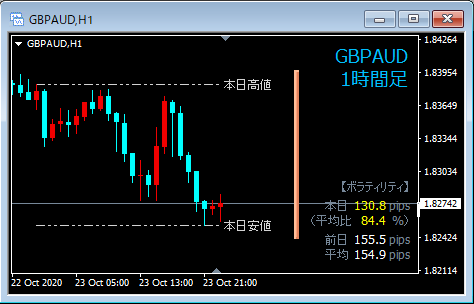
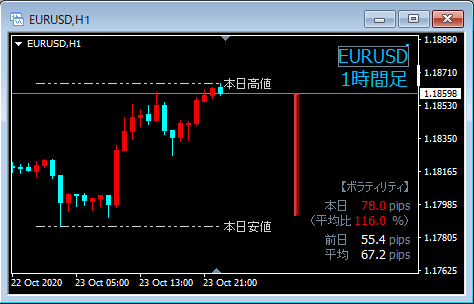
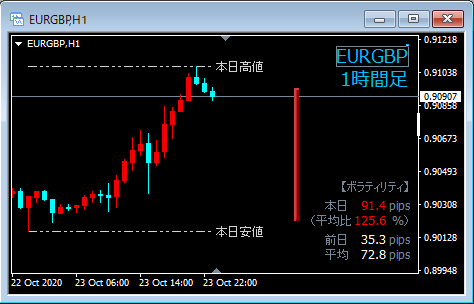
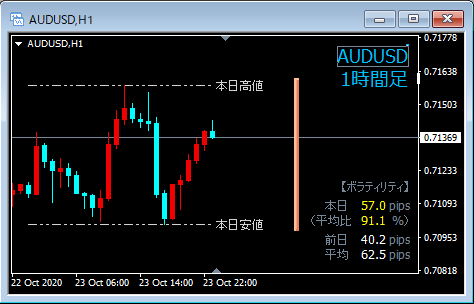
2020年10月23日(金)日足確定後の画面をいくつかピックアップしたものです。
どの通貨ペアも当日のボラティリティが平均ボラティリティの値幅前後に収まっていることにご注目下さい。
(あくまで平均値との比較になるため、常に下画像のように上手く収まるとは限らないのでご注意下さい。)

画面構成
各部説明
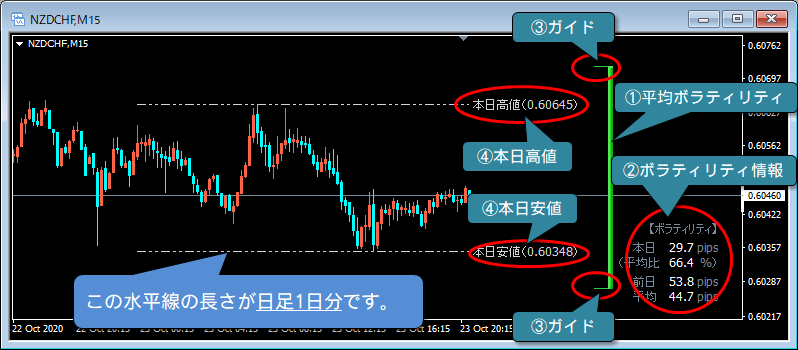 ①平均ボラティリティ
平均ボラティリティの値幅をバー状に表示します。
平均ボラティリティは、過去n日間(初期状態で20日間。当日は含まない)の日足高安差の平均値です。
平均ボラティリティに対して本日のボラティリティが何%かによって、バーの色が変わります(後述)。
②ボラティリティ情報
・本日:本日のボラティリティ(高値ー安値)。
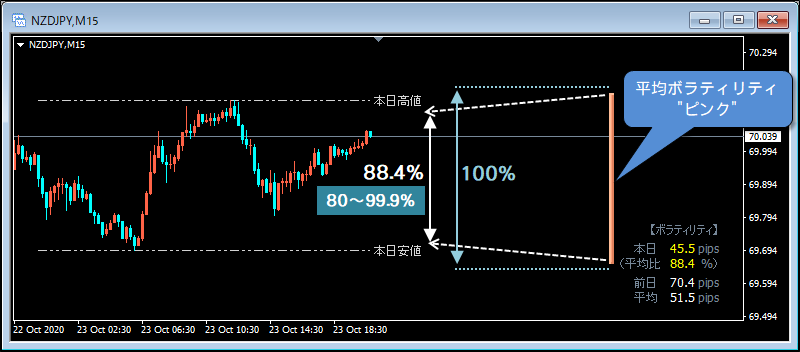
平均ボラティリティに対して、80%未満の時は白色、80%~100%未満の時は黄色、
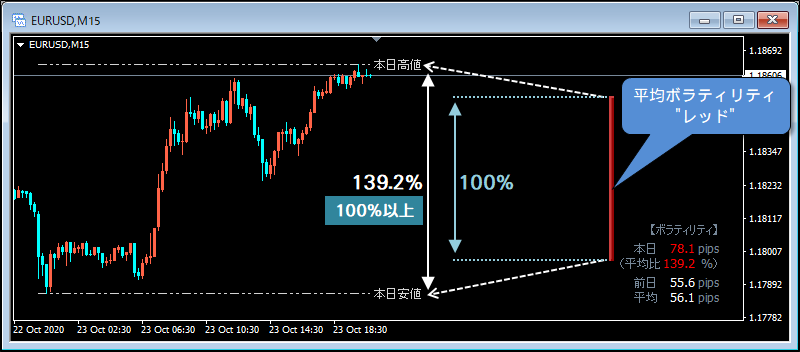
100%以上になると赤色で表示されます(色は設定で変更可能)。
・平均比:平均ボラティリティに対して、本日のボラティリティが何%に相当するかを示す。
・前日:前日のボラティリティ(高値ー安値)。
・平均:平均ボラティリティ。バーの値幅はこの値が使用されます。
※平均ボラティリティのバーをクリックすると、表示/非表示が切り替わります(初期設定時)。
③ガイド
バーの上下にガイド線を表示して、平均ボラティリティの範囲を視覚的に分かりやすくします。
表示/非表示の設定ができます(初期設定時は非表示)。
④本日高値/本日安値
本日の高値/安値の価格に水平線を引きます。設定により、価格値を表示することも可能です。
※平均ボラティリティのバーをクリックすると、表示/非表示が切り替わります(初期設定時)。
①平均ボラティリティ
平均ボラティリティの値幅をバー状に表示します。
平均ボラティリティは、過去n日間(初期状態で20日間。当日は含まない)の日足高安差の平均値です。
平均ボラティリティに対して本日のボラティリティが何%かによって、バーの色が変わります(後述)。
②ボラティリティ情報
・本日:本日のボラティリティ(高値ー安値)。
平均ボラティリティに対して、80%未満の時は白色、80%~100%未満の時は黄色、
100%以上になると赤色で表示されます(色は設定で変更可能)。
・平均比:平均ボラティリティに対して、本日のボラティリティが何%に相当するかを示す。
・前日:前日のボラティリティ(高値ー安値)。
・平均:平均ボラティリティ。バーの値幅はこの値が使用されます。
※平均ボラティリティのバーをクリックすると、表示/非表示が切り替わります(初期設定時)。
③ガイド
バーの上下にガイド線を表示して、平均ボラティリティの範囲を視覚的に分かりやすくします。
表示/非表示の設定ができます(初期設定時は非表示)。
④本日高値/本日安値
本日の高値/安値の価格に水平線を引きます。設定により、価格値を表示することも可能です。
※平均ボラティリティのバーをクリックすると、表示/非表示が切り替わります(初期設定時)。
バーの色について
平均ボラティリティに対する本日ボラティリティの割合によって、バーの色は変化します (色は設定で変更可能) 本日のボラティリティが平均ボラティリティの80%未満の時「グリーン」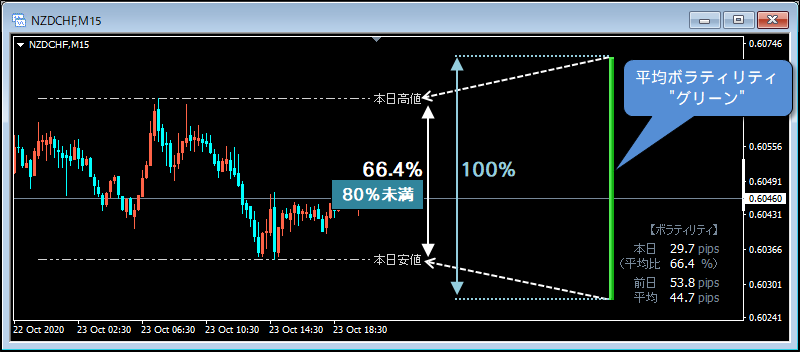 本日のボラティリティが平均ボラティリティの80%以上の時「ピンク」
 本日のボラティリティが平均ボラティリティの100%以上の時「レッド」
主な使い方
このインジケータの醍醐味を味わうには、まずバー全体を画面内に表示して値幅感を掴みます。
※別売りのインジケーター「zz_MT4plus」を併用すれば、[Fit]ボタン一発で画面内に表示できます。
1.バー全体が画面に収まるようチャートを調整する
1.チャートを右クリックしてプロパティを表示し、[全般]タブの[スケールの固定]にチェックを入れて [OK]ボタンをクリックします。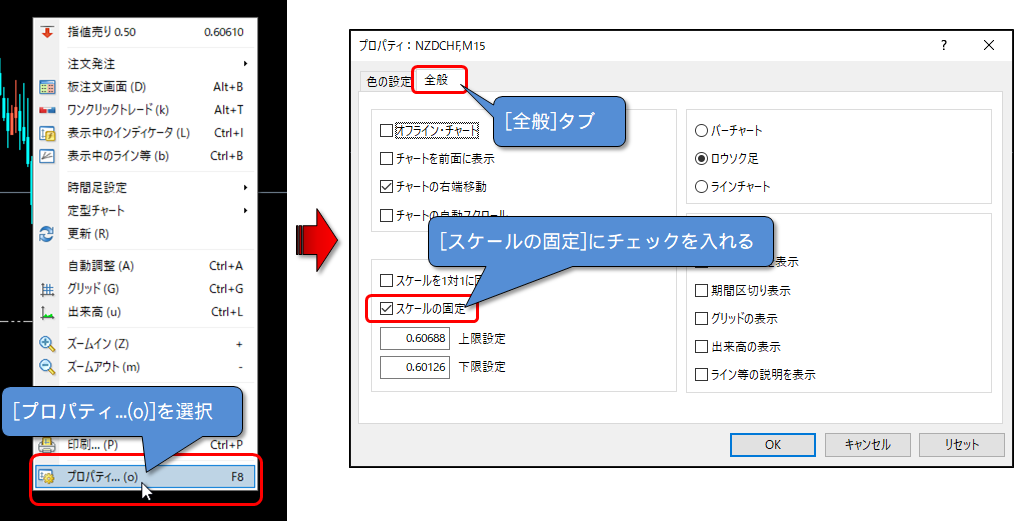 2.チャート右端の目盛りをマウスで上下にドラッグして、バーの端っこが画面内に入るようチャートの縦サイズを
調整します。
2.チャート右端の目盛りをマウスで上下にドラッグして、バーの端っこが画面内に入るようチャートの縦サイズを
調整します。
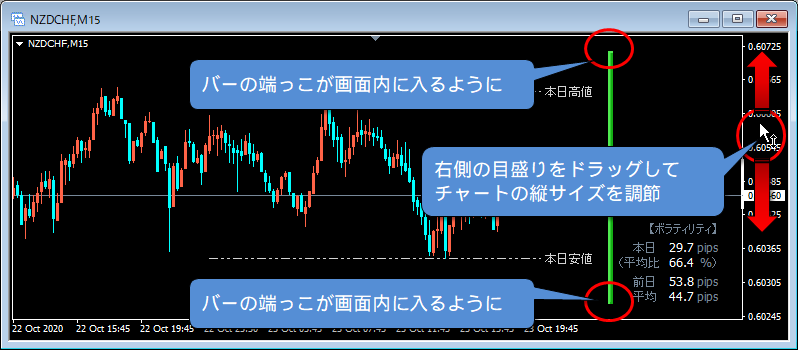 うまく画面に収まったでしょうか?
そのバーの高さが1日の値幅の平均値です!!
うまく画面に収まったでしょうか?
そのバーの高さが1日の値幅の平均値です!!
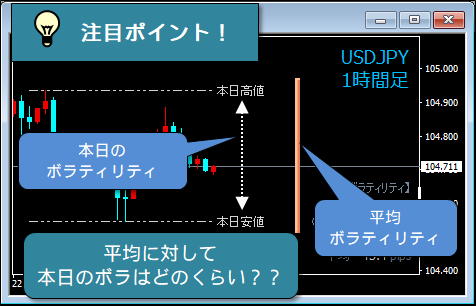
2.平均ボラティリティを意識したトレード
本日の高値安値の値幅と平均ボラティリティの値幅を比較しながらトレードを行います。 大きなイベントや暴れるような地合いでなければ、だいたい平均ボラティリティ前後の範囲で 1日の値動きが収まるケースが多いかと思われます。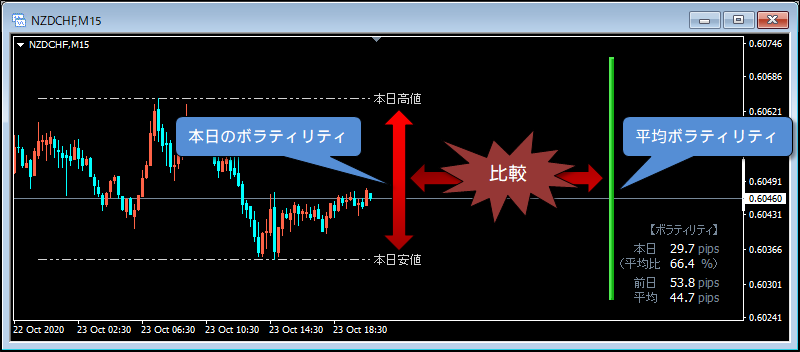 ■本日のボラティリティが平均に到達するまでまだ余裕がある場合
本日中にまだ動く可能性がある・・・と考えることができます。
例えばNY時間まで平均の50%程度の値幅しかなくても、ロンドンフィックスで一気に差を詰めてくることもあります。
■本日のボラティリティが平均に近い、あるいは超えてしまった場合
この辺が今日の値幅の限界ではないのか?
手仕舞うか、あるいは新規のポジションは見送った方が良いのではないか?
・・・などと考えることができます。
あまりに強い勢いで平均値を越えていくと、そのまま吹っ飛んで行く可能性もあるので、
ケースバイケースでご判断下さい。
■本日のボラティリティが平均に到達したので、反転を期待して逆張りする
判断材料の中の1つとして平均ボラティリティを使うのはアリですが、これ1つだけでは根拠が弱いので、
各種レジサポラインなど、その他の条件も加味してご判断下さい。
■本日のボラティリティが平均に到達するまでまだ余裕がある場合
本日中にまだ動く可能性がある・・・と考えることができます。
例えばNY時間まで平均の50%程度の値幅しかなくても、ロンドンフィックスで一気に差を詰めてくることもあります。
■本日のボラティリティが平均に近い、あるいは超えてしまった場合
この辺が今日の値幅の限界ではないのか?
手仕舞うか、あるいは新規のポジションは見送った方が良いのではないか?
・・・などと考えることができます。
あまりに強い勢いで平均値を越えていくと、そのまま吹っ飛んで行く可能性もあるので、
ケースバイケースでご判断下さい。
■本日のボラティリティが平均に到達したので、反転を期待して逆張りする
判断材料の中の1つとして平均ボラティリティを使うのはアリですが、これ1つだけでは根拠が弱いので、
各種レジサポラインなど、その他の条件も加味してご判断下さい。
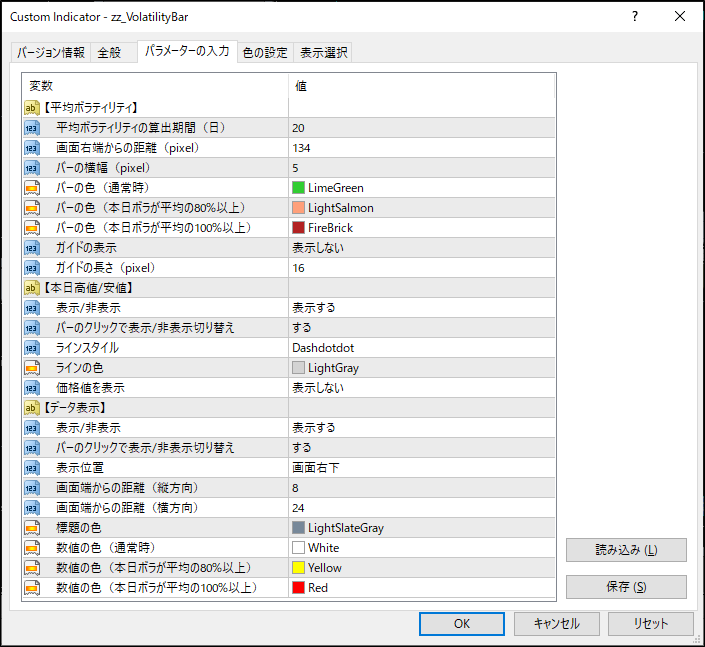
設定パラメーター
無料
すでに 4,899 人が利用中!
提供元 / 販売元:
販売サイト:
GogoJungle
商品概要
コミュニティ(0)
人気商品ランキング
おすすめ商品(キャンペーン商品)
GogoJungleを初めてご利用する方へ 商品のご利用まではかんたん3ステップ!
GogoJungleでは、会員様向けに、あなたの投資生活を豊かにするサービスをご用意しております。また、商品をご購入いただけるのは、会員様のみとなっております。今すぐ会員登録をして、GogoJungleを活用してみませんか!
01
ユーザー情報を入力し会員登録
02
案内に従い購入
03
マイページからダウンロード