

Utilization of the "Visualization Indicator" (Part 216)
“Visualization indicators” usage (Part216)”
1. Further evolve the “28 Currency Pairs List Indicator” into an indicator“8CPVisualization Indicator”to drawEURAUD.
There are versions of the “8 CP Visualization Indicator” for Oceania, London, New York, and AnyCP. This time, the Oceania version was used.
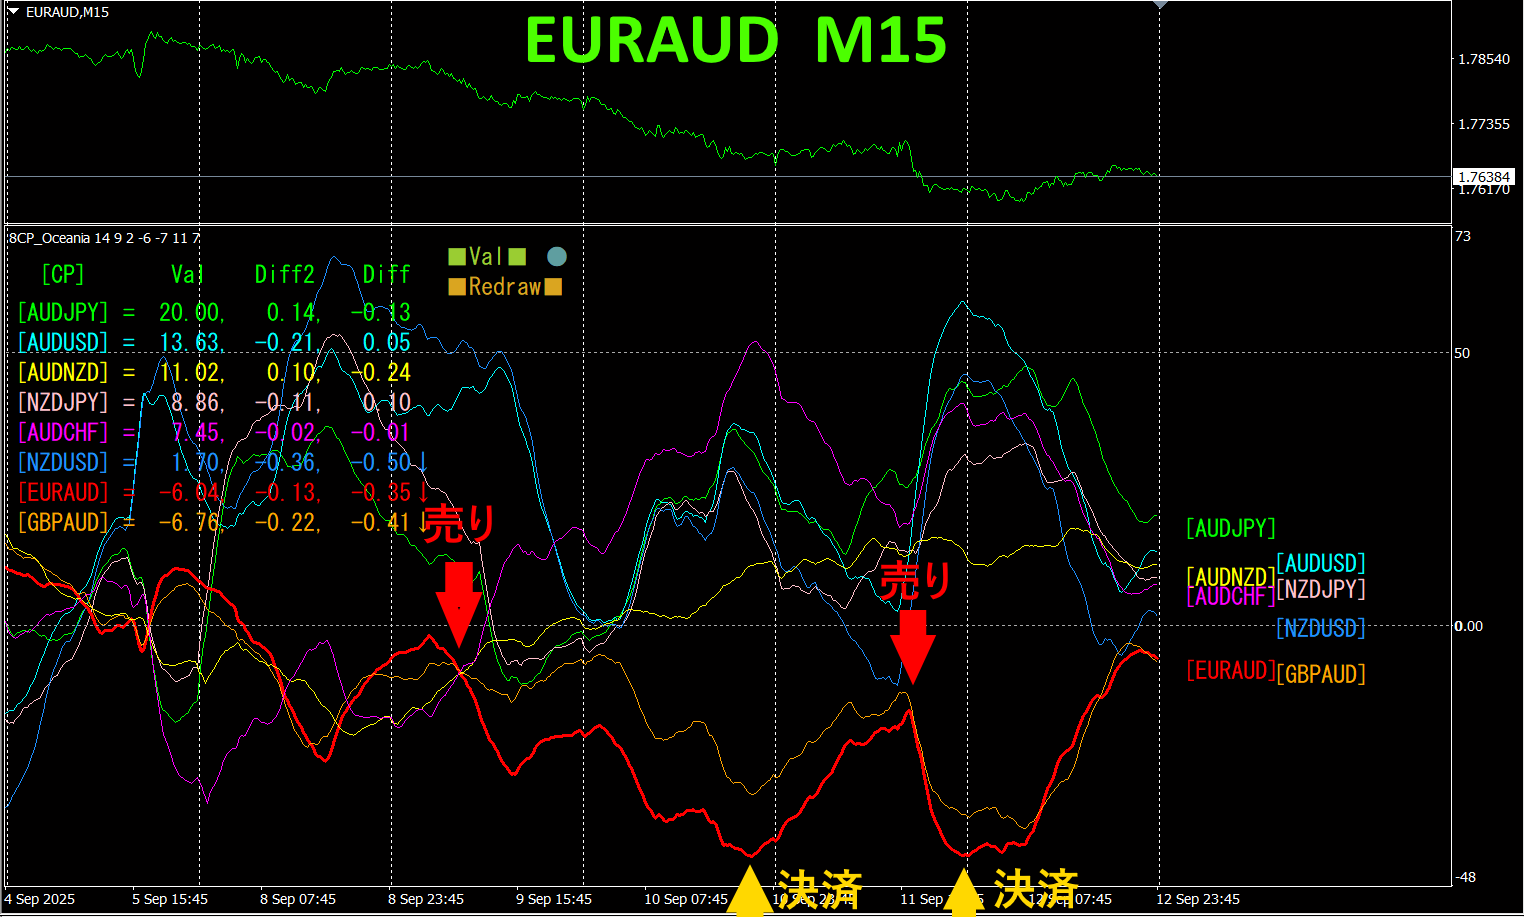
The upper half is the EURAUD 15-minute chart. The lower half is from the “8 CP Visualization Indicator,” where the red thick line graph corresponds to EURAUD.
On Tuesday and Thursday, the EURAUD graph fell below other graphs, so we will trade with two short positions. We will close at the bottom for a total of 230 pips profit: 140 pips + 90 pips.
Currency Strength/Weakness Graph
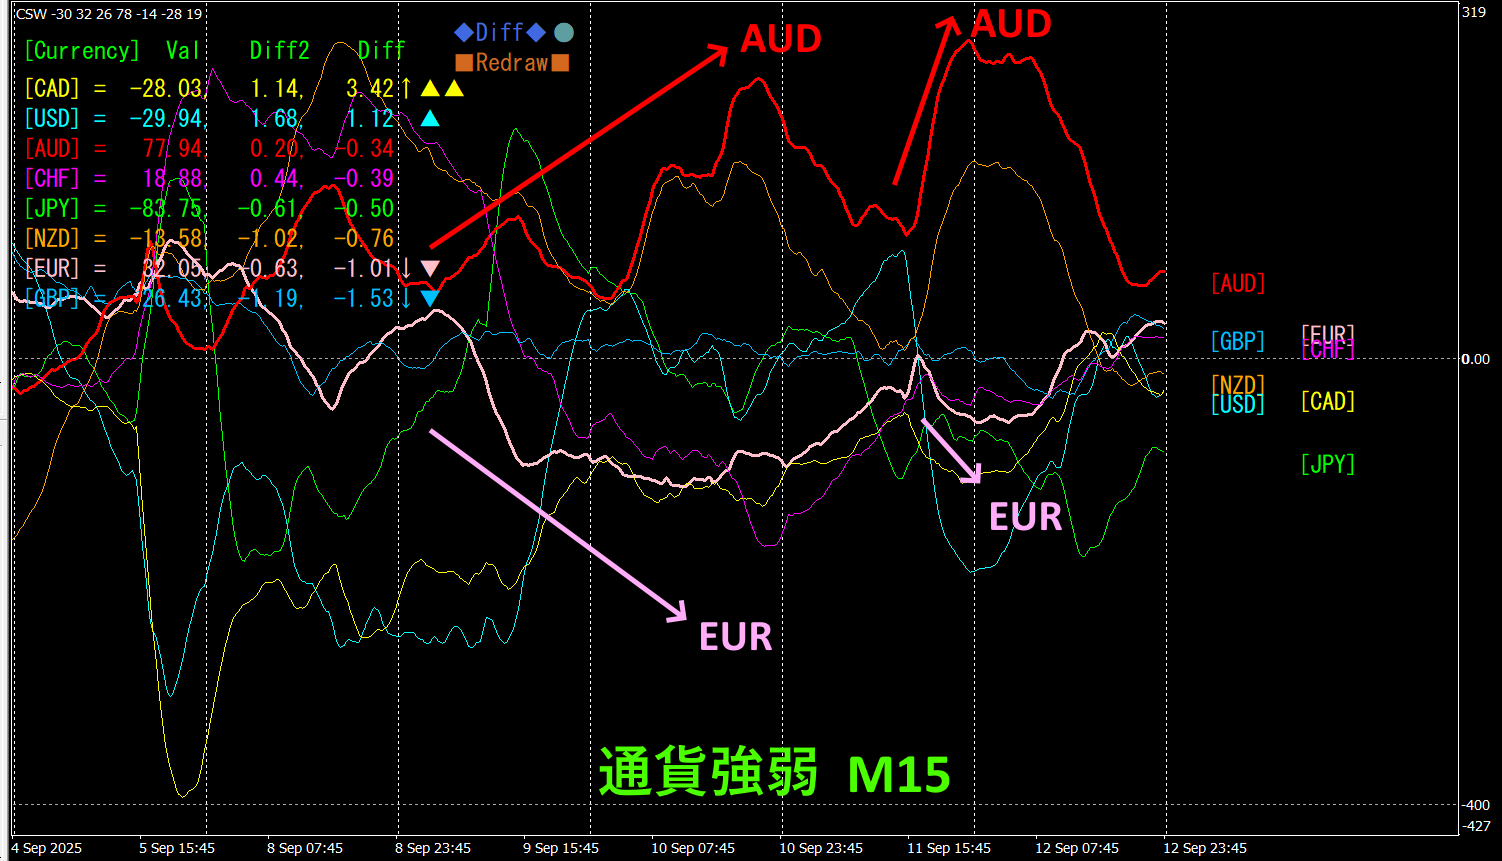
Looking at the 15-minute currency strength graph, AUD and EUR show a strong inverse relationship.AUDEUR
By selecting the most strongly trending and inversely correlated currency pair, you can naturally achieve results.
“Target the Currency Strength Inverse Correlation!”is a rule of FX.
If you use the “TrendLine-EX,” you can automate entry and exit by breaking diagonal trendlines. You can leave it as is, enabling easy trading. The “TrendLine-EX” is a semi-automatic EA that sells automatically on trendline breaks and closes automatically on trendline rebounds.
2. Best SelectIndicator try
The figure below is a screenshot fromSeptember12,2025, 01:21 (JST).
[Total]Values are sorted in descending order. The top asset,AUDUSD, displays blue on all timeframes.Total value is3547.21, indicating a large positive number and suggesting a strong uptrend in AUDUSD. shows a strong upward trend.
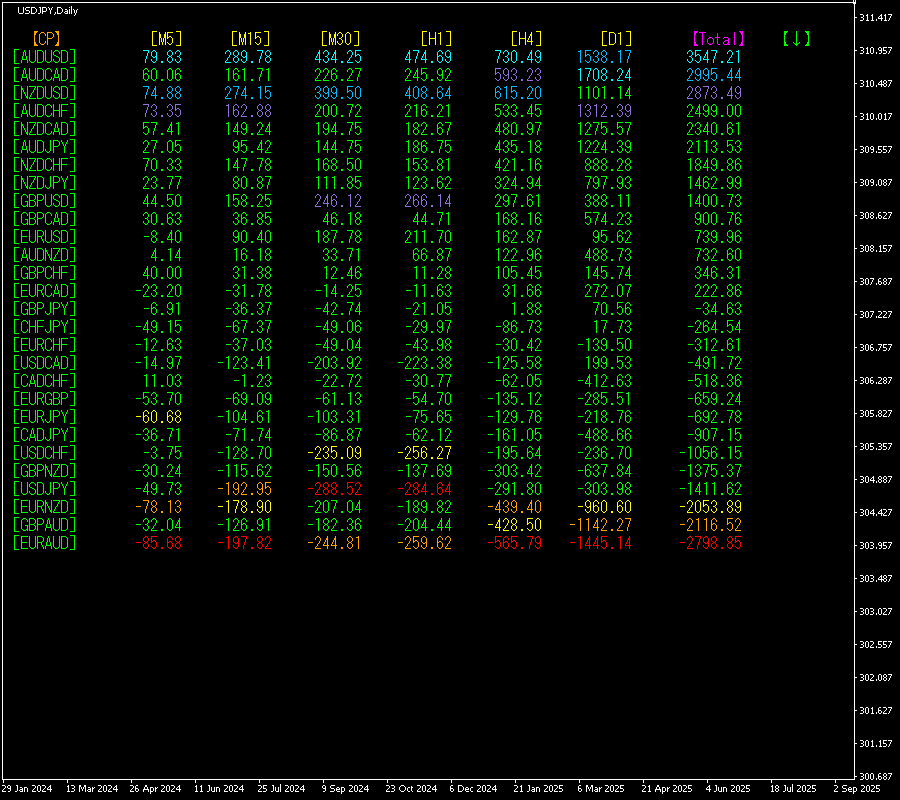
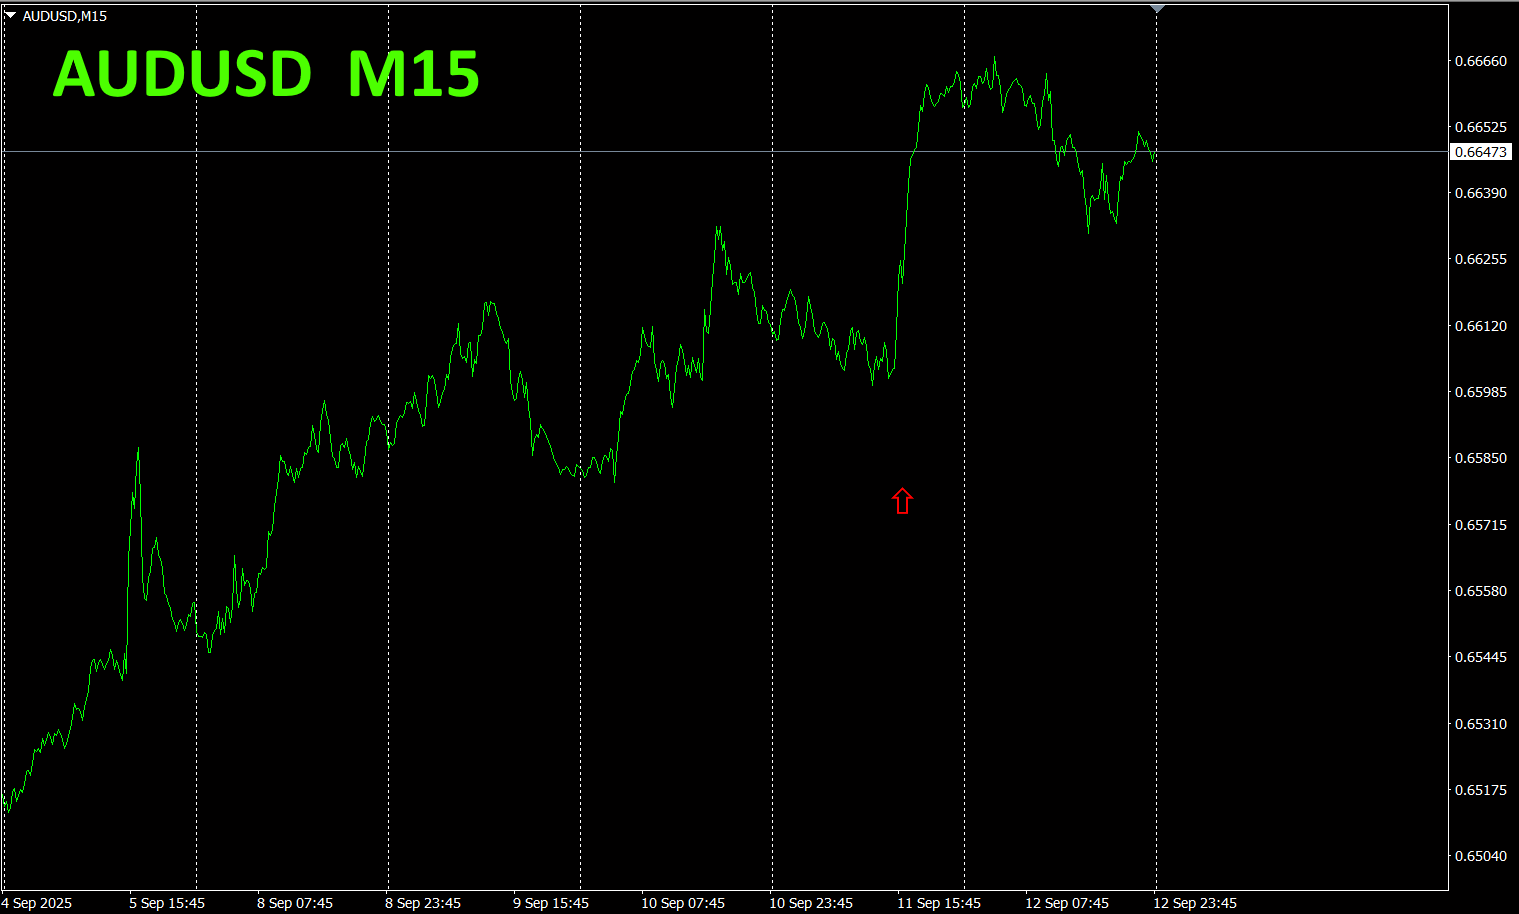
Next, look at the AUDUSD chart.
The red arrows indicate where the screenshot was taken, capturing a sharp rise.
“28 currency pairsBest Select
“28 currency pairsBest Select Indicator”

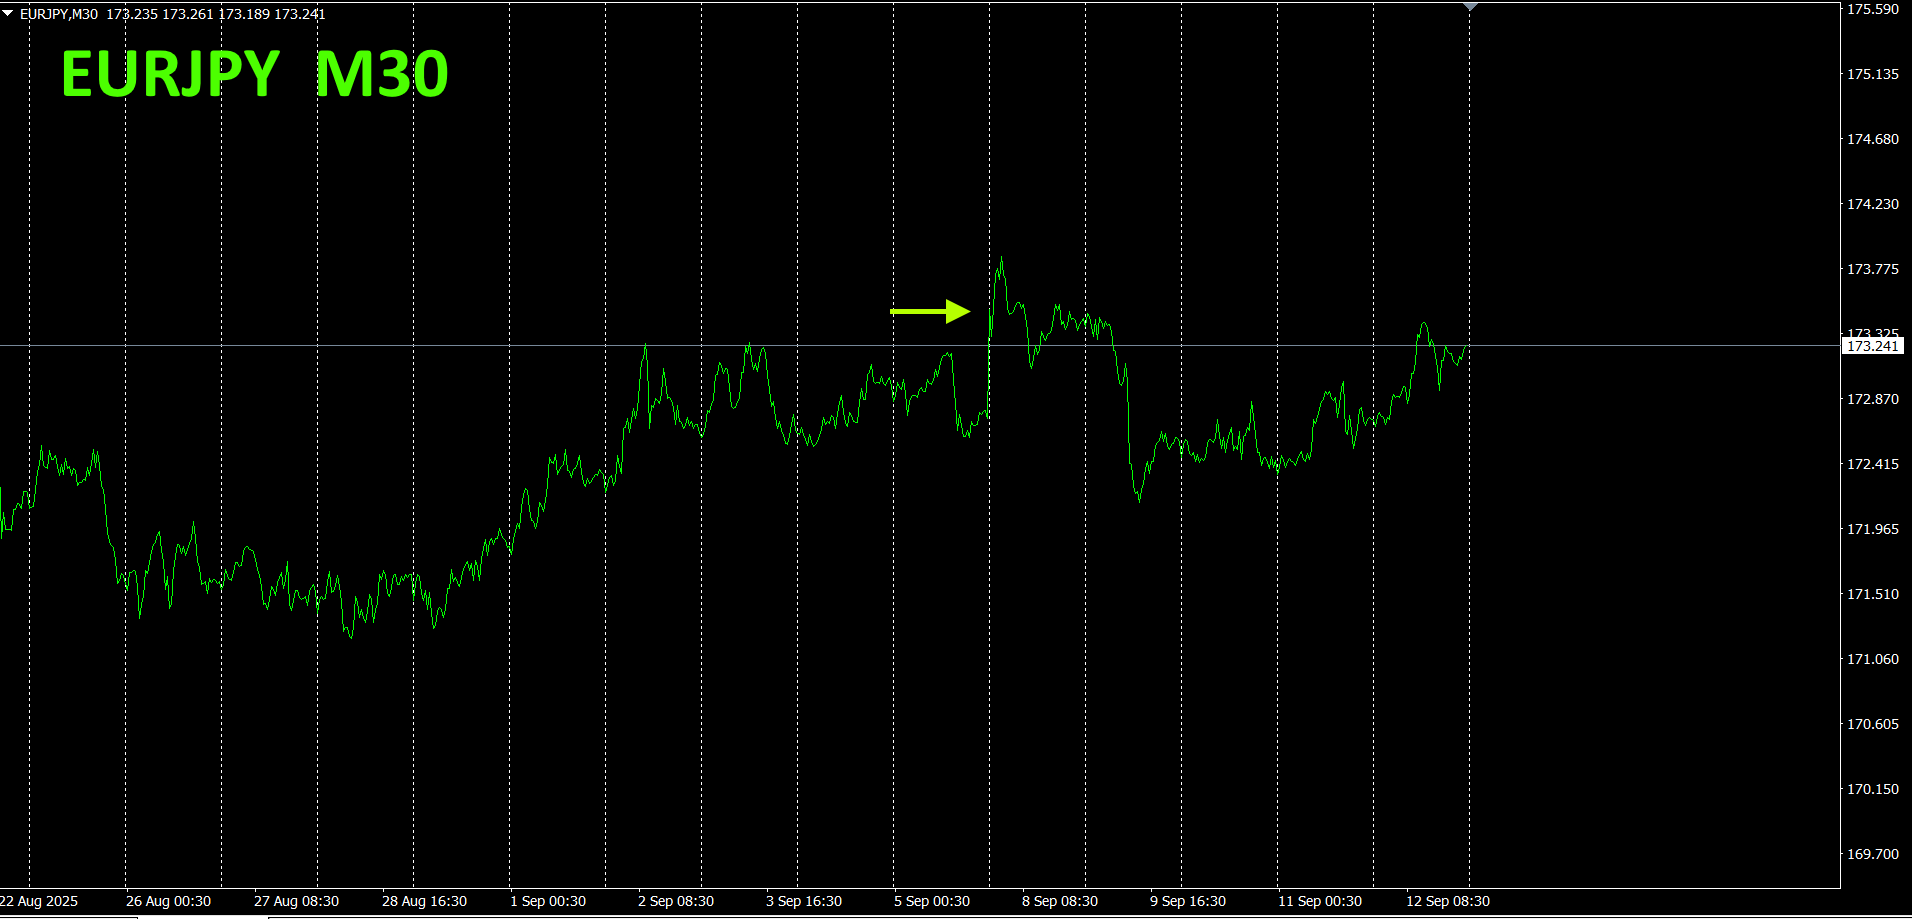
3. 2021 year5月 to present, EURJPY movement
2021 year month movement tracked.
To view the overall trend, we drew about30 minutes of the most recent weeks on a 30-minute chart.
Previously, I wrote the following.
Pink indicates, green indicates. EUR is expected to stay in a tight range for a while with limited upside.。
As expected, it remained in a range and did not move upward much.
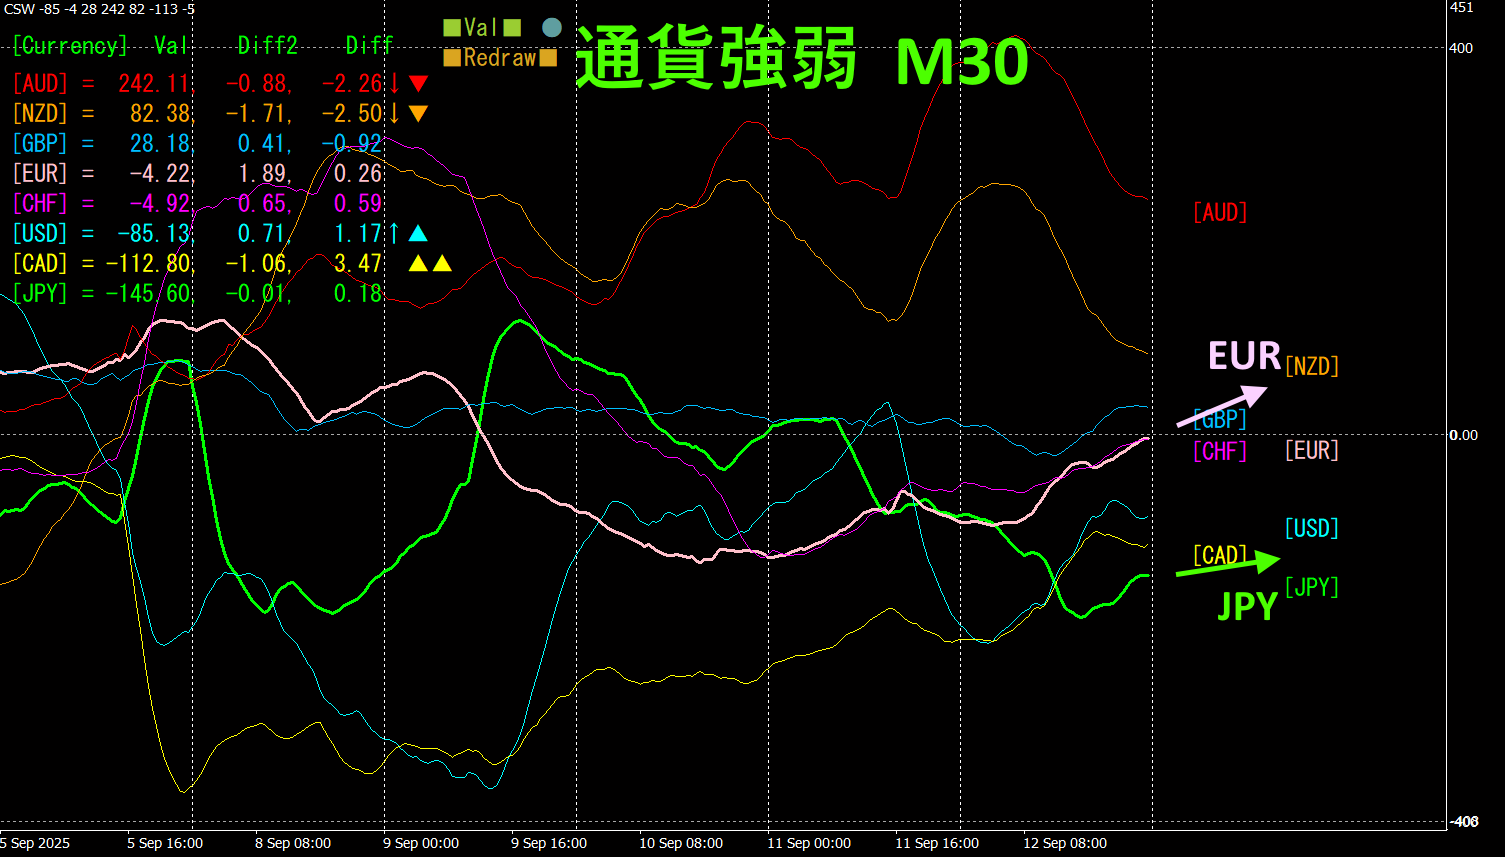
minutes currency strength chart.
Pink indicates, green indicates. EURJPY
4. New IndicatorDual_MACD_Trend_Indicator to tryd
New indicator “” details below.
MT4 version:
This indicator clearly shows the trend direction with colors. If color bar is Lime, it’s a buy; if Red, it’s a sell. It’s beginner-friendly and easy to use. Green bars indicate an uptrend, red bars a downtrend; if no color, there is no trend. With color display, you can grasp the trend at a glance.
I installed this indicator on EURAUD’s hour chart.
The red sell zone and green buy zone are clearly separated, making trading straightforward at a glance. Since EURAUD is in a downward trend, you just sell in the red zone of the indicator. This method allows you to focus on the parts where the trend is likely to move, earning profits without strain.
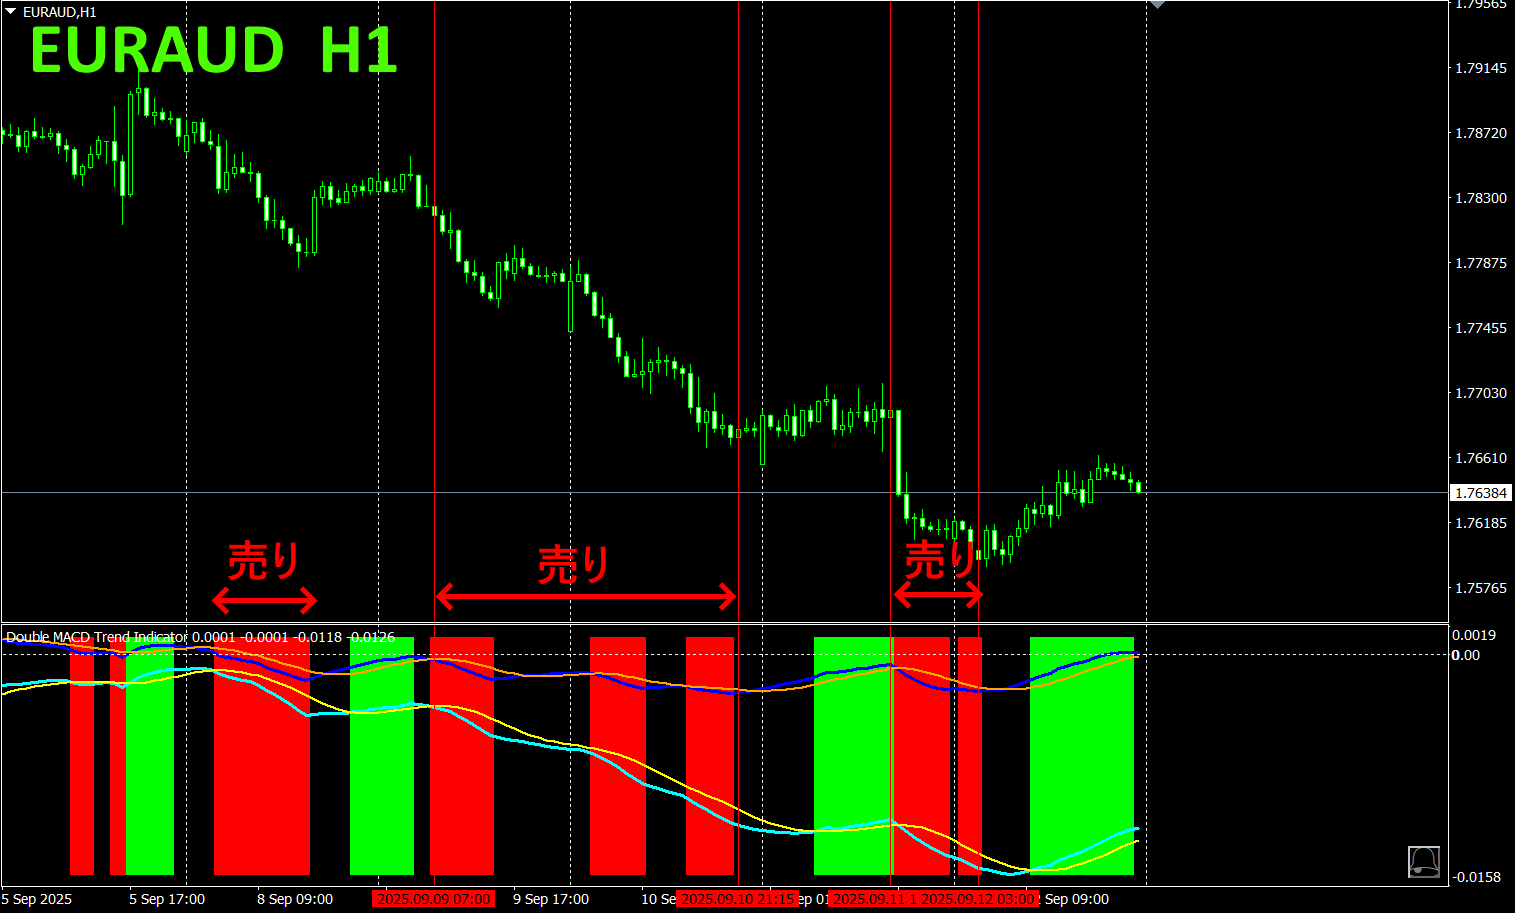
“” indicates buy in green zones, sell in red zones, and do not trade otherwise.
If you use the, there will be no more guesswork about trading direction.
5.
“” has been released
“” is a high-performance indicator that visualizes the strength of the eight major currencies at a glance. It records the strongest currency and scores over the past 10 bars in the current time frame and accurately captures trend persistence and turning points. It also supports multi-timeframe analysis showing currency strength rankings (top 4 currencies) for M15, H1, H4, D1, and W1 with scores. Its highly visible color lines and separate window help you gauge market flow effectively.
For details, see the following link.
https://www.gogojungle.co.jp/tools/indicators/65082
6. Now, isgetting hot??
Long time no talk about.
“ AnyOIL

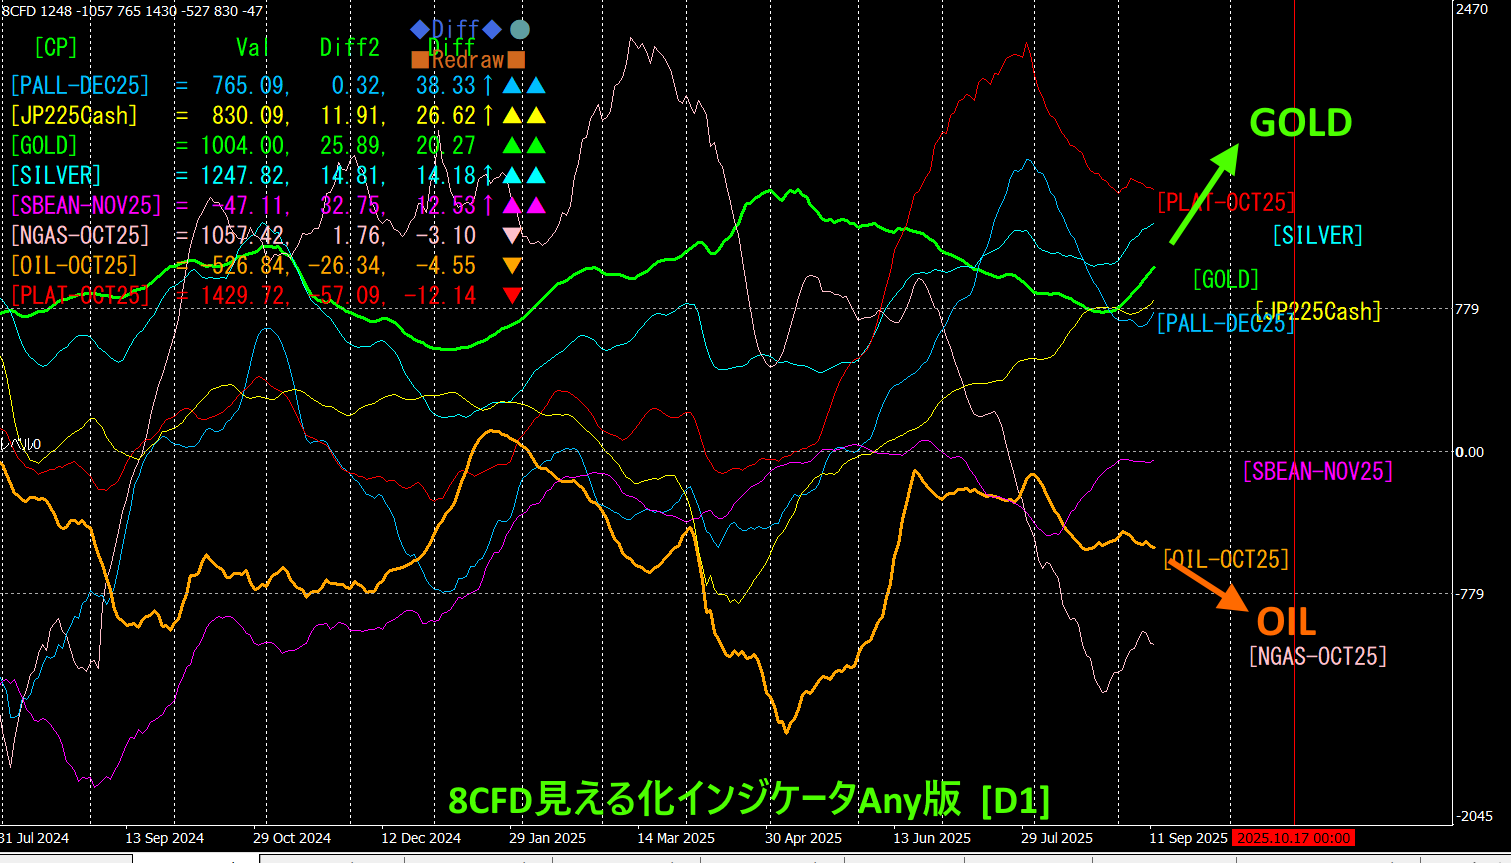
To make it clear, GOLD and are shown with thick lines. and have a solid inverse correlation. Moreover, looking at the waves in the chart suggests that GOLD is about to move up. Other precious metals (platinum, palladium, silver) are rising as well. On the other hand, energy-related resources and have fallen.
Since this is a daily chart, keep lot sizes modest and hold a long position until the next peak (estimated mid-October) for substantial profits. After all, daily trading is best!
※ Recommended indicators
“ Visualization Indicator
“Toretore Indicator”
“”


“ Currency Strength Visualization Indicator” please refer to the following page.

version https://www.gogojungle.co.jp/tools/indicators/39159
【Items I have for sale】


