

It's fairly active, but I think it's better to wait properly and aim for a higher chance.
There are great coupons available!!

You can view reviews and videos here
Good morning everyone.
Currently it looks like either direction is fine—up or down.
USD/JPY 5-minute chart
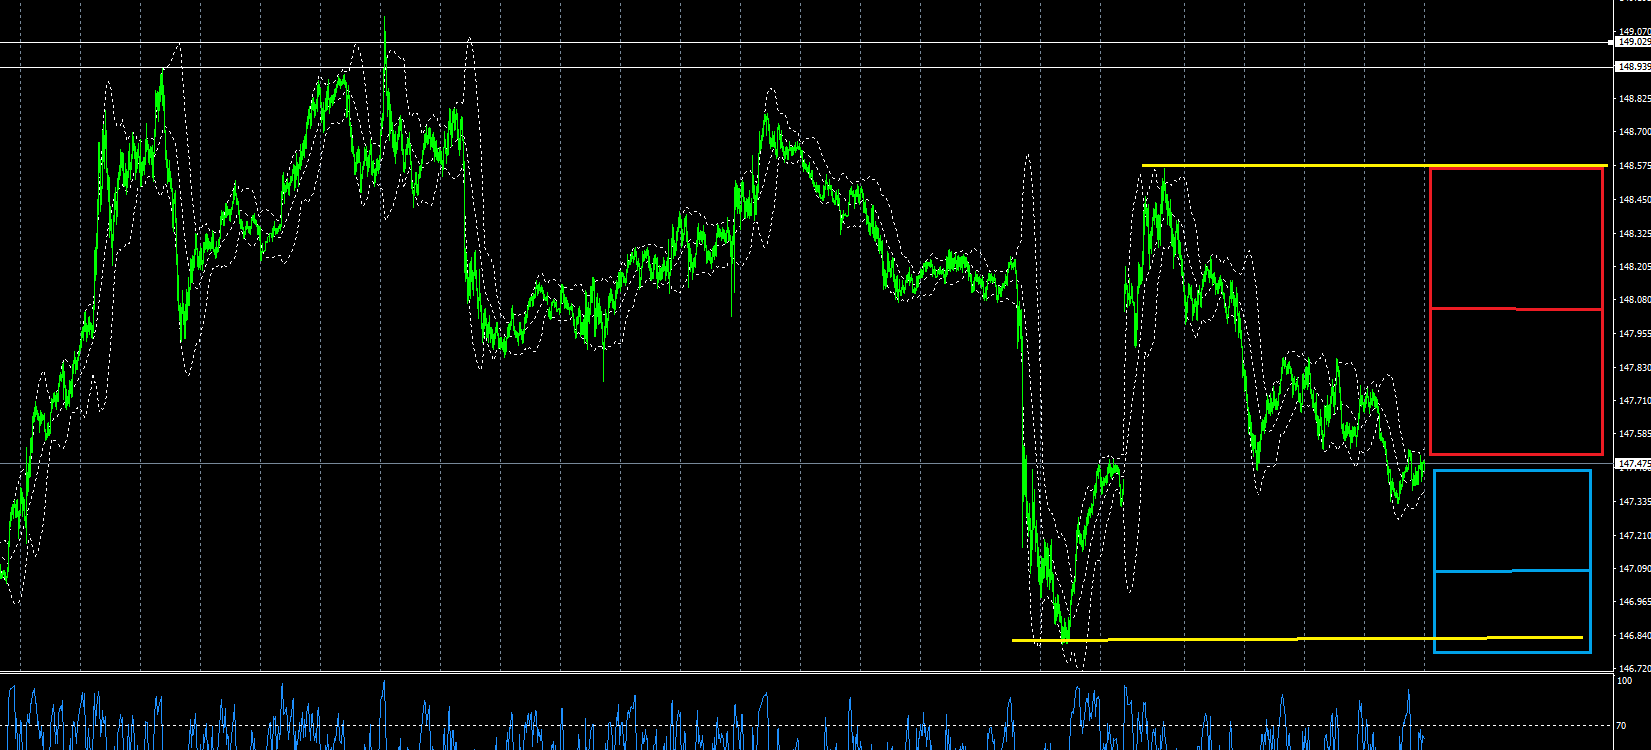
The red □ represents about 1 yen from the current price.
I drew a horizontal line in the middle.
The blue □ is viewed in a similar way.
The horizontal lines are around 14800 and 14700.
A yellow horizontal line may be clear in the future, but first we need to see how the movement will unfold up to that level.
This could become a difficult position to chase.
Where was yesterday's reversal point? Confirm.
USD/JPY daily chart
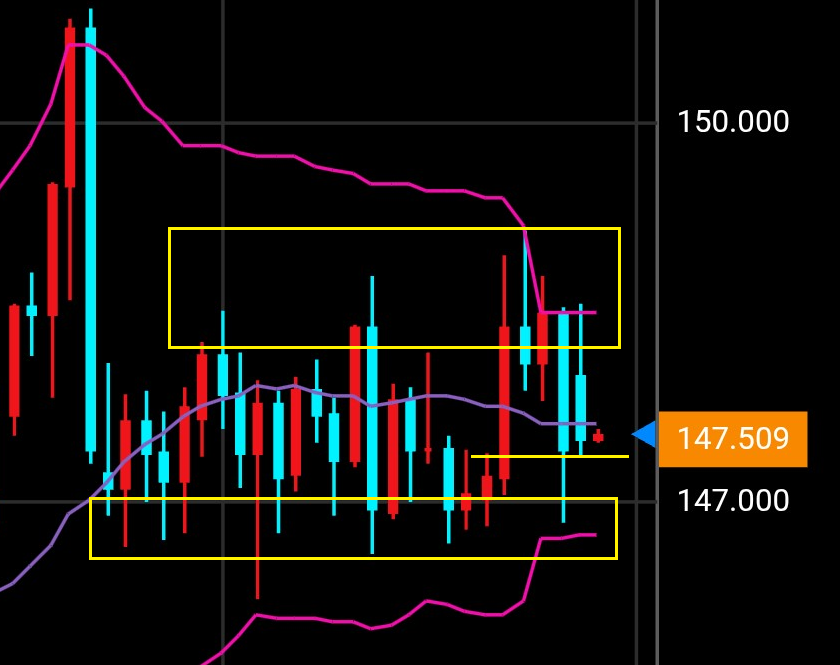
As you can see on the daily chart, it's been in a fairly wide range for quite a while.
B-band is giving a nice vibe, but that’s only because the price and candles moved to that level.
It's good to use as a guideline.
In reality, there have been rebounds around the yellow □ zone and yellow horizontal line, so it's about how to view and judge around there.
Below, there is about 50 pips to 14700, so today if it drops that far, you would first buy around 14700.
For elite traders and non-traditional hedgers, positions are built from points like this.
For hedgers, since sometimes waiting for a bottom and looking at the wick can be too late, going long at touching 14700 or breaking below 14700 can be effective.
Nikkei is still making new highs as usual.
If you dawdle, by year-end you might see 50,000 around…?
Well, USD/JPY also has about 1 yen daily move, so there are chances to trade and make a little money after work.
Don’t rush into positions to avoid missing out.
USD/JPY 1 hour and 1 minute charts
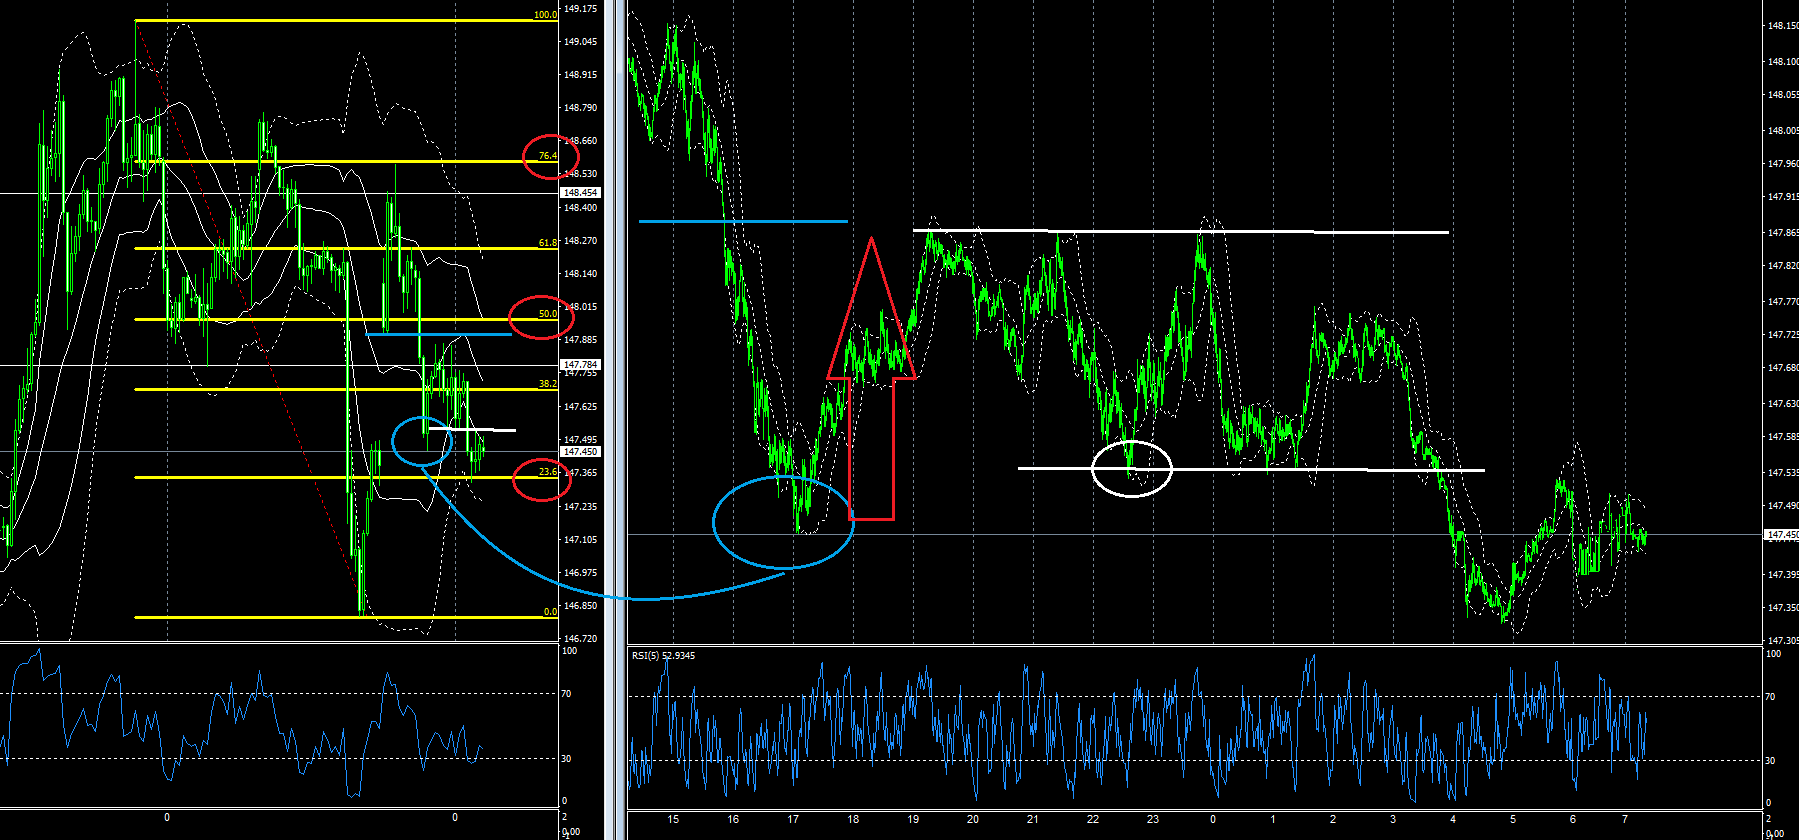
The gap closed at blue circle, and then rose after around 5 PM.
This is a moment to chase on the elite trader line.
But given the time, people who are at work cannot participate.
I have written about this pattern many times in Investment Navigator, so memorize the pattern and then focus on timing; remember the times right after the market opens or right after economic data releases.
I have applied Fibonacci on the 1-hour chart.
When you feel it may be in a range, I look at where the 50% level of the red □ is and the levels above and below the red □.
I don’t have a personal rule or justification, I simply trust the Fibonacci golden ratio….
As a result, it has rebounded nicely.
However, for elite traders who view Fibonacci, it is enough to confirm where the 50% zone is.
Even if you obtain extra information, few of them lead to winning trades.
What matters is whether the price is moving above or below the 50% zone.
Even if you judge that the price is moving lower and thus selling pressure is strong, the elite trader chart will give a buy signal, so you should follow that signal for a position.
That is because it is a point where the price bottoms and starts to rise, so the upward momentum is strong.
* How elite traders use the elite trader chart to determine the best Fibonacci levels!!
On any timeframe, apply Fibonacci starting from the recent high and low in the up and down zones.
I prefer applying it on the 5-minute or 1-hour charts.
Nevertheless, if the trend on the 1-minute chart is long enough, I sometimes apply it there as well.
This is for guidance only; positions should be based on the Elite Trader Line as the indicator.
I hope you understand Fibonacci application as a method.
By keeping these articles in mind and starting to view charts today, you may feel you somewhat understand how movements will unfold in the future.
It’s okay to have a rough sense.
If you’re wondering why this is good, consult with the Elite Trader Chart.
The key is consultation at the points of selling/buying or buy-sell reversal.
What I, as a trader, recommend today are the following three products.
The New Elite Trader Scalping: Volume Plus
Forex Trading: Not Your Ordinary Hedging
Explosive Birth Indicator: Transition to a Winning Trader
That’s all.
Thank you again for today as well.
× ![]()