

ICT Theory × Institutional Investors and Smart Money|Part 1: 'Institutional Investors and Smart Money, Order Block'
What is ICT Theory (Inner Circle Trader Theory)? It is a theory to understand the strategies and psychology of institutional investors behind price movements and to find trading points with an edge. It emphasizes reading the market's "flow" and "setup" rather than just technical analysis.
In this magazine, we introduce practical know-how for applying ICT Theory, including chart analysis examples, bullish/bearish FVG, and smart money intent-based trading strategies. Individual traders can understand the actions of institutional investors and systematically learn information to apply to their own trading.
First, let's clarify the terms "institutional investors" and "smart money."
Institutional investorsare the investing entities such as banks, brokerage firms, and hedge funds that manage large sums of capital. Their goal is to secure profits in the market in a stable manner and they are not swayed by short-term price movements. They look at the long-term price action in a planned and strategic way and deploy funds gradually. While many individual traders react to short-term chart moves, news, and economic indicators, institutions move large orders in stages to avoid moving prices too much and enter positions cautiously.
What is used here issmart money—a concept meaning the flow of "wise money." One reason to study ICT Theory is to capture the movements of this smart money. In other words, by reading how much positions institutions are building at what price ranges and riding that flow, individual traders can increase their win rate effectively.
What moves the market is the institutional investors. Their entry points are called "Order Blocks (OB)." By reading these, your win rate can dramatically improve, and your chart perspective changes significantly.
If you are the type of trader who sticks to the PC after entry, ICT Theory will make trading much easier after you learn it.
In this series, the author aims to introduce this theory to as many people as possible based on personal experience, so that you can learn to trade with confidence and win. If you are interested, please stay with us until the end.
Decisive differences between institutional and individual investors
Many individual investors chase breakouts, buying near highs and selling near lows. Moreover, when they hold unrealized losses, their mental state can crumble and lead to emotional trading. Because they have limited small capital and aim for a big win in one go, they may be swept by the market in the end.
Institutional investors operate with a completely different strategy. They hunt market liquidity, buy at lows, and sell at highs with complete thoroughness. They are not swayed by short-term emotions. Trades are planned and executed meticulously, with enormous funds deployed gradually. Their financial power is hundreds to thousands of times that of individual traders and can significantly impact the market.
Therefore, for individual investors to succeed, it is most important not to fight the flow of institutional investors but to ride it. Understanding their strategies and viewing the market from the same perspective is the key to continued success.
Behaviors of losing individual investors
Chasing breakouts
Buying at highs, selling at lows
Mental collapse leading to emotional trading
Going all-in with small capital
Institutional investor strategies
Hunting liquidity
Buying at lows, selling at highs
Planned trading
Gradual accumulation with large funds
The funding power of institutional investors is hundreds to thousands of times that of individuals!
Rather than going against them, riding the flow is the key to success?
Institutional investors' entry strategies
Order Block (OB)
Order Block (commonly abbreviated OB) refers totraces where institutions have placed large orders. Their funds are enormous, and they do not push all orders into the market at once but place them in stages. The traces that appear on the chart as they do this are Order Blocks. Bullish OB is formed just before a sharp rise and represents the last group of bearish candles. This is a point where institutions have bought, and it tends to become a strong demand zone (pullback buy point) when price retraces later. In other words, levels where institutions have previously supported buys tend to generate strong demand again.
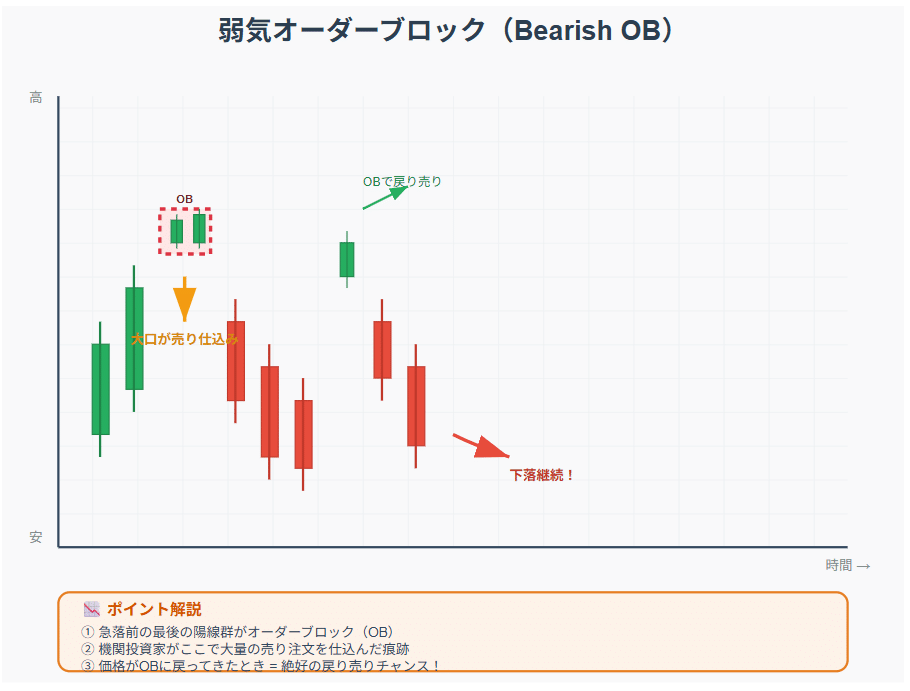
Conversely, Bearish OB appears just before a sharp drop as the last bullish candle group. This is the spot where institutions have sold, and when prices recover later, it tends to be recognized as a selling point. In other words, levels where supply was strong in the past tend to generate strong selling pressure again.returning selling pointthat are likely to be recognized in the future.
Order Blocks are crucial clues to read the traces of institutional trading and act in line with that flow. While individual investors are driven by emotion, institutions trade in a planned and meticulous way. Understanding these traces is important.
Bullish OB (Bullish Order Block)
Last group of bearish candles before the surge
Point where institutions bought
Likely to become a pullback-buy point in the future

Bearish OB (Bearish Order Block)
Last group of bullish candles before a sharp drop
Point where institutions sold
Likely to become a return-selling point in the future
Institutional entry strategies
Stop Hunting
“Stop hunting” refers to the movement where institutions intentionally move the market to trigger personal investors’ stop-loss orders and cause executions.
Many individual investors place their stops just outside the most recent highs or lows. This is a natural risk-management behavior but also means there is a concentrated liquidity at obvious levels. Institutions are well aware of this and purposefully probe those levels to absorb a large number of orders as the market moves temporarily.
For example, suppose a pullback high in a downtrend has many stops stacked above it. Institutions push the market to break above that level once and trigger buy orders and stop-losses from individuals, then place sells immediately after to use the abundant liquidity to establish large positions in the direction of the downtrend.
In short,“Stop hunting” = an inevitable act by institutions to secure liquidity. For individual investors this may feel like being deceived or betrayed, but in reality it is part of institutional strategy.
Why buy when prices are going down?
To avoid the impact of large orders
Buying all at once would push the price sharply higher
To obtain at favorable prices
Deliberately lower price to use individual selling orders
To utilize order book liquidity
Identify concentration points of orders and accumulate progressively
Three steps to OB formation
1️⃣ Initial accumulation
Small orders at OB/FVG (explained in the second part)
2️⃣ Added on pullbacks
Add when price declines
3️⃣ Increased orders
After a large bullish/bearish candle, return to OB/FVG and add heavily
Flow:Initial accumulation → pullback addition → increased orders
Timeframe usage strategy
Use case Point
|Daily chart| Confirm institutional major accumulations | Identify long-term OB |
|4H chart| Pullbacks and FVG confirmation | Mid-term fine-tuning |
|1H・15-min charts| Entry timing | Short-term adjustments only |
Key points
Institutions basically do not day-trade!
Mid- to long-term positions are the norm
Short-period settlements are rare (only some hedge funds)
Analysis centers on daily and 4H charts; 1H and below are used for timing
Active market hours
London market
16:00–24:00 (Japan time)
New York market
21:00–5:00 next day (Japan time)
Survival strategy for individual investors
Individual investors cannot realistically oppose institutional investors!
The only survival strategy is to “read their intentions and ride the flow.”
Institutional investors summary
Banks, hedge funds, pension funds, central banks
Manage hundreds to thousands of times more capital than individuals
Sharp rises/falls and OB formation are traces of institutional moves
Wrap-up
? OB as traces of institutionals' entries= Traces of institutional entry
? Mid- to long-termare the fundamental strategy of institutions
? Daily and 4H chartsanalysis at the core
? Ride the same flow as institutionsis the survival strategy for individual investors
What to remember
Do not go against institutions; ride the flow
Order Blocks are ideal points for pullbacks and pullbacks
Use timeframes according to purpose