

I will explain why 90% of trading is a waiting game
Reviews & videos can be viewed here
Good morning everyone.
Yesterday USD/JPY traded sluggishly from the morning, perhaps waiting for the US indicators in the evening.
It initially fell when the indicators were released, then surged sharply from around 14800.
About 15 minutes after the release, I think those who took an L position could easily profit, but because fills didn’t come smoothly, it felt like we clicked into a decline.
GMO’s FX OP allowed easy shorting of the yen with high leverage ↑ positions.
It rose about 300 yen in one go, so profit-taking was straightforward.
It was good to turn a poor morning into a break-even or positive start.
Yesterday, around noon, I reflected, saying, “Today was a day you shouldn’t have traded.”
But that reflection doesn’t necessarily help in the next trade; that’s the nature of trading.
Tokyo starts and within an hour, it becomes a range, and in yesterday’s article I wrote
.
This was written as a strategy to take L positions once we reach that point,
but even though it was decided early, I turned modestly profitable with the breakout, so next I aimed to take the drop to 14785 and took S positions, but ended up with several stop-losses, about 1 million units down by around 15 pips.
Later, after China opened, I saw the drop below 14785, so I took 0.5 million + 0.5 million in two L positions, which yielded decent profits.
The general patterns for losses are
In ranges
- Selling at the lows and failing
- Buying at the highs and failing
In trends
- Deep pullbacks causing failures
- High retracements causing failures
- Entering a high while it’s about to go down (L) and failing
- Entering a low while it’s about to go up (S) and failing
Broadly speaking, losses tend to occur in this way.
In short, the way you lose is understood.
But even though you understand it, “greed” or optimistic expectations can win out, leading to losses.
This is hard to fix because it involves personality.
I’ve struggled with it too.
My thinking is contrary by nature, yet my actions often align with crowd psychology, making things chaotic.
Amid these twists and turns, I concluded that “FX doesn’t lose if you know where the reversal location is,” so I set out on a journey to find that reversal location.
In the past, wasn’t reversal location the key?
So the things I tried were
- Tokyo equilibrium line
- Four price points
- Highs and lows of Tokyo, London, and NY
- Support/Resistance indicators
and, as much as possible, I based my chart on confirmed prices.
However, even such efforts did not yield lasting results.
Maybe others would find success, but...
I tried various overbought/oversold indicators, but in the end they were only after-the-fact interpretations and not usable in real time.
Then, there was a service online that showed customer positions, and I noticed “buy accumulation” and “sell accumulation,” which seemed quite important, perhaps.
In the chart representations as well.
I learned that once those accumulations break through, price moves substantially.
With this, I realized the market clears support/resistance and then expands.
Therefore, my conclusion was: when the market rises from a buying area, sellers later aim for that buying area and push it down.
And after that, with clears or rebounds, the market reverses.
Yesterday’s USD/JPY hourly chart
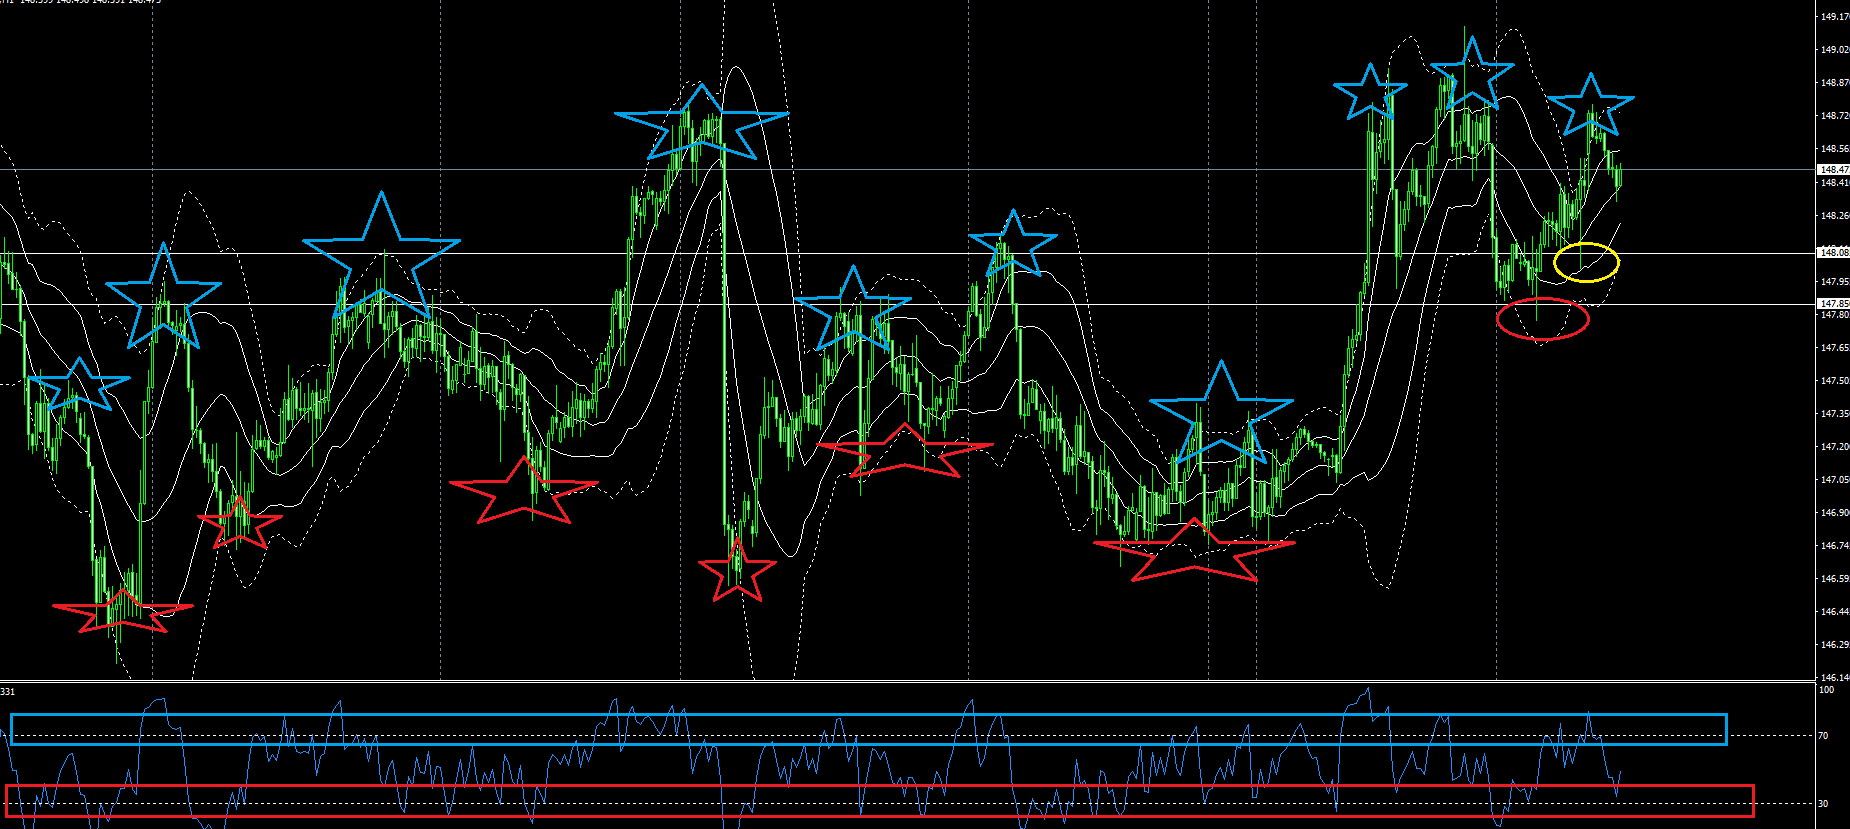
In hindsight, if you had been selling at the blue stars and buying at the red stars, you would have won.
The yellow and red circles were yesterday’s points.
In short, what matters are the red and blue stars.
This is something you must analyze with your own eyes and discover the location by feel.
One thing to note is that even though this is on a 1-hour chart, if you trade within the star area on any time frame, you’ll be easily bounced around.
Therefore, it is prudent to pick a star and wait firmly.
In Tetris terms, you stack blocks and suddenly clear them all in one go, leaving no blocks.
That moment is simply a matter of whether it’s a counter-trend or a counter-trend within a trend.
To our億-trade users, viewing the億-trade lines, buy/sell reversal points, and interim target points as stars will allow you to test positions there, and then build trades from the 1-minute億-trade chart and億-trade lines.
Waiting is important.
Because price volatility also tends to arise from the waiting point.
Like pulling a rubber band with both hands and letting go on one side, you get a strong pull on the other side.
That feeling.
So when and what time should you wait after returning home today is described in the manual.
The high likelihood of failure is not waiting when you should, and entering positions midway.
Even the same failure, if it is meaningful, results in normalization of outcomes.
Such data accumulates in your mind, increasing the rate of successful trades.
Spend less on expenses than on sales.
If you limit the occasions to spend, numbers will come out.
To limit this, you must “wait.”
If you consciously review this and adopt it, you can trade differently from today.
All of the products I offer are designed to adapt to these reversal situations and movements after reversal.
For example
This product is effective for scalping on the 1-minute chart.
What happens if you change the time frame for trading
- 1-minute or 5-minute = scalping
- 1-hour = day trading
- Daily chart = swing/position
and it can correspond to your own trading style.
Stop-loss points become farther as the time frame increases, so you adjust by position size.
It’s extremely simple and straightforward.
If you continue, you will understand, but the result will homogenize.
As a result, it’s enough that wins exceed losses; on the 1-minute chart, it becomes a question of how today went.
To avoid becoming a target of the market, whether you can wait at any chosen point is a major factor in winning or losing.
The three products I recommend as a trader are below.
New億トレーダー Scalping with Volume
FX trading with unconventional hedging
Explosion Indicator: Transition to a Winning Trader
There you go.
Best regards for today as well.