
USD/JPY Continuous decline signal, near-term downside target (Point and Figure)
1-hour chart 0.1 yen standard frame P&F chart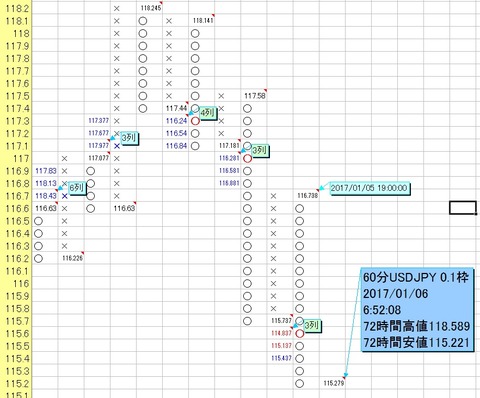
USD/JPY has continued to fall after hitting a high of 118.589 yen on January 4th.
As shown above, continuous bearish signals have appeared on the 1-hour 0.1 yen standard frame Point & Figure chart, most targets have been reached, but last night a new additional bearish signal appeared.
The minimum value is calculated to be 114.837 yen.
Near 114.837 yen to 115.137 yen is expected to be the near-term downside target.
We have revised the “Market Forecast Tool”
Introduction and how to use the “Market Forecast Tool”