

【Sea of Clouds UNKAI】London Time Verification|+21 pips──Over one week, exploring intraday advantages by time window
UNCHAI About UNKAI
【 UNKAI 】Stains of white clouds, a line of light

UNKAI(UNKAI)─An auxiliary tool that takes your method to the next level
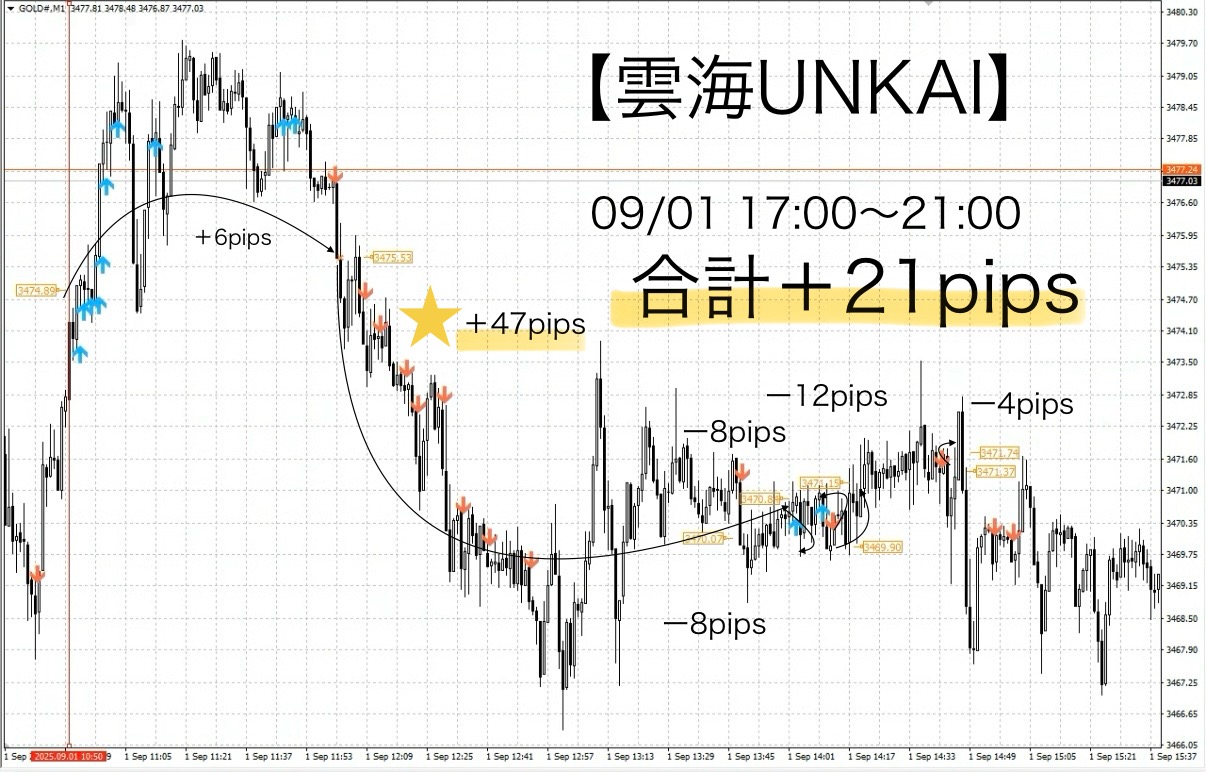
【雲海UNKAI】London time verification | +21 pips — exploring intraday advantages over a week
Total P/L:+21 pips
What UNKAI finds most important now isto have a clear criterion for where to take profit when a rapid rise occurs.
In the Sky Gap, we could clearly set zones or lines in advance, but with UNKAI we started from testing the dogfooding of the “UNKAI indicator alone” and without filters.
First, by conducting aforward test for 1 week using historical charts,
• whether there is a consistent edge with the signal alone
• or whether even with rules it is difficult to apply practically
we expect to grasp the rough feel.
⸻
Verification conditions
• Subject: GOLD
• Timeframe: 1 minute
• Period: 09/01 17:00–21:00 (London Time)
• Rules: “Signal → IN / Opposite signal → OUT” and “stop loss conditions 1–2 items”
⸻
Verification results
• Trades: 6
• Take profits: 2
• Stop losses: 4
• Total take profit: +53 pips
• Total loss: −32 pips
• Net profit: +21 pips
• Win rate: 33.3% (2 wins / 6)
• PF (Profit Factor): ~1.65
Discussion
In this test, there were big gains early, but around 19:00 losses were prominent.
Therefore, we will not change the rules for now, and plan to continue past-backtesting in weekly segments by time zone.
By understanding time-of-day trends,
• “Which time zone tends to rise most?”
• “Which time zones tend to have more stop losses?”
we aim to refine more practical rule improvements.
⸻
Future plans
Investment Navigator used to post daily in July and August, but
• Writing Sky Gap articles
• New UNKAI verifications
• Educational material updates
• Q&A responses from customers
• Management, family, and real trading
Going forward, it will be difficult to do all at once, so we plan to focus on “sign verification for UNKAI and publish past verification articles in Investment Navigator.”
Although still in verification, our goal is to eventually build a simple UNKAI rule that can be used in real trading as well.
We would be grateful for your warm support.
From now on, for both Sky Gap and UNKAIIf you have requests such as “Please test this currency pair” or “I want to see this time zone,” please feel free to
send a message or post to the community.
For GOLD 1-minute, there are times when the market moves further than the scenarios where we felt it could extend, as described in Investment Navigator articles, and if you had entered exactly as signaled, you might see unexpectedly large unrealized profits.
What we want to emphasize is that UNKAI is a tool that visually reflects the market’s “flow””. Do not rely solely on signals; combine with your own rules and use it as an indicator to gauge momentum. Without arrogance, it should be a powerful supplementary tool.
The key is to create your own rule first and then adopt UNKAI to reinforce that rule.
By doing so, you can visually confirm momentum direction and add confidence to your trades.
(Note) We do not necessarily recommend using it with Sky Gap, but in post-trade reviews you can decide things like
“Was it good to target the Sky Gap?”
“There are many signals, so I’ll be mindful of the Sky Zone.”
“There are few signals, so I’ll close in the floating or air zones.”
This helps reduce cognitive load by zone color-coding.
UNKAI × Rule compatibility
For example
• When combined with trend-following rulesthe blue arrows (upward momentum) and red arrows (downward momentum) in UNKAI act as an “aid to direction,” helping to avoid unnecessary counter-trend entries.
• Rules using zones or linesand by confirming momentum after zone reach, you can simply judge whether “this is a good moment to enter.”This is a simple decision.
• Logic prioritizing small losses, large gainswhere trading during consecutive arrows makes it easier to select only when momentum grows.
UNKAI is not intended to enter strictly on signals.
Rather, relying on signals alone increases the risk of “buying at the high and selling at the low.”
UNKAI’s role is to visually reflect the market’s flow.
• If more blue arrows appear above, the upward force is strengthening
• If more red arrows appear below, the downward force is strengthening
Thus, momentum direction is designed to be perceived intuitively.
UNKAI is not a sign tool that points out exact entries. It is designed as a “tool to confirm flow.”
We’ve compiled a short video showing how these signals are generated, so please take a look.
⸻
■ How signals work
•
• Blue arrows (up arrows):Displayed when the immediate prior momentum is upward
• Red arrows (down arrows): Displayed when the immediate prior momentum is downward
If a candle that showed a blue arrow closes higher, it means “range was captured.”
If a candle that shows a red arrow closes lower, it visualizes that you could have profit-locked on the downside.
• No repaint
Once a signal appears, it does not disappear. It remains even if the price moves against you, making it easy to review and verify.
• Notification features
An entry EA for breakouts

Entry EA manual included
“Sky Gap” is a simple strategy where entry is automated by EA, and the trader focuses on monitoring after entry and executing exit rules.
The EA continuously monitors the chart and can enter precisely at break moments.
This alleviates the stress of staying glued to the screen before entry and the anxiety of missing the timing.
ADX, ATR, SMA, and other filters included.
As a purchaser bonus, you will be able to use this EA.

【 UNKAI 】Stains of white clouds, a line of light here

For those who already have solid rules — UNKAI will further strengthen your method.
Why publish negative results?
Investment Navigator Plus intentionally publishes negative results as well.
Because “trading won’t always be profitable.”
Rather, by recording losses we can analyze what scenarios cause losses and harden the logic.
It’s not about winning or losing each time, but about the long-term profit over a span like a week or month.
•
“Today I’m glad we won.”
• “Today I lost, so I’m anxious.”
To eliminate these emotional swings, let the EA handle entries, and have humans focus on following the rules for exits.
“I want to win”this mindset is the foundation for long-term profitability.
Stability gained by following the rules
One common trait among people who lose big in trading is the urge to win, which leads to breaking the rules.
Sky Gap is designed with
•
•
This reduces human intervention and eliminates hesitation.
Simply following the rules mechanically stabilizes win rate and risk-reward.
⸻
There are countless technical analysis methods—moving averages, RSI, MACD, Stochastic, Parabolic SAR, ADX, ATR, CCI, trendlines and channels, Fibonacci retracements and expansions, Ichimoku, volume, and more—oscillators and support/resistance lines among them.
There is no single correct method; what matters is
⸻
We will test the Sky Gap “maximum take profit” style, and there may be times when market value closes at the base price; however, by adhering to the rules you can calmly seize the next opportunity.
Even in scenarios where you could have captured more, closing at the base price according to the rules helps you maintain overall positive results.
What is important in trading is “not the win rate but the “reproducibility”
Many traders worry about win rate, but
What matters is having a rule that yields the same results no matter who uses it — true reproducibility.
Sky Gap aims for
•
⸻
Strategy aimed at overall profit
Focusing on daily wins and losses is risky.
For example, over a week or month, even with some negative days, if the total is positive, that’s OK.
The EA has no emotions, making it ideal for long-term capital management.
Operating the system with a “want to earn” rather than “want to win” approach helps capital growth curve stabilize.
If you’re interested in Sky Gap, you’re invited to join the online community

Within the online community, while specific trading logic cannot be explained, you can join a “Chart Review Community” using Sky Gap.
To those interested in Sky Gap
Lay the foundation to make rule-based decisions without hesitation in short-term trading—this is the core philosophy of Sky Gap.

Free materials here:
In ‘Path to the Gap,’ you’ll learn in what situations trades can actually be made and the decision criteria is explained more clearly.
It explains more concretely the entry points and zone selection that could not be fully conveyed on the Sky Gap sales page, with diagrams and case-based explanations.
Even beginners can follow along, so if you’re curious, please use it as well.
If you’re interested, please first receive the free material ‘Path to the Gap.’
From there, your first step into the Gap begins.
“Should I enter this chart?”
When you’re uncertain,I hope this helps shift your thinking from “feel” to “rule-based decision making.”