

Utilization of the "Visualization Indicator" (Part 214)
“Visualization Indicator” utilization (part214)”
1. Further evolve and develop the “28 Currency Pairs List Indicator” into an indicator
“8CP Visualization Indicator”to plotAUDUSD.
The “8CP Visualization Indicator” includesOceania version,London version,NewYork version,AnyCP version. This time, theOceania version was used.
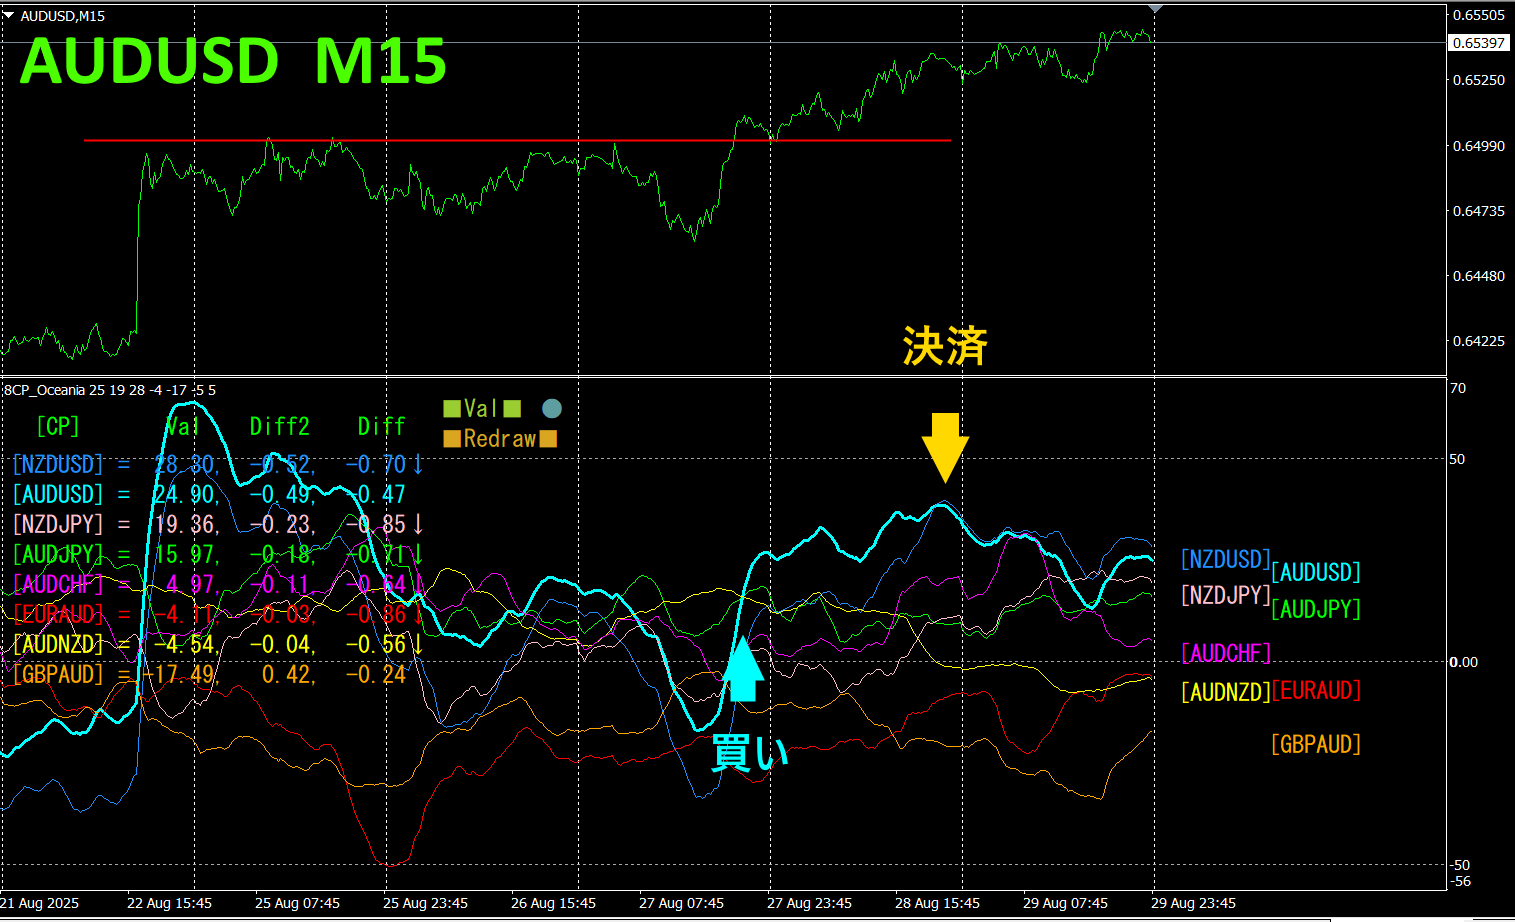
The upper half is the 15-minute chart ofAUDUSD. The lower half is from the “8CP Visualization Indicator”; the light blue thick line chart corresponds toAUDUSD.
On Wednesday, the graph ofAUDUSD rose above the other graphs, so a buy trade was made. This point is exactly the same as the red horizontal line drawn at the recent high. The trade was closed at Thursday’s peak, yielding about35pips of profit.
This week, overall, there was not much price movement.
Currency Strength Diagram
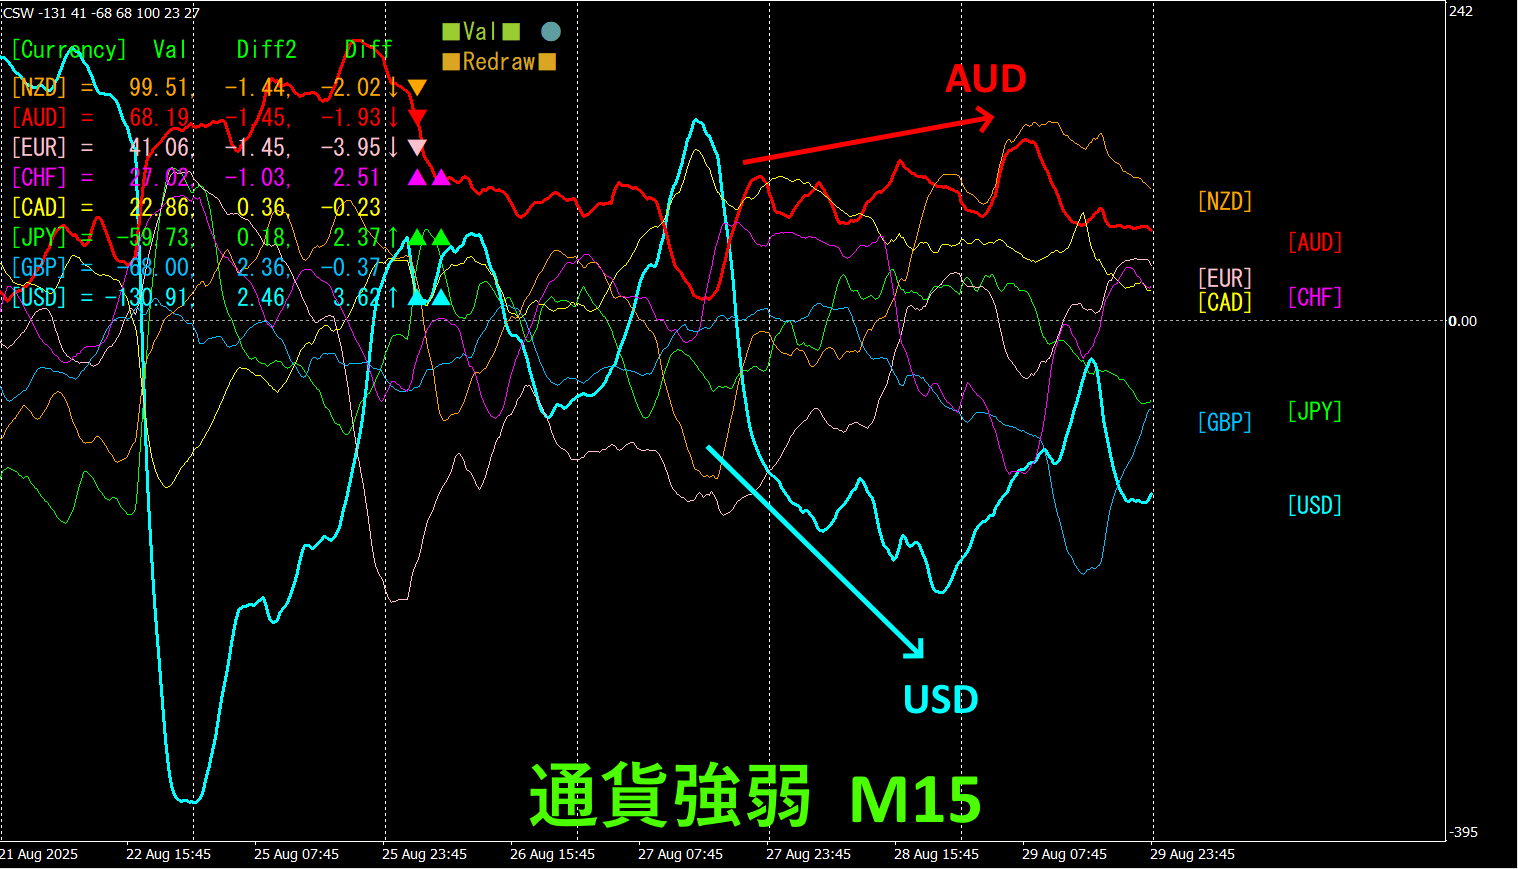
Looking at the 15-minute currency strength diagram,AUD andUSD show a remarkable inverse correlation.AUD andUSD, as they move from convergence to divergence, if you buyAUDUSD you can gain profits. If you choose the currency pair that is growing the most and in a reverse correlation, the results will follow naturally.
“Aim for Currency Strength Inverse Correlation!”isFX's rule of thumb.
If you use “TrendLine-EX, you can automate entries and exits by breaking diagonal trendlines. You can simply leave it running, enabling easy trading. “TrendLine-EX is a semi-automatic EA that can short-sell on trendline breaks and automatically close on upper breakouts.
2. Best SelectTry the Indicator
The below image is a screenshot datedAugust26,2025 at 04:26 (JST).
[Total]Numbers are sorted in descending order. At the top,USDCHF shows blue across all timeframes except the[H4] timeframe. The total is a positiveTotal value of +1892.95, indicating an upward trend forUSDCHF.
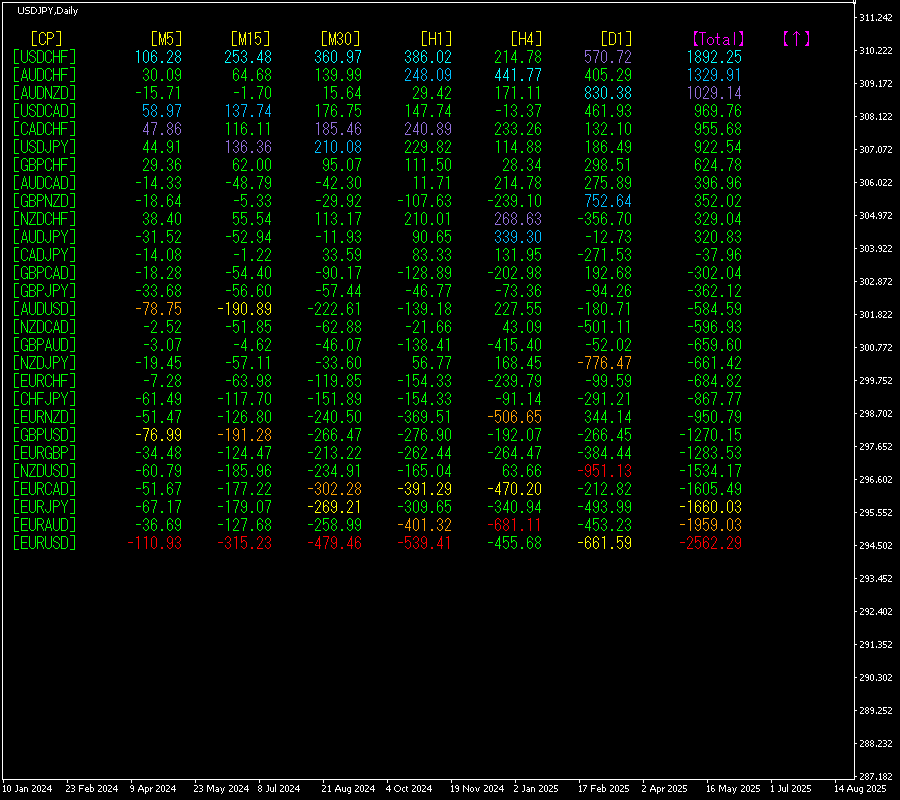
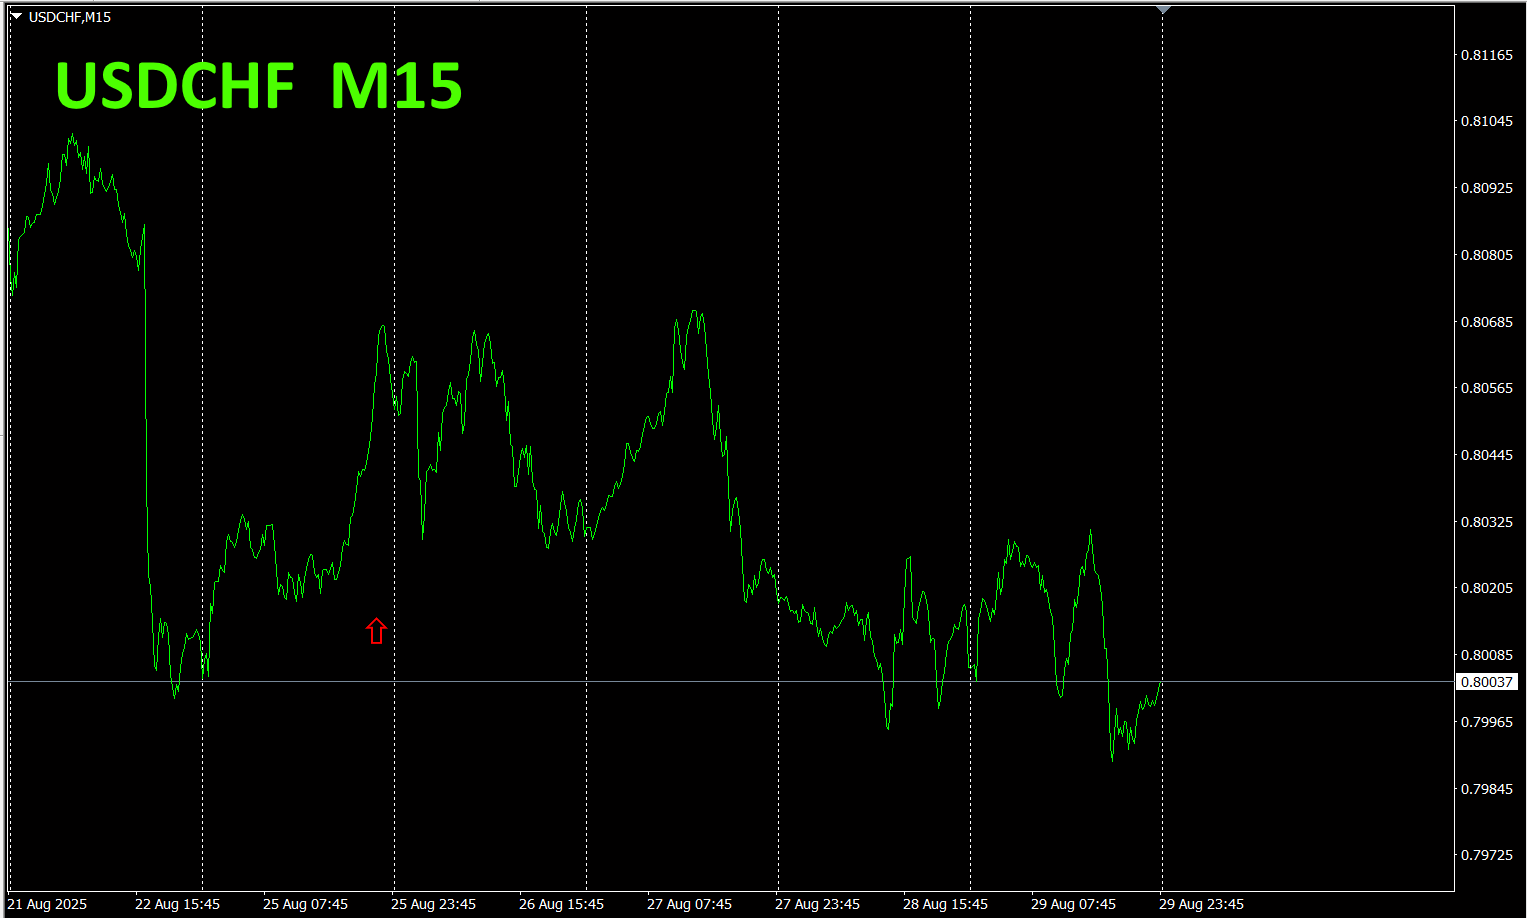
Now, let's look at the USDCHF chart.
The red arrows indicate where the screenshot was taken. It captures a slight upward move.
“28 Currency PairsBest Select
“28 Currency PairsBest Select

https://www.gogojungle.co.jp/tools/indicators/35128
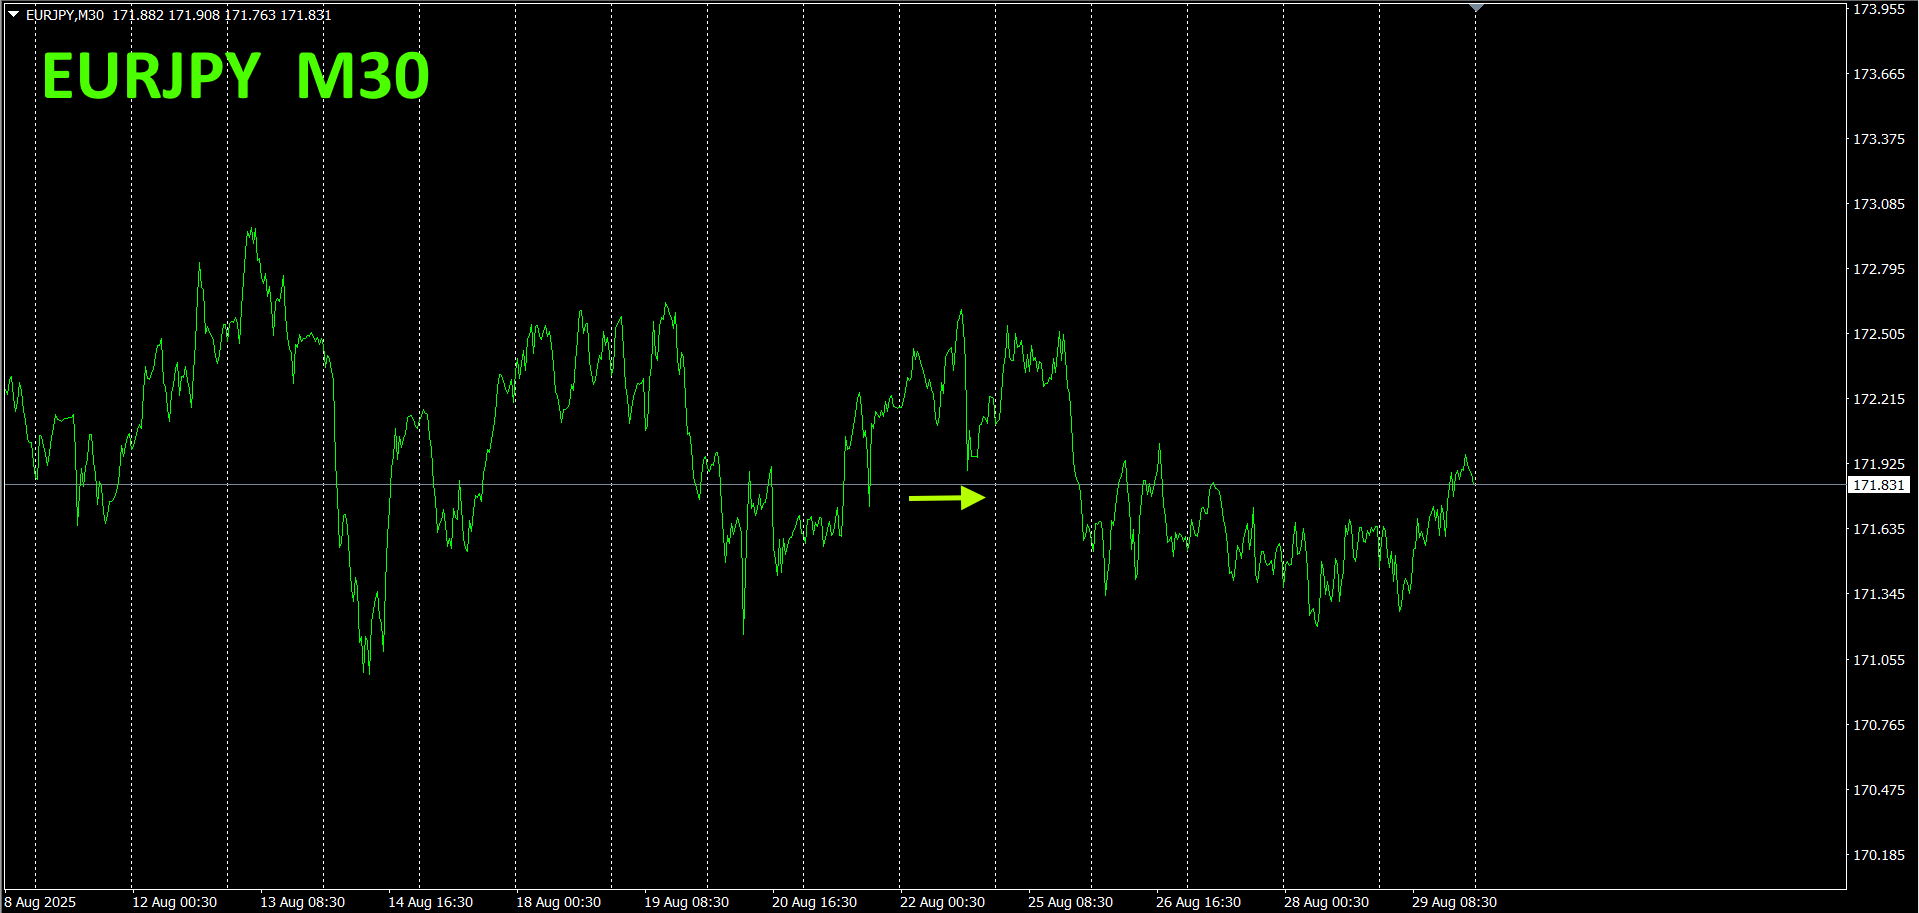
3.2021 year5 month to dateEURJPY movement?
year5 month to dateEURJPY movement explained.
For an overview, a30 minute chart covering roughly the last3 weeks is drawn. chart shows both
Previously, I wrote the following.
Pink isEUR, green isJPY.M30EUR andJPY trending slightly upward. EURJPY lacks a clear directional bias.EURJPY is expected to remain in a range for a while.
As predicted, there has not been a large move up or down.
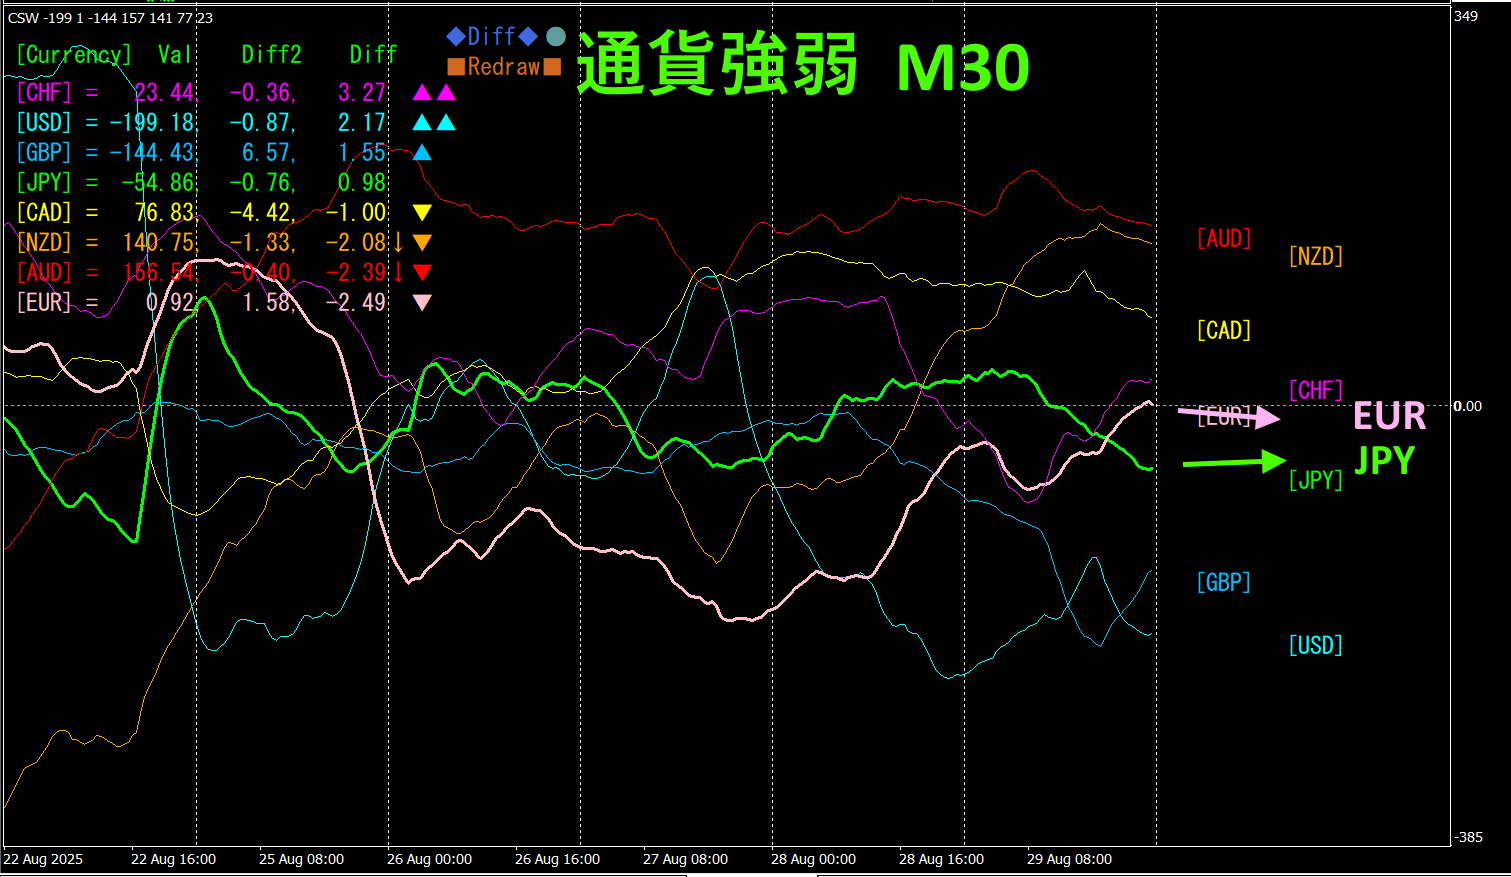
30 minute currency strength chart.
Pink isEUR, green isJPY.EURJPY is almost flat.EURJPY has no clear direction yet.EURJPY is expected to stay in a range with limited upside for a while.
4. Trying the new indicatorDual_MACD_Trend_Indicator.See
New indicator “Dual_MACD_Trend_Indicator” below.
MT4 version:https://www.gogojungle.co.jp/tools/indicators/62199
https://www.gogojungle.co.jp/tools/indicators/62202
An indicator that clearly shows the direction of the trend with color. If the color of the color bars is Lime, it means buy; if Red, it means sell. It is easy for beginners to use. If the bars are green, it indicates an uptrend; if red, a downtrend; and if no color, there is no trend. Because it uses color display, you can grasp the trend at a glance.
I applied this indicator toAUDUSD on the1 hour chart.
The red zone for selling and the green zone for buying are clearly separated, making trading easier. The portion circled with a white dot in the upper diagram (green zone in the indicator) can be traded as a buy. This way you can capture only the parts that will rise without forcing it.
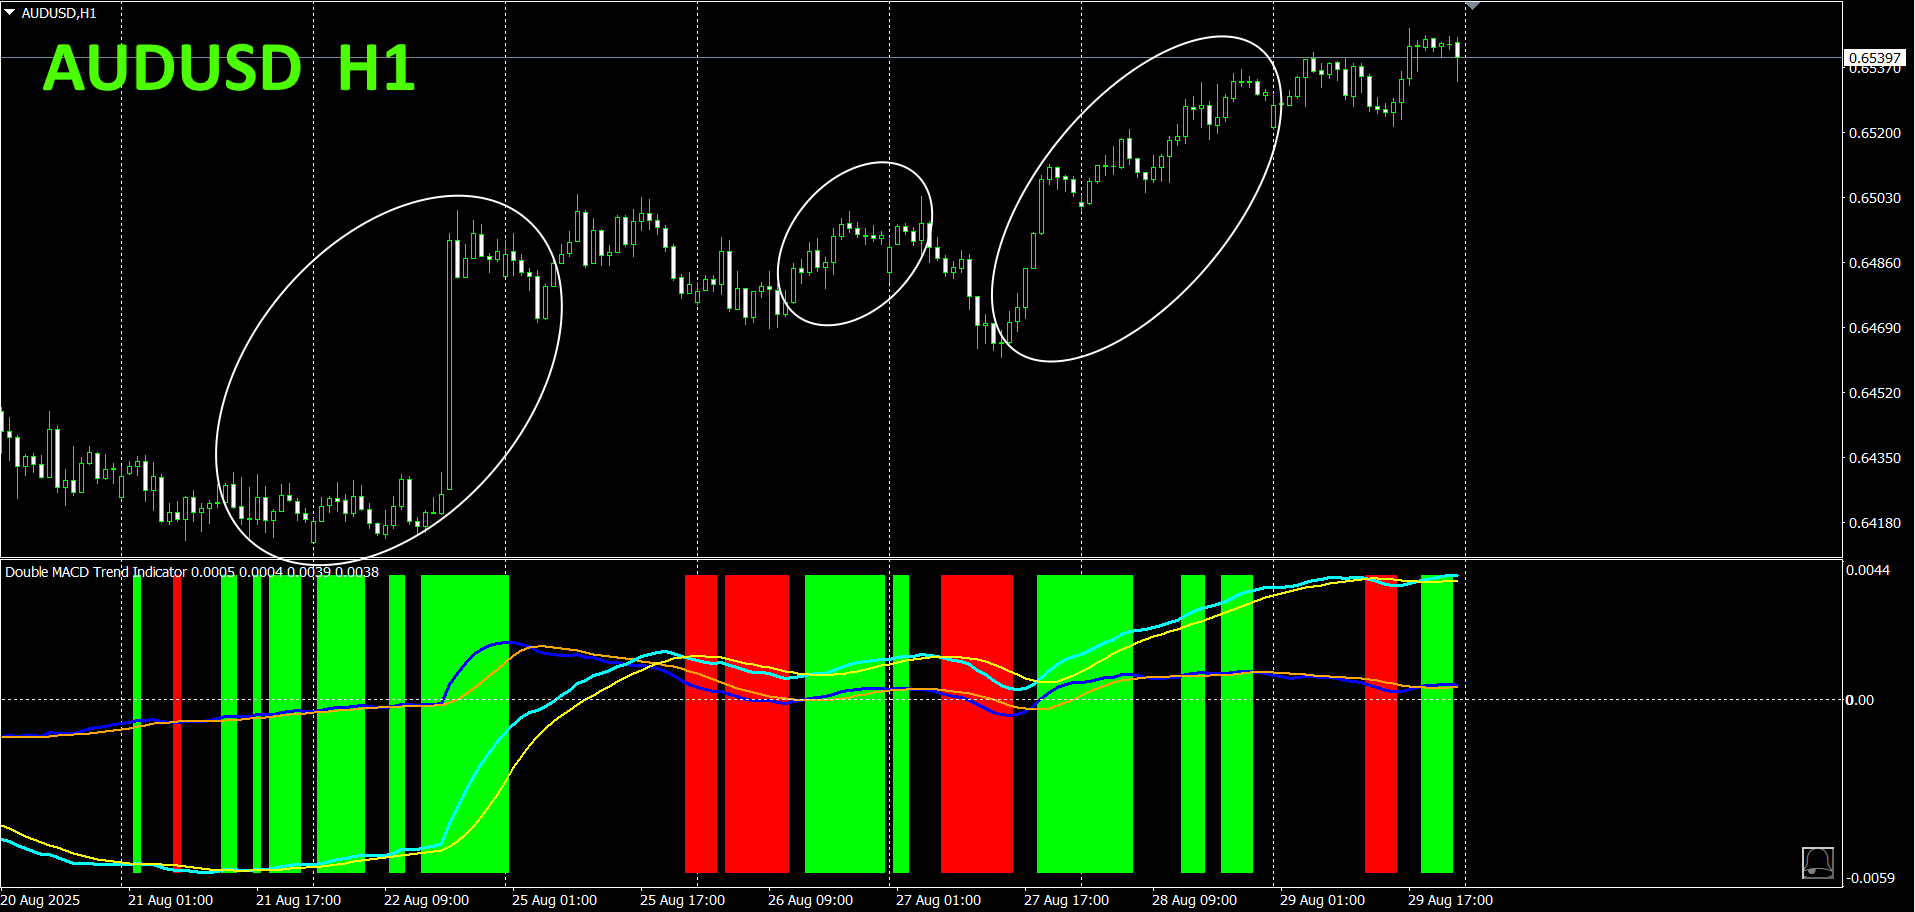
With “Dual_MACD_Trend_Indicator, simply follow the rule: buy in the green zone, sell in the red zone, and do not trade in other zones.
UsingDual_MACD_Trend_Indicator eliminates any hesitation about trade direction.
5.
“Hyper-CSW” has been released
“Hyper-CSW” is a high-performance indicator that visualizes the strength of the eight major currencies at a glance. It records the strongest currency and score for the current timeframe, enabling precise assessment of trend persistence and turning points. In addition, multi-timeframe analysis is supported, showing currency strength rankings (top444 currencies) across multiple timeframes such as, M15, H1, H4, D1, and W1 with scores. With clear color lines and a separate window, it gives you strong capability to assess market flow.
For details, see the following link.
https://www.gogojungle.co.jp/tools/indicators/65082
※ Recommended indicators
“Toretore Indicator”
https://www.gogojungle.co.jp/tools/indicators/50115
“TrendLine-EX”


https://www.gogojungle.co.jp/tools/indicators/42257
“8C Currency Strength Visualization Indicator” please refer to the following page.

MT4 version https://www.gogojungle.co.jp/tools/indicators/39150
MT5 version https://www.gogojungle.co.jp/tools/indicators/39159
【My currently listed products】


