

【雲海UNKAI】Don't take signs at face value; grasp the flow. August 27 GOLD 1-minute chart observation
Yun-kai UNKAI About
【 UNKAI 】The light that colors white clouds

UNKAI (UNKAI)─An auxiliary tool that takes your method to the next level
⸻
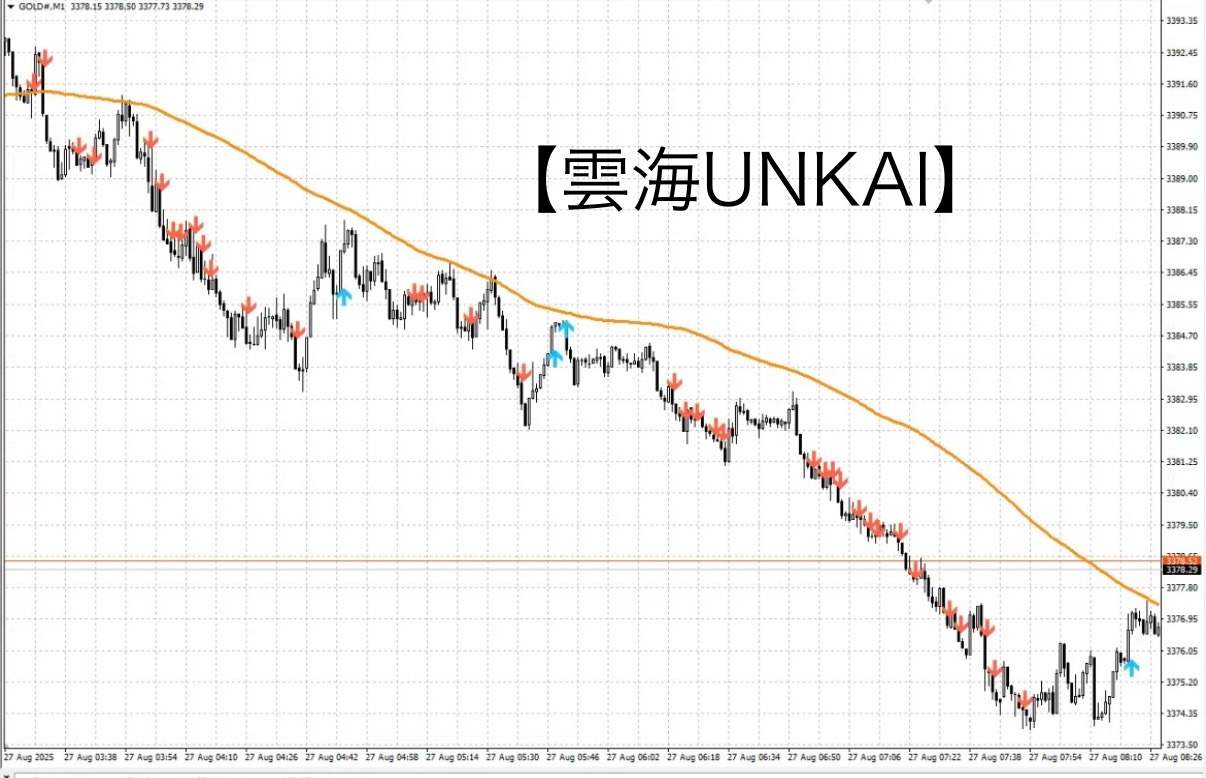
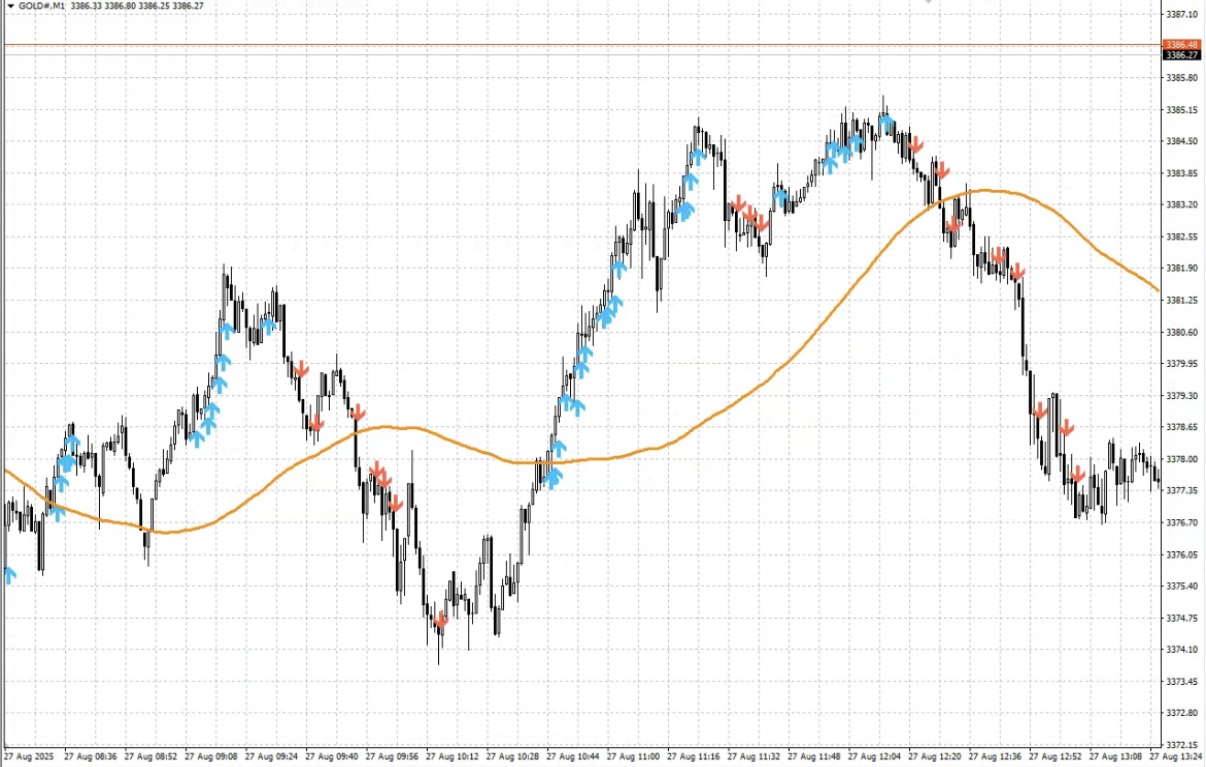
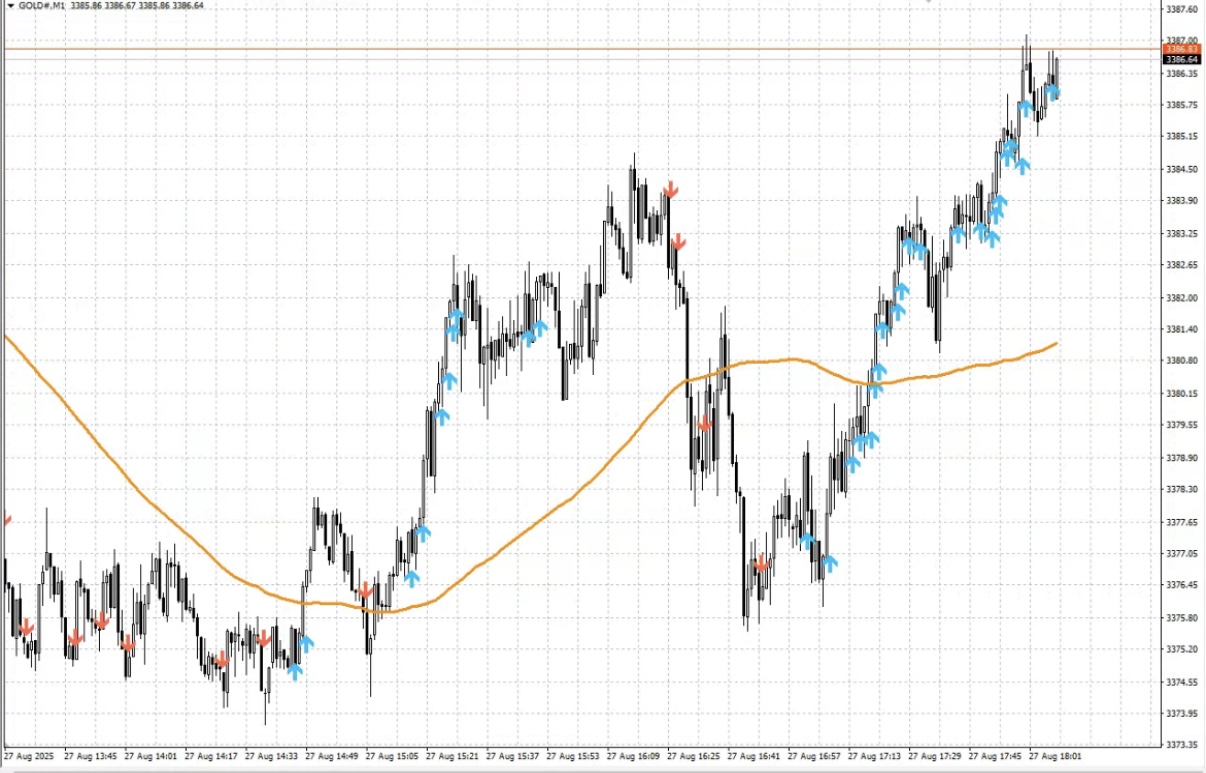
We will introduce the application of “UNKAI” to GOLD 1-minute chart from 9:00 to around 17:00 on August 27.
※Display only 100SMA
UNKAI × Compatibility with rules
UNKAI is not an entry tool that relies on signals
「an auxiliary indicator that reflects market flow」.
It demonstrates its true value when used in combination with rules and logic rather than standalone.
For example
• Trend-following rulesWhen used together, the blue arrows (upward momentum) and red arrows (downward momentum) of UNKAI serve as a “directional confirmation boost,” making it easier to avoid unnecessary counter-trend trades.This helps avoid pointless counter-trend entries.
• Rules using zones or linesWhen combined, you can simply judge whether it’s a good setup to enter after confirming the momentum of the arrows once the zone is reached.This helps determine if this is a place to enter or not.
• Logic emphasizing small loss, large gainIn such cases, trading in moments when the arrows consecutively appear makes it easier to select “only ride when it’s expanding.””
UNKAI is not intended for entry-by-signal usage.
Rather, relying only on signals increases the risk of“buying at a high/high-priced” and “selling at a low/low-priced.”]
UNKAI’s role is to visually reflect the market flow.
• When the number of blue arrows above increases, it indicates “the upward force is strengthening.”
• When the number of red arrows below increases, it indicates “the downward force is strengthening.”
It is designed so you can intuitively sense these momentum directions.
UNKAI is not a tool that directly tells you exact entries.
Designed as a tool for “confirming the flow.”
We have summarized its signals in a short video, please take a look.
⸻
■ How signals work
•
When the preceding bar is confirmed, momentum is judged, and an arrow appears at the opening price of the next bar.
• Blue arrow (up arrow):Displayed when the preceding momentum is upward
• Red arrow (down arrow)Displayed when the preceding momentum is downward
If the blue-arrowed bar is a bullish candle, it means “the price range was captured.”
If the red-arrowed bar is a bearish candle, it visualizes that profit could have been taken in the downtrend.
• No repaint
Once a signal appears, it does not disappear. It remains even if the price moves against you, making it convenient for backtesting and verification.
• Notification features
⸻
■ Practical image of usage
• To confirm flow and decide according to your own rules
• Do not take signals at face value, but understand how the relative strength of upward and downward momentum changes as material for assessment
• Use it for retrospective chart testing
UNKAI does not directly teach you “how to win,” but rather serves as a tool to reinforce your own methods and rules.
⸻
■ Cautions
UNKAI is not intended for standalone use.
Trading purely according to its signals is not recommended.
Always use it in combination with your own rules or method.
UNKAI UNKAI Here

eBooks,Introduction to the Sky's Cleft
Breakout strategies driven by EA
“The Sky's Gap” is a simple strategy where entry is automated by an EA, and traders focus only on monitoring after entry and executing exit rules.
The EA constantly monitors the chart and can seize the moment of breakout accurately.
This eliminates the stress of staying glued to the screen before entry and the anxiety of missing the right timing.
An additional filter like ADX, ATR, SMA, etc. is also included.
As a purchaser benefit, you will be able to use this EA.
The main page for The Sky's Gap

Why publish negative results?
Investing Navi+ deliberately publishes negative results without hiding them.
The reason is that “trading cannot always be profitable.”
Rather, by recording losses you can analyze what situations cause losses and make the logic more robust.
Instead of obsessing over each win or loss,
Over a span of a week or a month, having a total positive result is what matters most“total net profit” is what matters.
• “Today I’m glad I won”
• “Today I lost, so I’m uneasy”
To eliminate these emotional swings, let the EA handle entries, and have humans focus on executing rules for exits.
“I want to win” vs “I want to earn”──This mindset is the foundation for long-term profitability.
Stability gained by following the rules
The common point among traders who incur big losses is the“desire to win”drives rule-breaking
For example, delaying a decision to exit to push for more gains can wipe out profits quickly.
The Sky's Gap is
• Entry is fully automated by the EA
• Exits are governed by fixed, rule-based conditions
This reduces human intervention and eliminates hesitation.
By mechanically following the rules, win rate and risk-reward naturally stabilize.
⸻
There are countless techniques in technical analysis, such as moving averages, RSI, MACD, Stochastic, Parabolic SAR, ADX, ATR, CCI, trendlines and channels, Fibonacci retracements and expansions, Ichimoku, volume indicators, and support/resistance lines.
There is no single correct method; what matters isdeciding on one own rule you believe in and actually testing it repeatedly. By doing so, you gain the confidence that can withstand market realities and an expectation that builds over time and.
⸻
We will test with the “maximum profit” type rules on The Sky's Gap,
and there are times when break-even exits occur, but by keeping the rules, you can calmly seize the next opportunity.
Even in situations where you could have taken more, if you exit at break-even according to the rules, you end up with a net positive overall, which is the strength of this strategy.
In trading, the important thing is not “win rate” but “reproducibility”“Repeatability”
Many traders care about win rate, but
even with a win rate of 50%, if the risk-reward is favorable, your capital can grow.
What matters is having a rule that yields the same result no matter who uses it—a reproducible rule.
The Sky's Gap is
•EA entry → mechanical stop-out → rule-based take profit
By performing this sequence with zero emotion, you build trading as a “business.”
⸻
Strategy aimed at overall profit
Focusing on daily wins and losses is risky.
For example, if you look at weekly or monthly totals, even with a few negative days, as long as the total is positive, it’s OK.
EA, being emotionless, is ideal for long-term capital management.
Operating the rules with the mindset of “earn” rather than “win” helps the capital curve to be more stable.
If you are interested in The Sky's Gap / UNKAI, you can join the online community
Join the online community here

Within the online community, specific trading logic cannot be explained, but you can participate in a “chart critique community” that utilizes The Sky's Gap.
To those who are interested in The Sky's Gap
Build a foundation to judge rules without hesitation in short-term trading—that is the basic philosophy of The Sky's Gap.

Free materials here:
In ‘Path to the Gap,’ you will learn in what situations you can actually trade?
We explain the decision criteria more clearly.
On the sales page for The Sky's Gap alone, it couldn’t fully convey everything,
also covering concrete entry points and zone selection in detail with diagrams and case studies.
Even beginners can reproduce it easily, so if you’re interested, please also use that.
If you’re interested, first receive the free material ‘Path to the Gap.’
From there, your step into the Gap begins.
“Should I enter this chart?”
When in doubt,it is hoped to be a hint to switch to thinking “judge by rules, not by feel.”