
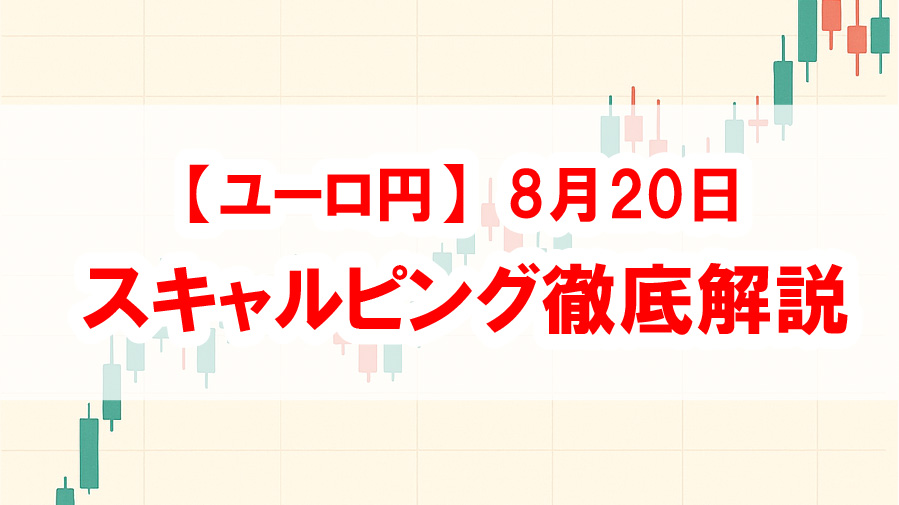
[Learn in 5 minutes: Scalping] August 20, 2025 – Euro-Yen recap
This time, we will review the Euro/Japanese Yen scalping trade on August 15, 2025.
I will explain as simply as possible the tools I actually use and my trading philosophy, so please use it as a reference.
※ Details about the tools used and specific settings are introduced at the end of the article
Trading Environment
・Currency pair: Euro/Japanese Yen
・Applied timeframe: Applied to a 1-minute chart
※Why the tool is applied to a 1-minute chart?
→ By using the 1-minute chart, you can enter more quickly in the initial movement of a pullback. Using a 5-minute chart is OK, but there are cases where the entry is too late (as a downside, entering at the initial movement increases the chance of being stopped out; in that case, we handle it with staggered entries).
Today's Trade Review
1. Market Environment Check
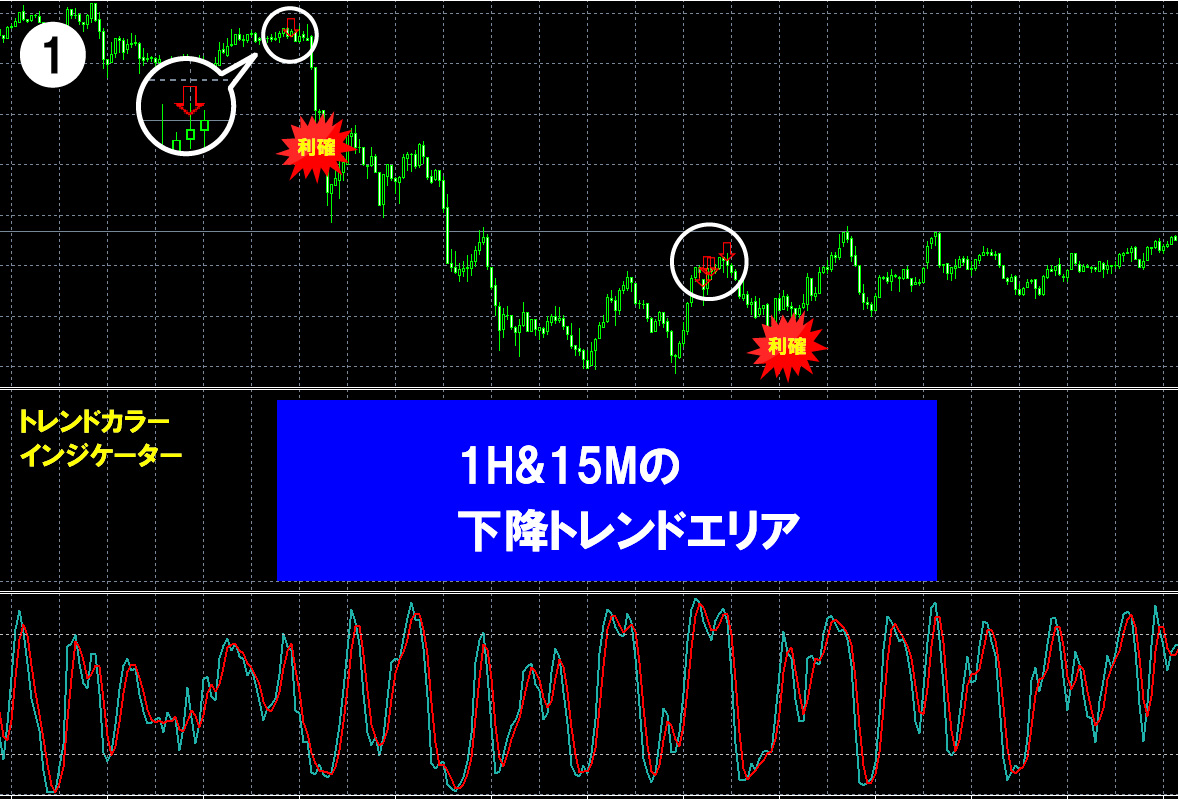

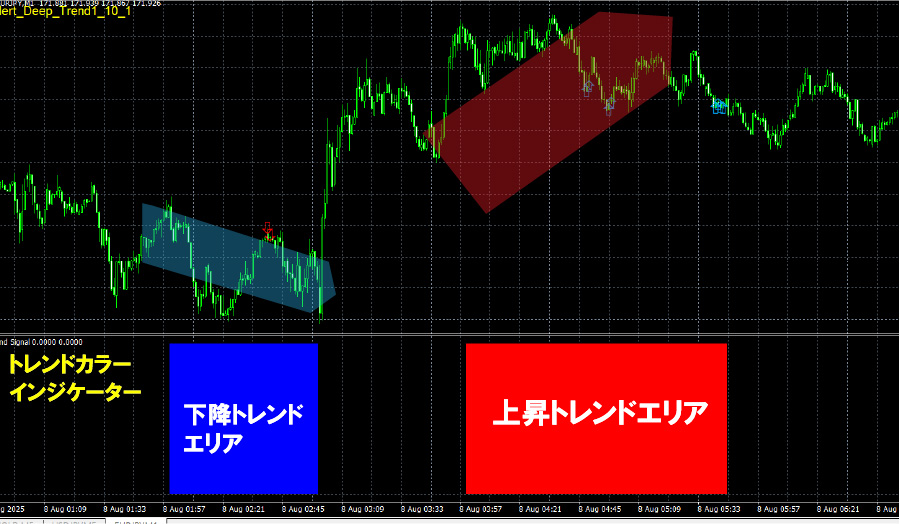
First, wait for the sub-window’s “trend color” to appear.
Today, in EURJPY, blue is displayed, indicating that a medium- to long-term downtrend is persistently occurring.
2. Basic Entry and Take Profit
Once the market trend is understood, enter on the 1-minute chart following the signal from “Find deep pullbacks in the trend,” then proceed with entries.
Profit taking (take profit) should not be greedy1–10 pipsof profit, then quickly close the position (scalping).
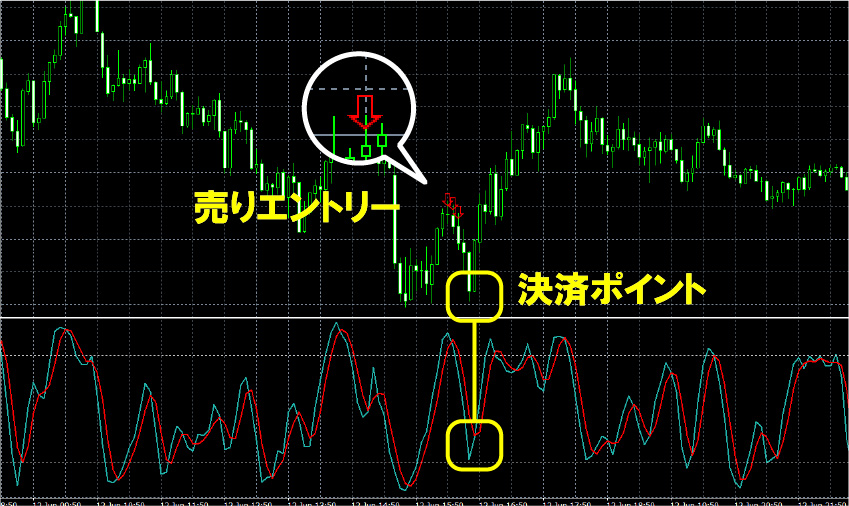
To time the exit, as in the example image below,Stochasticis convenient to use. When it reaches overbought/oversold levels, exit automatically (example ↓↓)
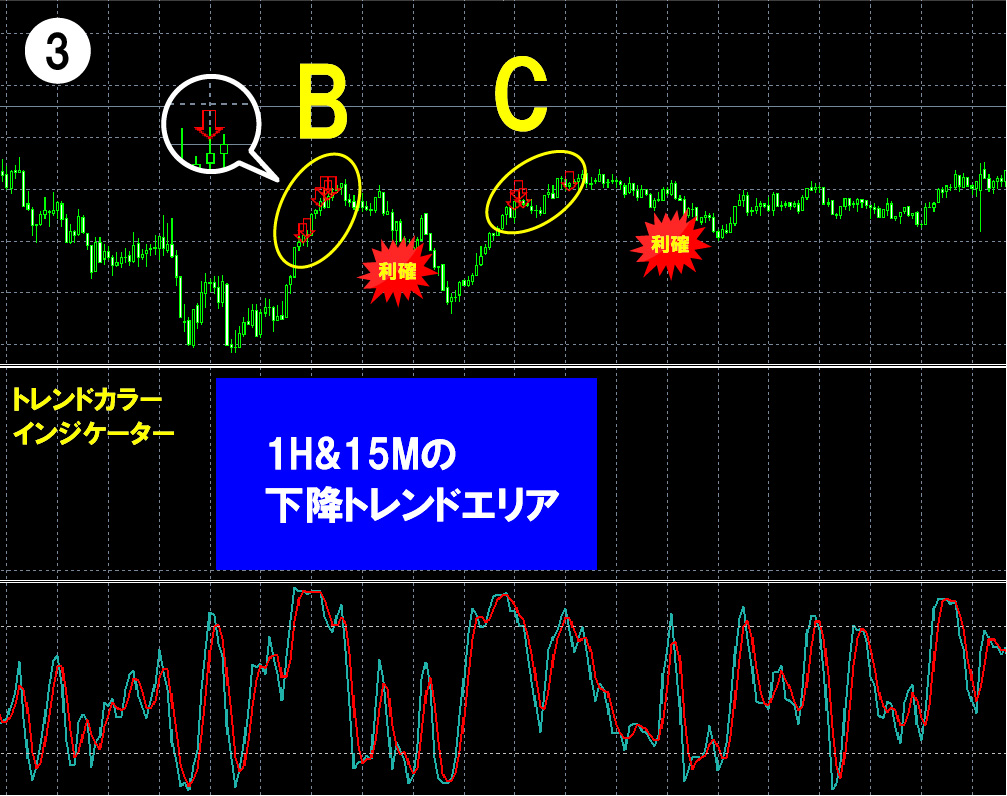
3. What to Do When There Is a Floating Loss
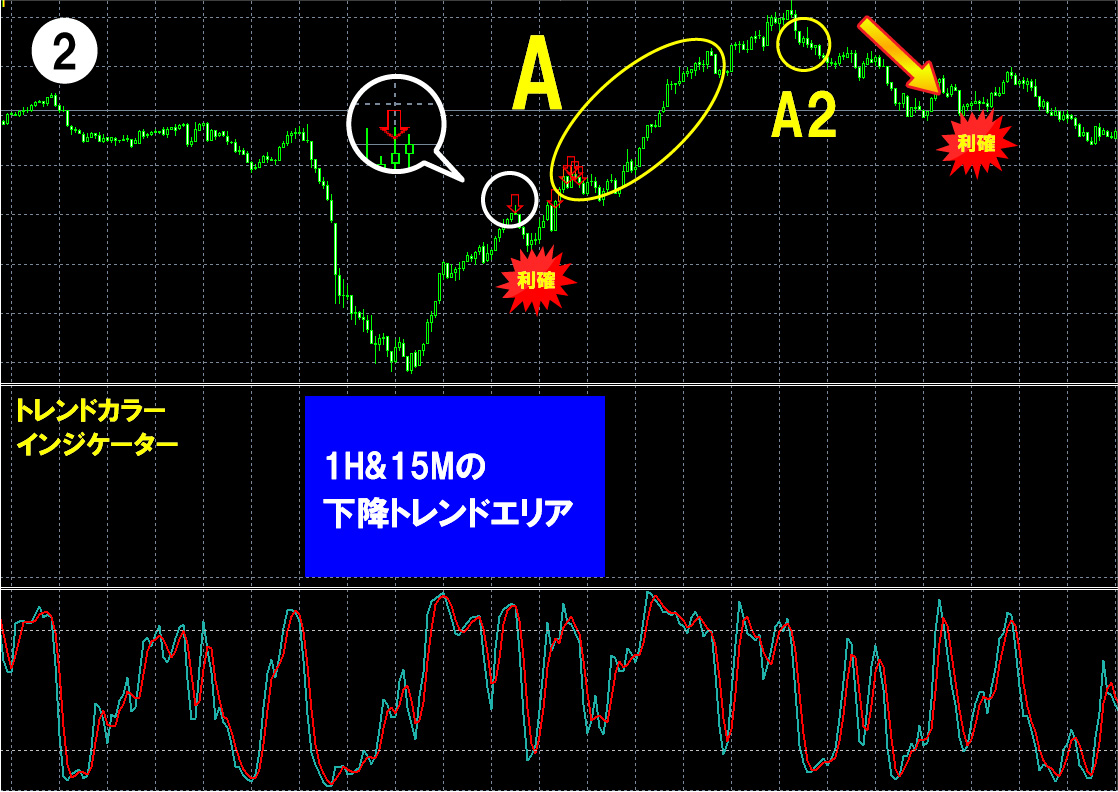
In the image at point A in the above step ②, if the short entry is made and the stochastic exit is delayed, you can get caught significantly.
In such a situation, do not endure the loss forever; cut it as early as possible.
This time, I personally had a delayed exit and ended up with a floating loss, so I used a stop-loss order in the trading app (automatic stop loss).
Furthermore, after reducing the position to zero, I re-entered at point A2 (when it fell more noticeably) with double the lot size.
The reason for re-entering with double the lot size is that if prices rise from there without any pullback, a strong reversal is expected (the downtrend on higher timeframes also serves as justification).
※ The method of increasing entry lots geometrically from 1x to 2x is called martingale. It is generally high risk, so substantial practice and reliable stop losses are required to use it.
This time, as predicted, it fell substantially, so I could recoup the initial loss (break-even exit).
A caution for this exit method is that you must never use it against higher-timeframe trends.
If you trade counter to the higher-timeframe trend, there is a high chance there will be no rebound and you’ll simply end with a loss cut.
Therefore, always confirm the higher-timeframe trend, and practice first on a demo account (the martingale method carries substantial risk, but also notable advantages. Personally, I think it depends on how you use it).
Summary
Today, after entry, I got caught and the position went into a loss-cut scenario, but personally I learned a lot and it was a very educational trade.
Experiencing more of these “loss-cut” market conditions will be important for a trader to improve skills.
However, since martingale is quite high-risk, do not force its use and be sure to practice on a demo account!
With that said
【Announcement】
To improve trade reproducibility, I will publish the tools and their settings that I use in this article.
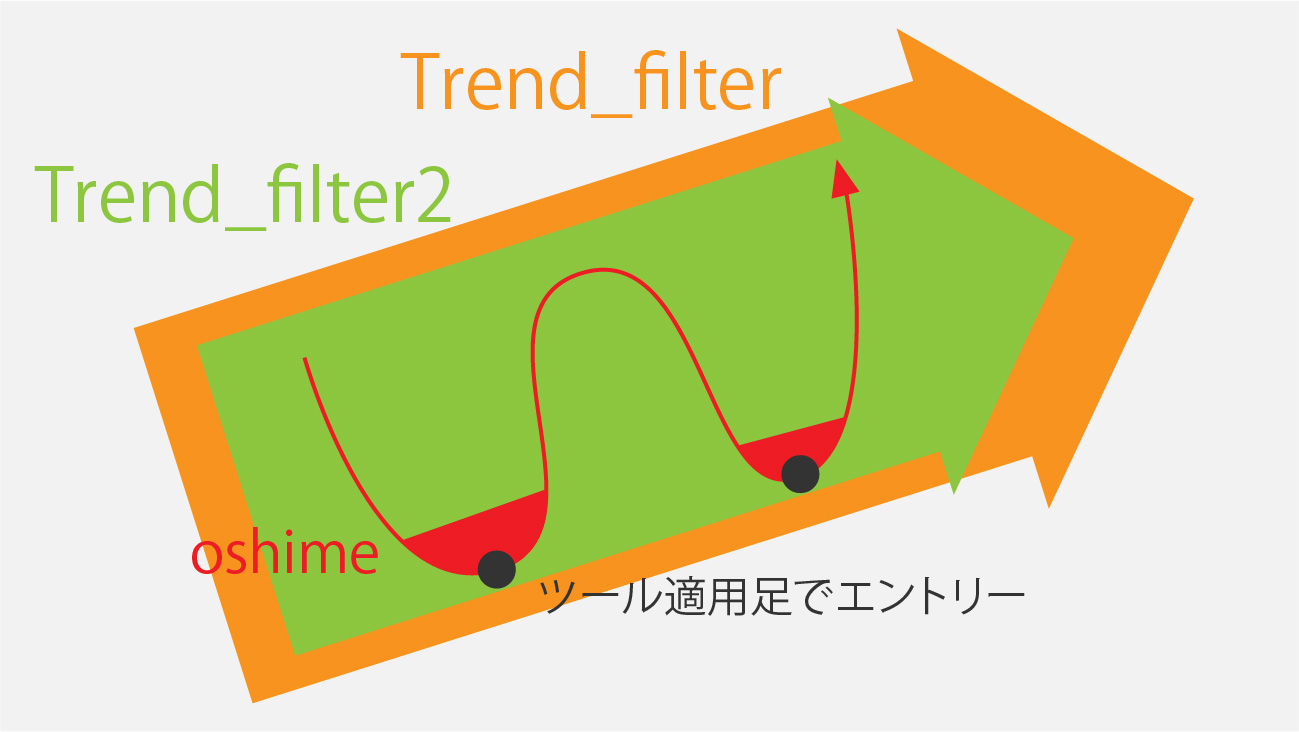
①Find deep pullbacks in the trend
An indicator that, on higher timeframes, signals a pullback when a pullback occurs on the lower timeframe in the direction of the trend.
【Parameter Settings】
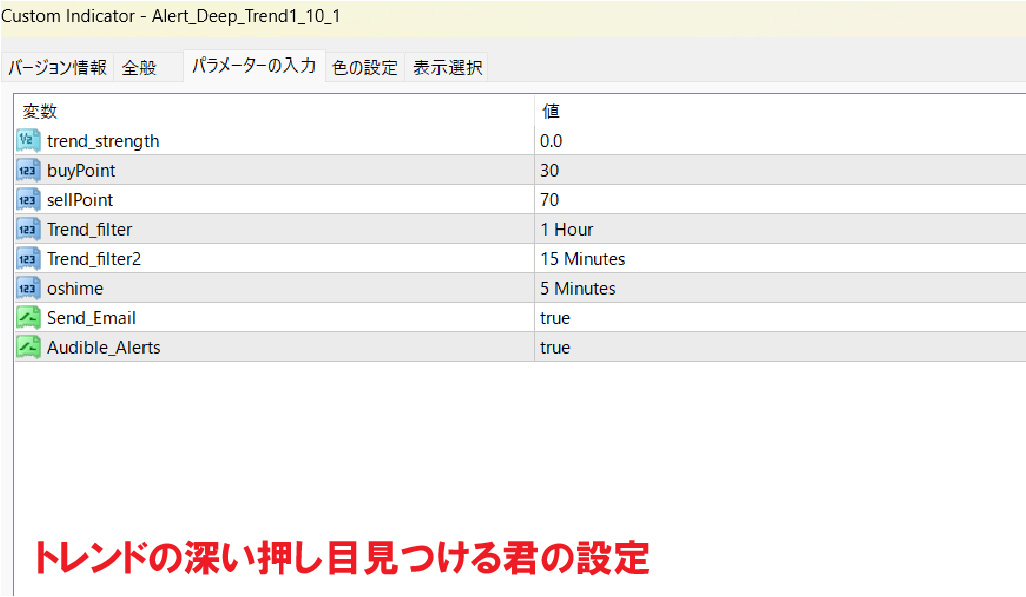
Set Trend_filter to 1 hour and Trend_filter2 to 15 minutes toconfirm the direction of the medium- to long-term trend.
Then set oshime to 5 minutes to capture short-term pullbacks (5M) occurring within the higher-timeframe trend (1H & 15M).
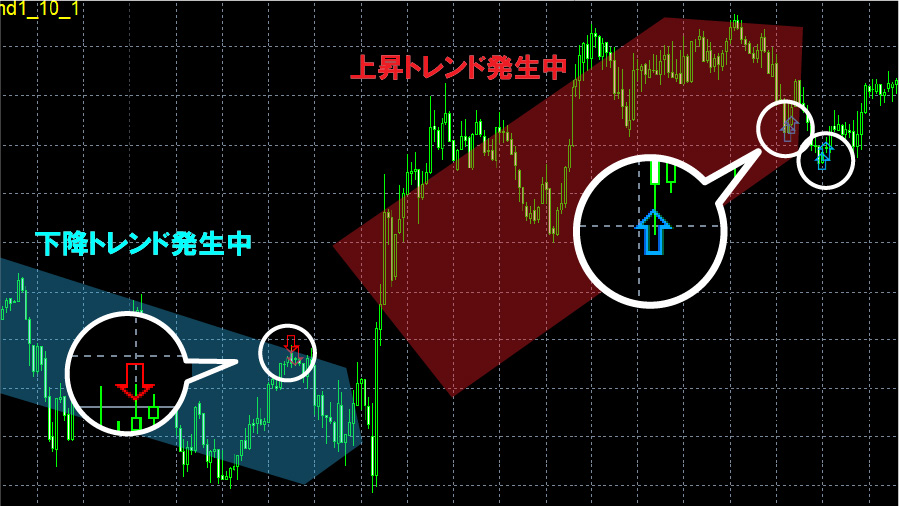
② Trend Color (preparing for release)
An indicator that shows in the sub-window with colors whether the current market is in an uptrend or downtrend.

【Parameter Settings】
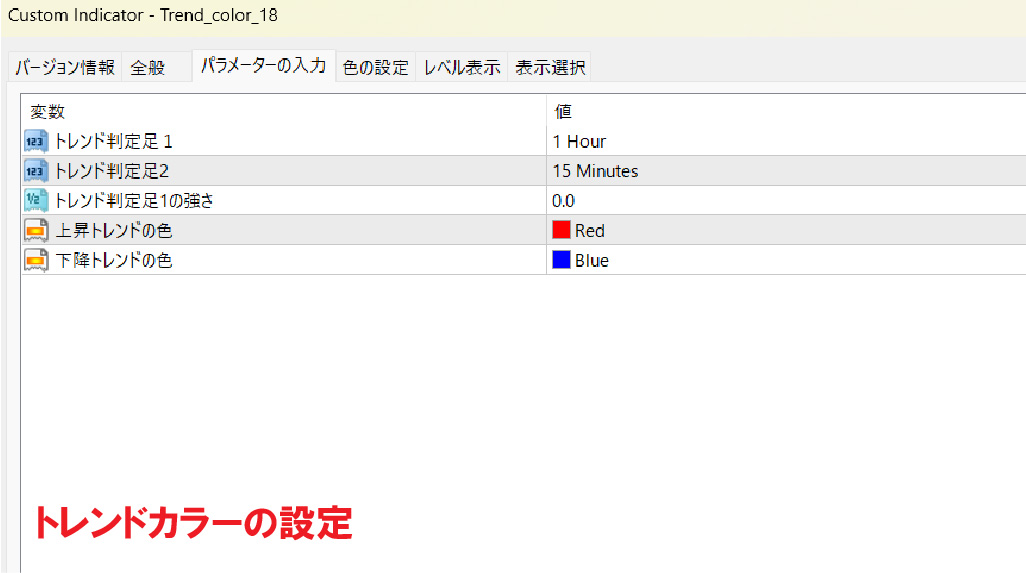
This indicator has a similar concept to “Find deep pullbacks in the trend.” When the directions of the 1-hour and 15-minute timeframes align, a trend is considered to be present.
Unlike the first indicator, this one provides a visual grasp of the trend, making it easier to prepare for entries.
Please use it as a reference for trading.