

10x capital in 10 years! A steady day-trading EA that masters anomalies
Thank you for taking a look.
This articleabout 180x funding in 10 years! A steady day-trading EA that masters anomalieswill be introduced!
A Reliable Day-Trading EA that Leverages the Regularity of Anomalies
~ Targeting the patterns by day of the week ~
In the world of investment there exists what is called “Anomaly,”patterns of price movement that repeat on certain days of the week, end/beginning of month, etc.This is not mere coincidence;it stems from the behavior of market participants and the habits of economic activity.For example:
-
Monday: Investors tend to pause at the start of the week, liquidity is low, and price movement tends to be biased. In particular, overseas participants adjust positions in response to weekend news, making movement in a specific direction more likely.
-
Tuesday: A reversal or retracement is likely after Monday’s movement. Positions created earlier in the week tend to unwind.
-
Wednesday: In the middle of the week, institutional investors tend to increase positions, and trends tend to follow more straightforwardly.
-
Thursday: With weekend in mind, institutions begin adjusting positions. In a downtrend they may sit out, while in an uptrend buying pressure tends to rise.
-
Friday: Risk-off and profit-taking selling can occur as the weekend approaches. In particular, overseas markets tend to have stronger selling pressure to avoid holding risk overnight.
-
End of month: Due to corporate earnings and fund rebalancing, there is a tendency for real demand to buy dollars. In particular, dollar conversion by Japanese exporters can influence the market.
-
Beginning of month: Institutions often inject new funds, increasing the likelihood of a breakout and trend formation.
Thus, anomalies are**patterns rooted in economic activity and investor psychology that repeat**and are supported by historical statistical data.
Some readers may be unfamiliar with anomaly trading, so here is a summary of the technical specifications (Bollinger Bands, RSI, moving averages, etc.) and how it differs from traditional technical trading.
| Anomaly Trading | Technical Indicator Trading | |
| Advantages | Based on economic activity and investor psychology, using patterns that tend to repeat Simple entry conditions that are easy to follow Less influenced by news or temporary fluctuations Trading on fixed days/times allows for planned capital management |
RSI, MACD, moving averages, etc.Can combine a wide range of indicators for refined analysis and real-time detection of trends and reversals can be done Can adapt to various market conditions (range, trend) With detailed parameter adjustmentshigh customization |
| Disadvantages | Trades only at fixed timesopportunity lossis possible Anomalies can break down temporarily and cause drawdowns In strong trending markets, anomaly may not work |
Parameter tuning is difficult,overfitting riskrisk Many false signals due to indicator lag As indicators increase, complexity rises and discretion becomes more influential There is a potential to ignore signals due to emotions |
EA Buy/Sell Rules
This EA codifies these market factors and trades automatically.
-
Monday 2:00→ Buy entry
-
Tuesday 12:00→ If the previous day was in a downtrend, sell; otherwise buy
-
Wednesday 12:00→ Follow the trend direction (long in uptrend)
-
Thursday 9:00→ Buy if rising; skip in downward trend
-
Friday 4:00→ Sell entry
-
End of month 10:00→ Prioritize buying in anticipation of dollar demand from earnings factors
-
Beginning of month→ Detect breakouts; buy if up, sell if down
Also, all positions areclosed by 22:00 on the same dayto ensure risk management without carrying positions to the next day.
※The above times are MT4 times and reflect optimization results for USD/JPY.
Practical Operation Image & Results
-
Monday: place buy trades during periods of low liquidity
-
Tuesday: reversal entries in the opposite direction of the previous day
-
Wednesday & Thursday: solid entries leveraging the trend
-
Friday: short entries aiming at weekend selling pressure
※End of month and beginning of month logic incorporates real demand flow
Past 10 years of trading results
Detailed profit/loss (how much was earned in that year)
Year 2015 Profit: 701346 yen
Year 2016 Profit: 884158 yen
Year 2017 Profit: 775666 yen
Year 2018 Profit: -138996 yen
Year 2019 Profit: -732790 yen
Year 2020 Profit: 5314916 yen
Year 2021 Profit: -1265403 yen
Year 2022 Profit: 15714914 yen
Year 2023 Profit: 4959608 yen
Year 2024 Profit: 54946735 yen
Year 2025 Profit: 5252000 yen (through August)
Total net profit: about 80,000,000 yen
Weekly trading win rate
The following are weekday win rates from 2015 through August 2025.
Monday: Win rate = 65.78% (wins: 248 / total: 377)
Tuesday: Win rate = 58.25% (wins: 247 / total: 424)
Wednesday: Win rate = 55.56% (wins: 240 / total: 432)
Thursday: Win rate = 60.68% (wins: 142 / total: 234)
Friday: Win rate = 59.94% (wins: 199 / total: 332)
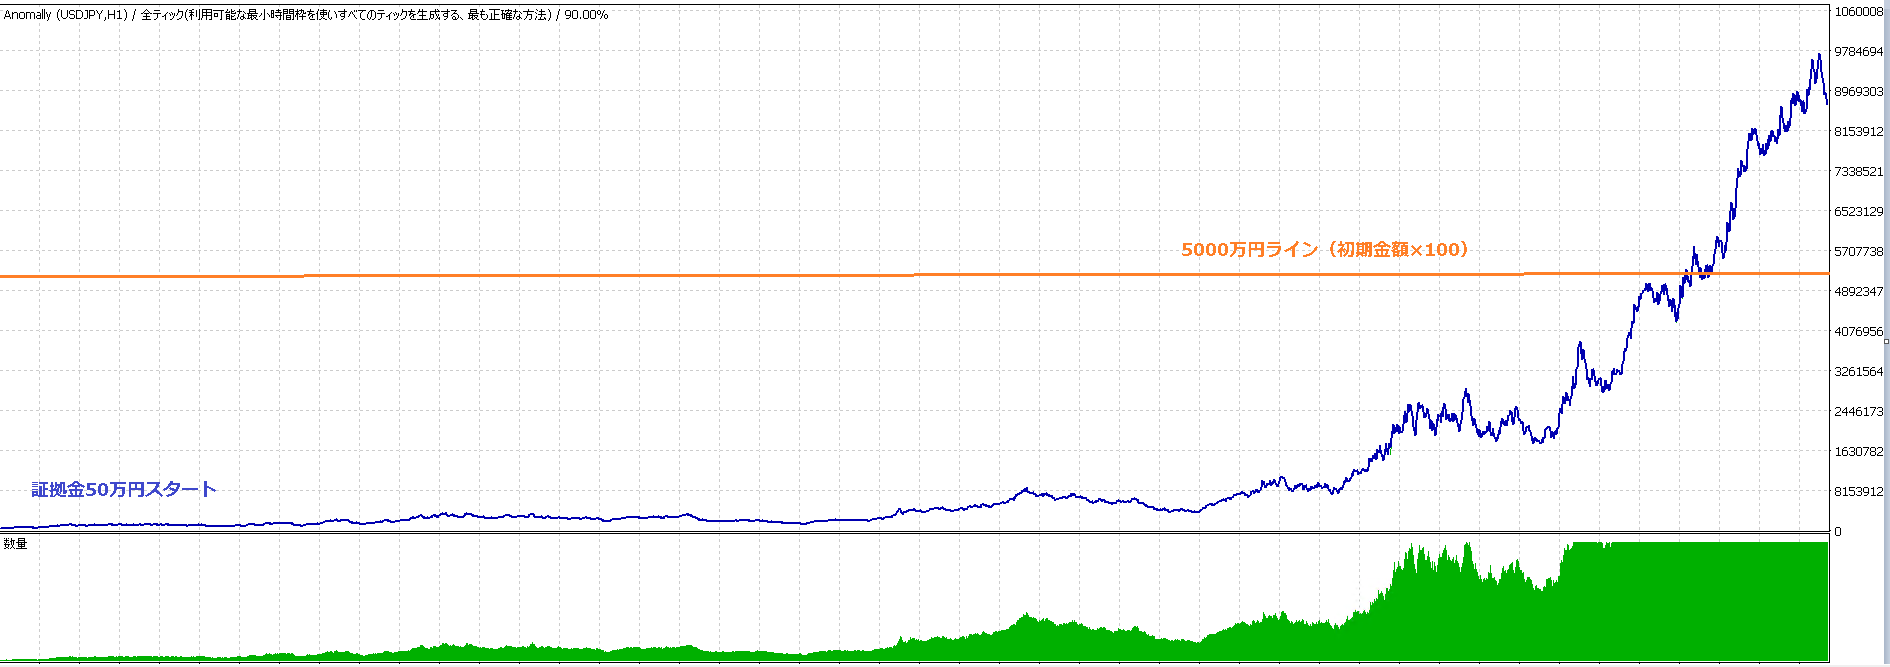

Actual Operation Video (Performance starting with 500,000 Yen margin from 2024)
Summary
This EA is based on the fact that the market repeats due to human behavior,faithfully reflecting weekday, end-of-month, and beginning-of-month patterns in trading.
-
Not relying solely on technicals;considers real demand flow and investor psychology
“Discretionary trading tends to be swayed by emotion... ”
“I want to use simple, consistent automatic trading logic.”
This is the perfect EA for those readers.
180x funding in 10 years! A steady day-trading EA that masters anomalies