

[Episode 93] Even with a win rate around 30%, the result is positive / A logic that “you can win even if you lose,” stacking +115 pips in one week
Will you include this chart?
【第93回】勝率3割台でも結果はプラス/1週間で+115pipsを積み上げた「Even if you lose, you can win」 logic
Acquired pips:+115pips
1 lot →Approximately166,700 yen
0.1 lot →Approximately +16,670円
⸻
August 18 (Mon) – August 22 (Fri), 5 days
5-day total results
• Total trades:96 trades
• Profit-taking successes:34 times
• Position adjustments:27 times
• Stop losses:35 times (all within −10 pips)
• Total acquired:+318 pips
• Total loss:−203 pips
• Net profit:+115 pips
• Win rate:35.4% (34 wins / 96 trades)
• PF (Profit Factor):1.56
Revenue (USD/JPY 145 rate)
• When operating 1 lot →+166,700円
• When operating 0.1 lot →+16,670円
This week, entries reacted according to the logic,and there were many situations where we could enter at good positions.
It was noticeable that trades flowed naturally with the rules and did not lose direction.
On the other hand, regarding settlements, there were many moments where profits were "浅めで終わる場面" (ended shallow),and moves that seemed to potentially extend profits were cut off early. This was the result of the zone-based settlement rules, andavoided a large drawdownbutthere were several missed, promising trades
⸻
Daily detail results
August 18 (Mon)
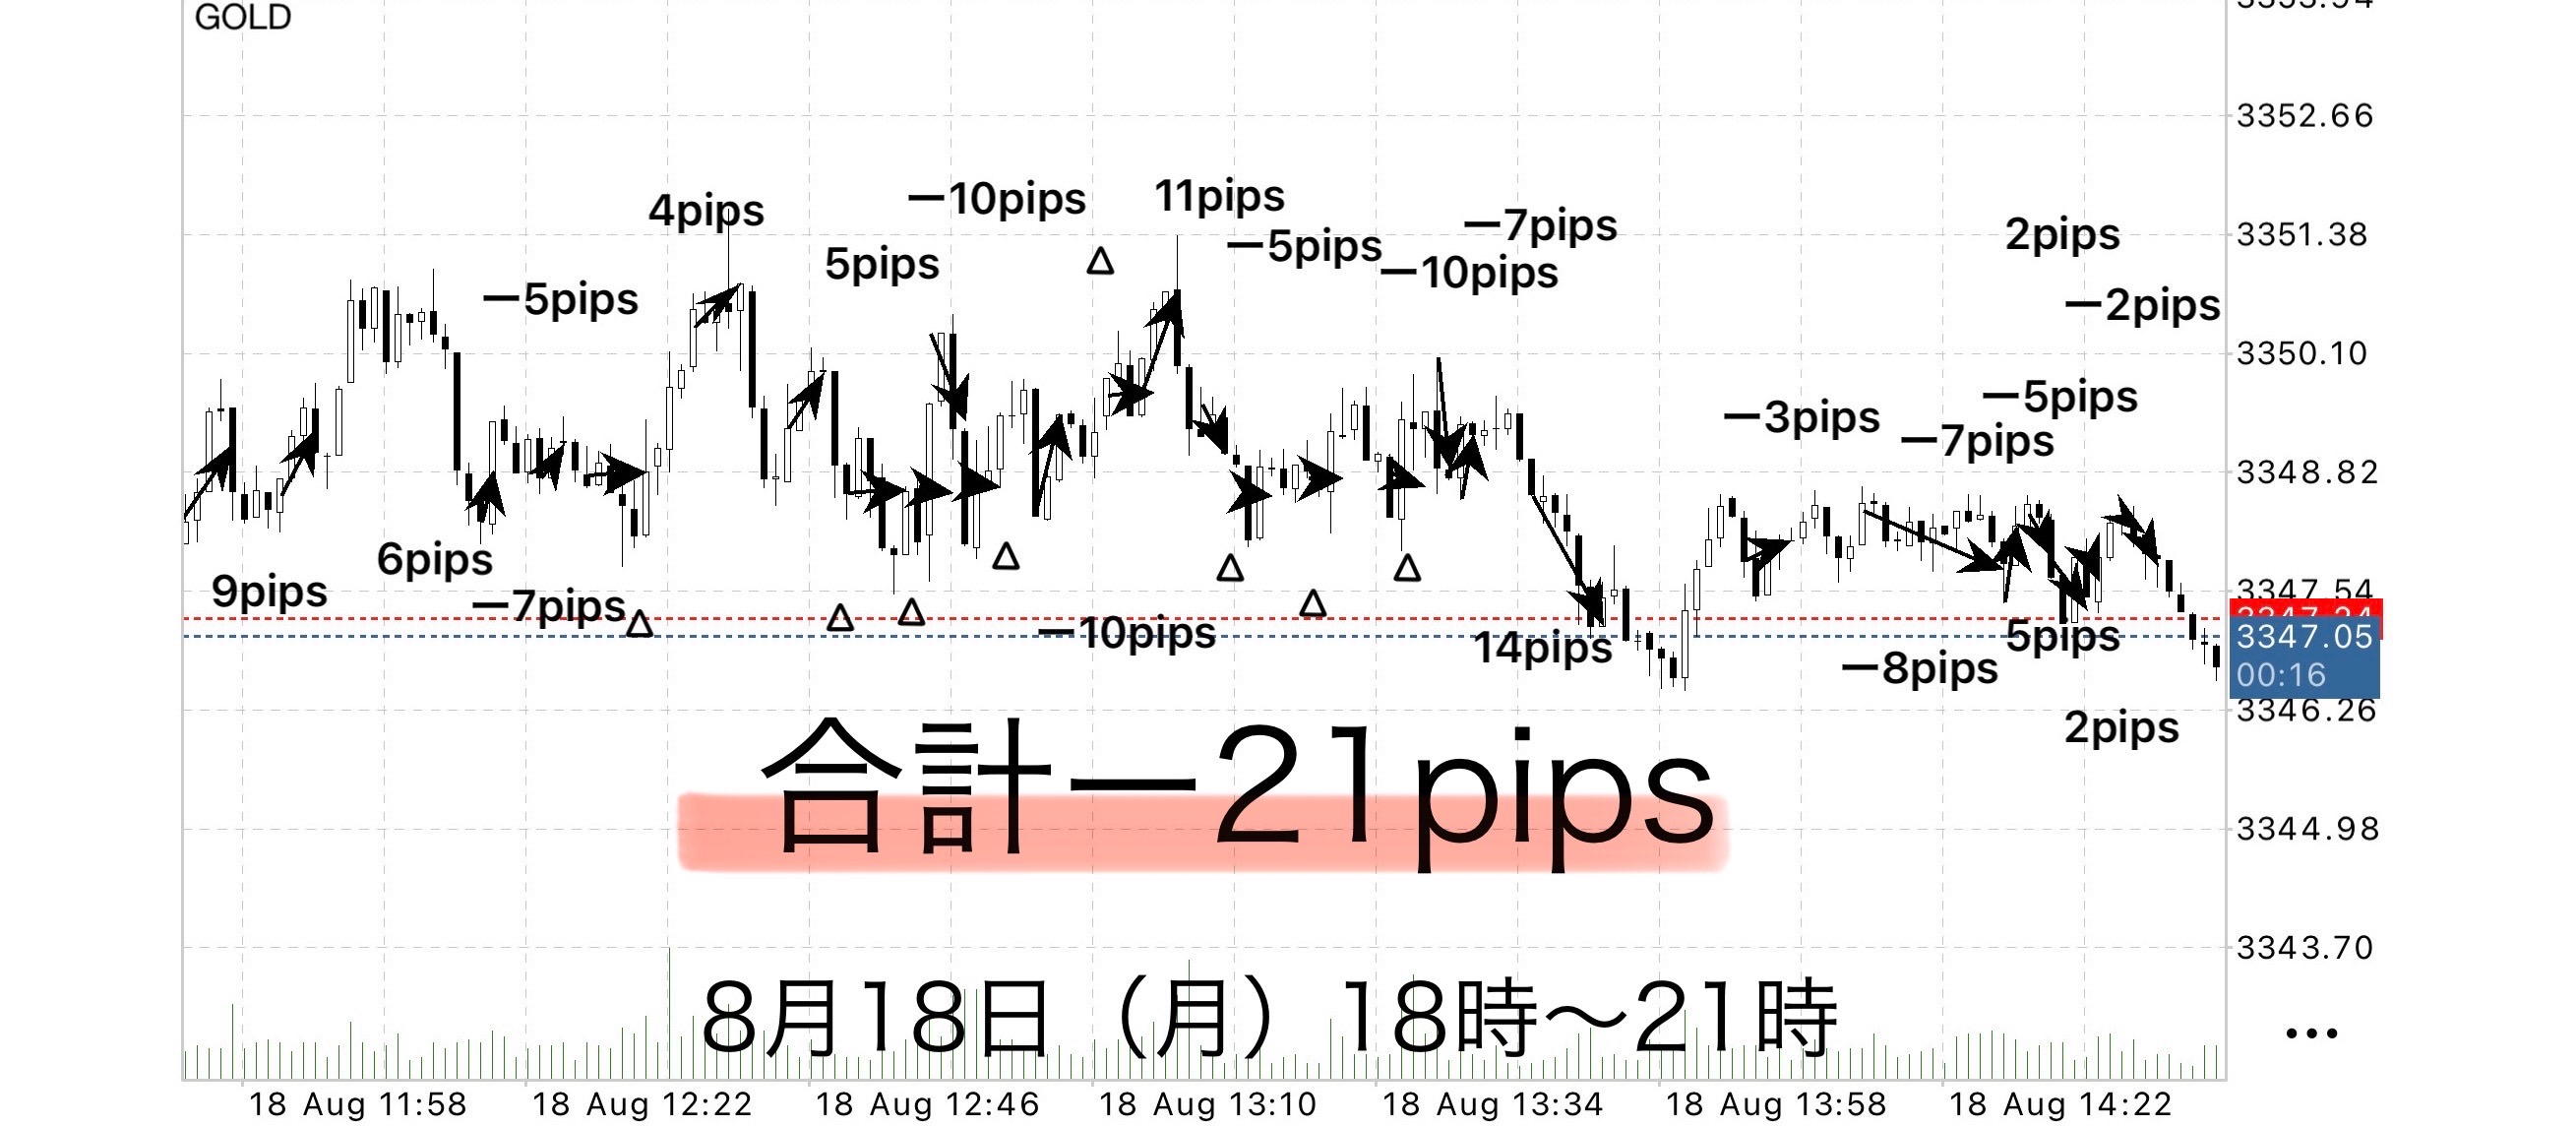
• Total trades: 29
• Profit-taking successes: 9
• Position settlements: 8
• Stop losses: 12 (all within −10 pips)
• Total acquired: +58 pips
• Total loss: −79 pips
• Net profit: −21 pips
• Win rate: 30% (9 wins / 22 trades)
• PF: 0.73
Points
Many stop losses, and ended negatively.
However, thanks to the fixed −10 pips rule, losses were kept small.
⸻
August 19 (Tue)
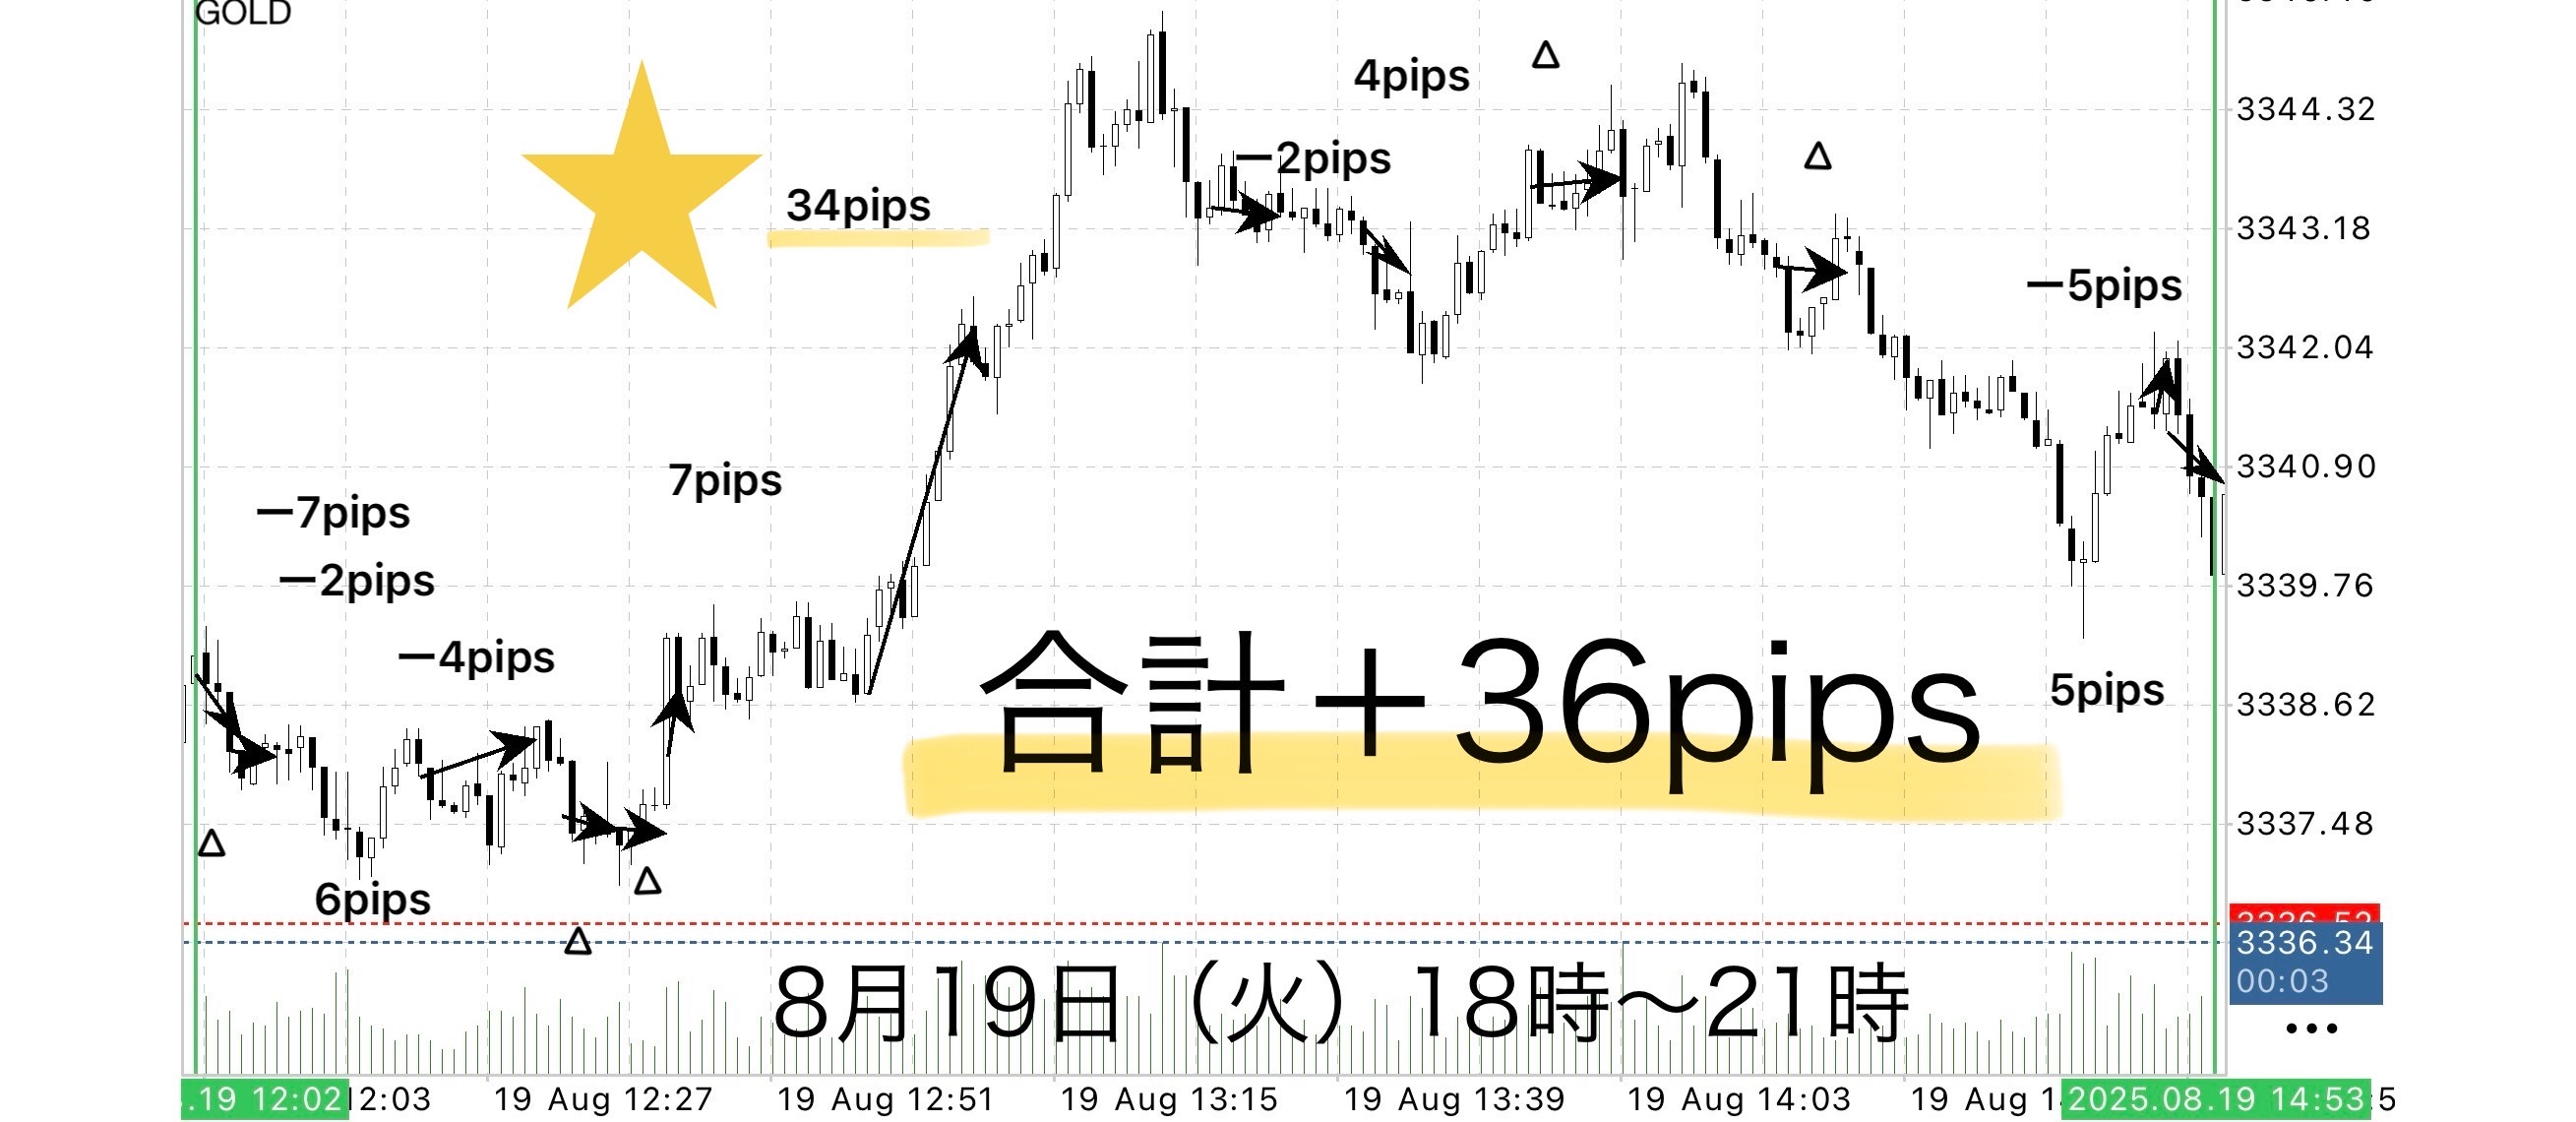
• Total trades: 15
• Profit-taking successes: 5
• Position settlements: 5
• Stop losses: 5 (all within −10 pips)
• Total acquired: +56 pips
• Total loss: −20 pips
• Net profit: +36 pips
• Win rate: about 33.3% (5 wins / 15)
• PF: 2.80
Points
Position management was effective, and profits could be realized while limiting risk
⸻
August 20 (Wed)
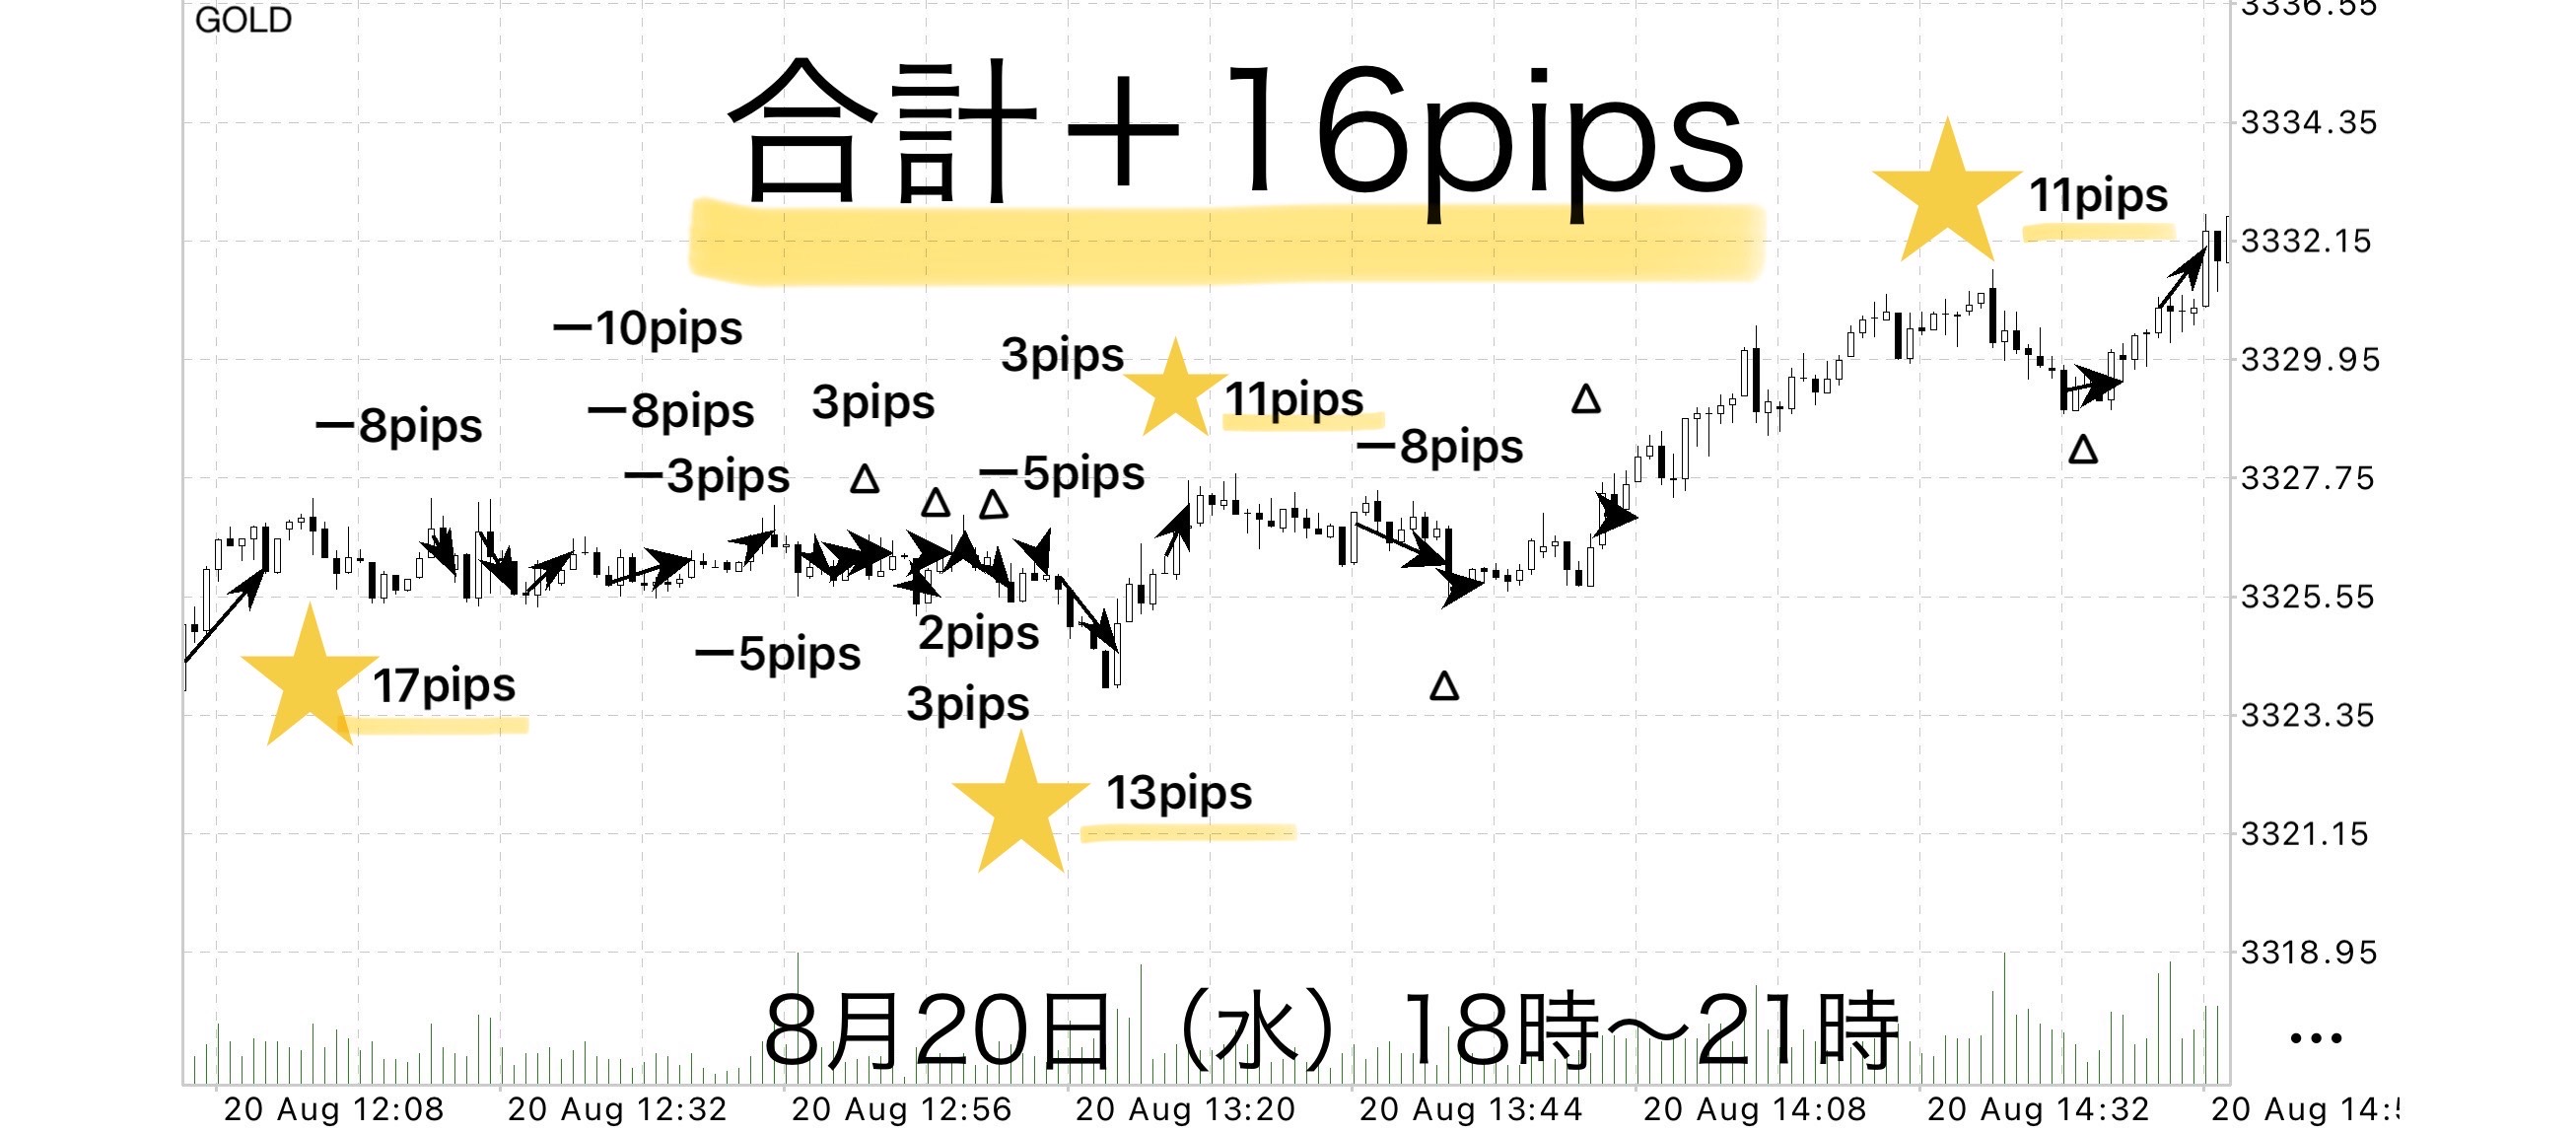
• Total trades: 21
• Profit-taking successes: 8
• Position settlements: 6
• Stop losses: 7 (all within −10 pips)
• Total acquired: +63 pips
• Total loss: −47 pips
•
•
•
Early profits were available, but later stalled.
Small but steady buildup maintainedthroughout.
⸻
August 21 (Thu)
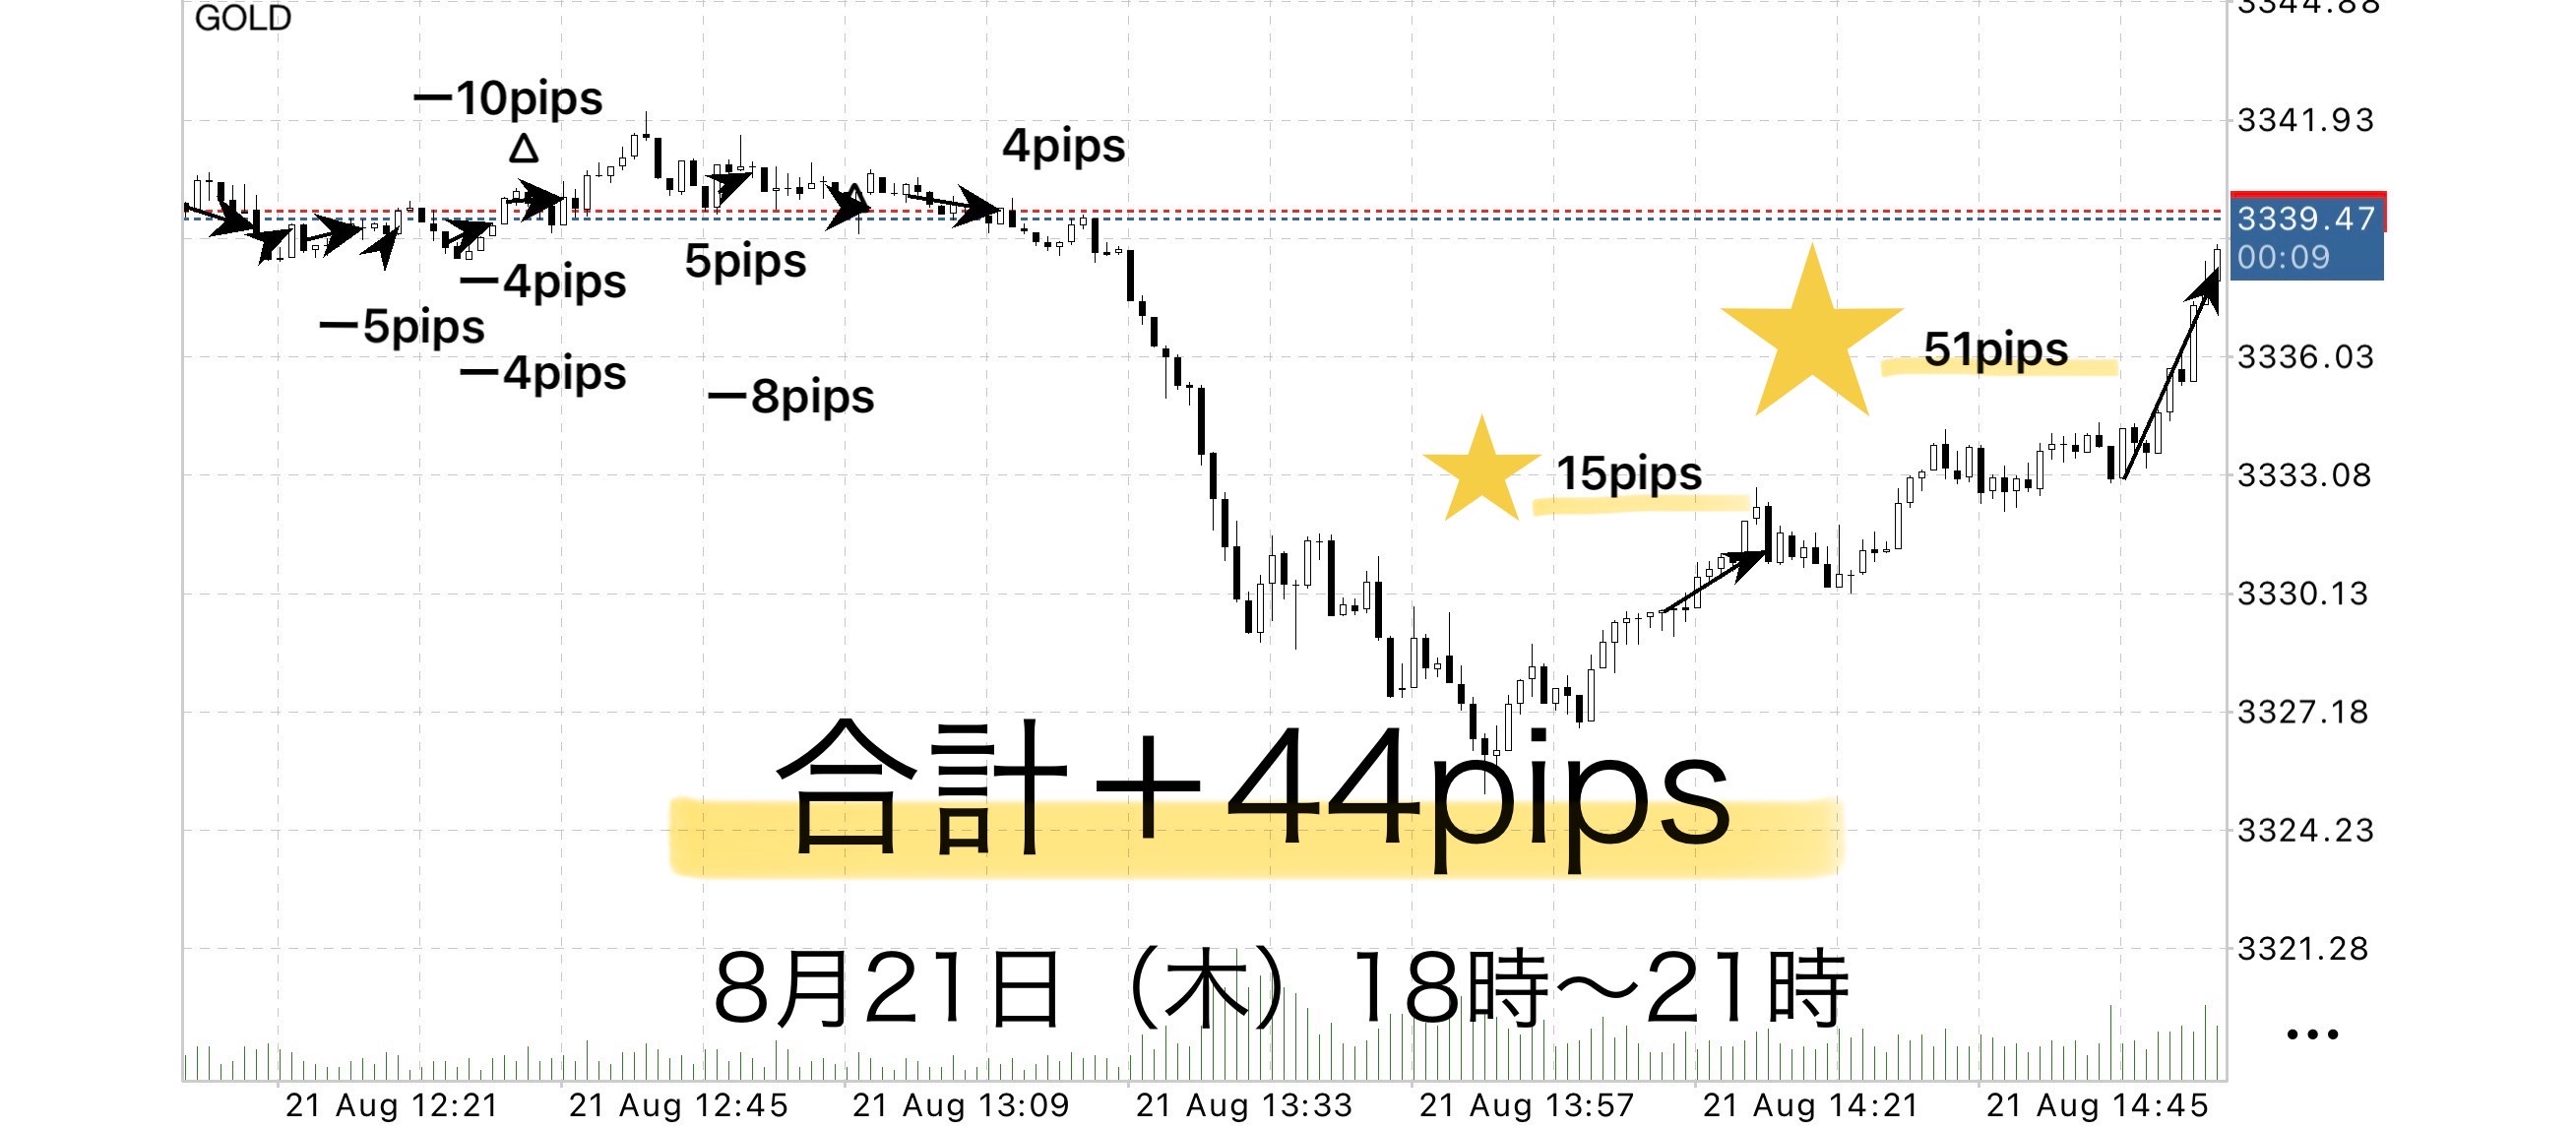
• Total trades: 10
• Profit-taking successes: 4
• Position settlements: 1
• Stop losses: 5 (all within −10 pips)
• Total acquired: +75 pips
• Total loss: −31 pips
•
• Win rate: about 40% (4 wins / 10)
• PF (Profit Factor): 2.42
Points
Some entries captured price ranges at early stages, delivering stable profits.
Although there were more stop losses,the RR ratio was good, and total remained positive.
⸻
August 22 (Fri)
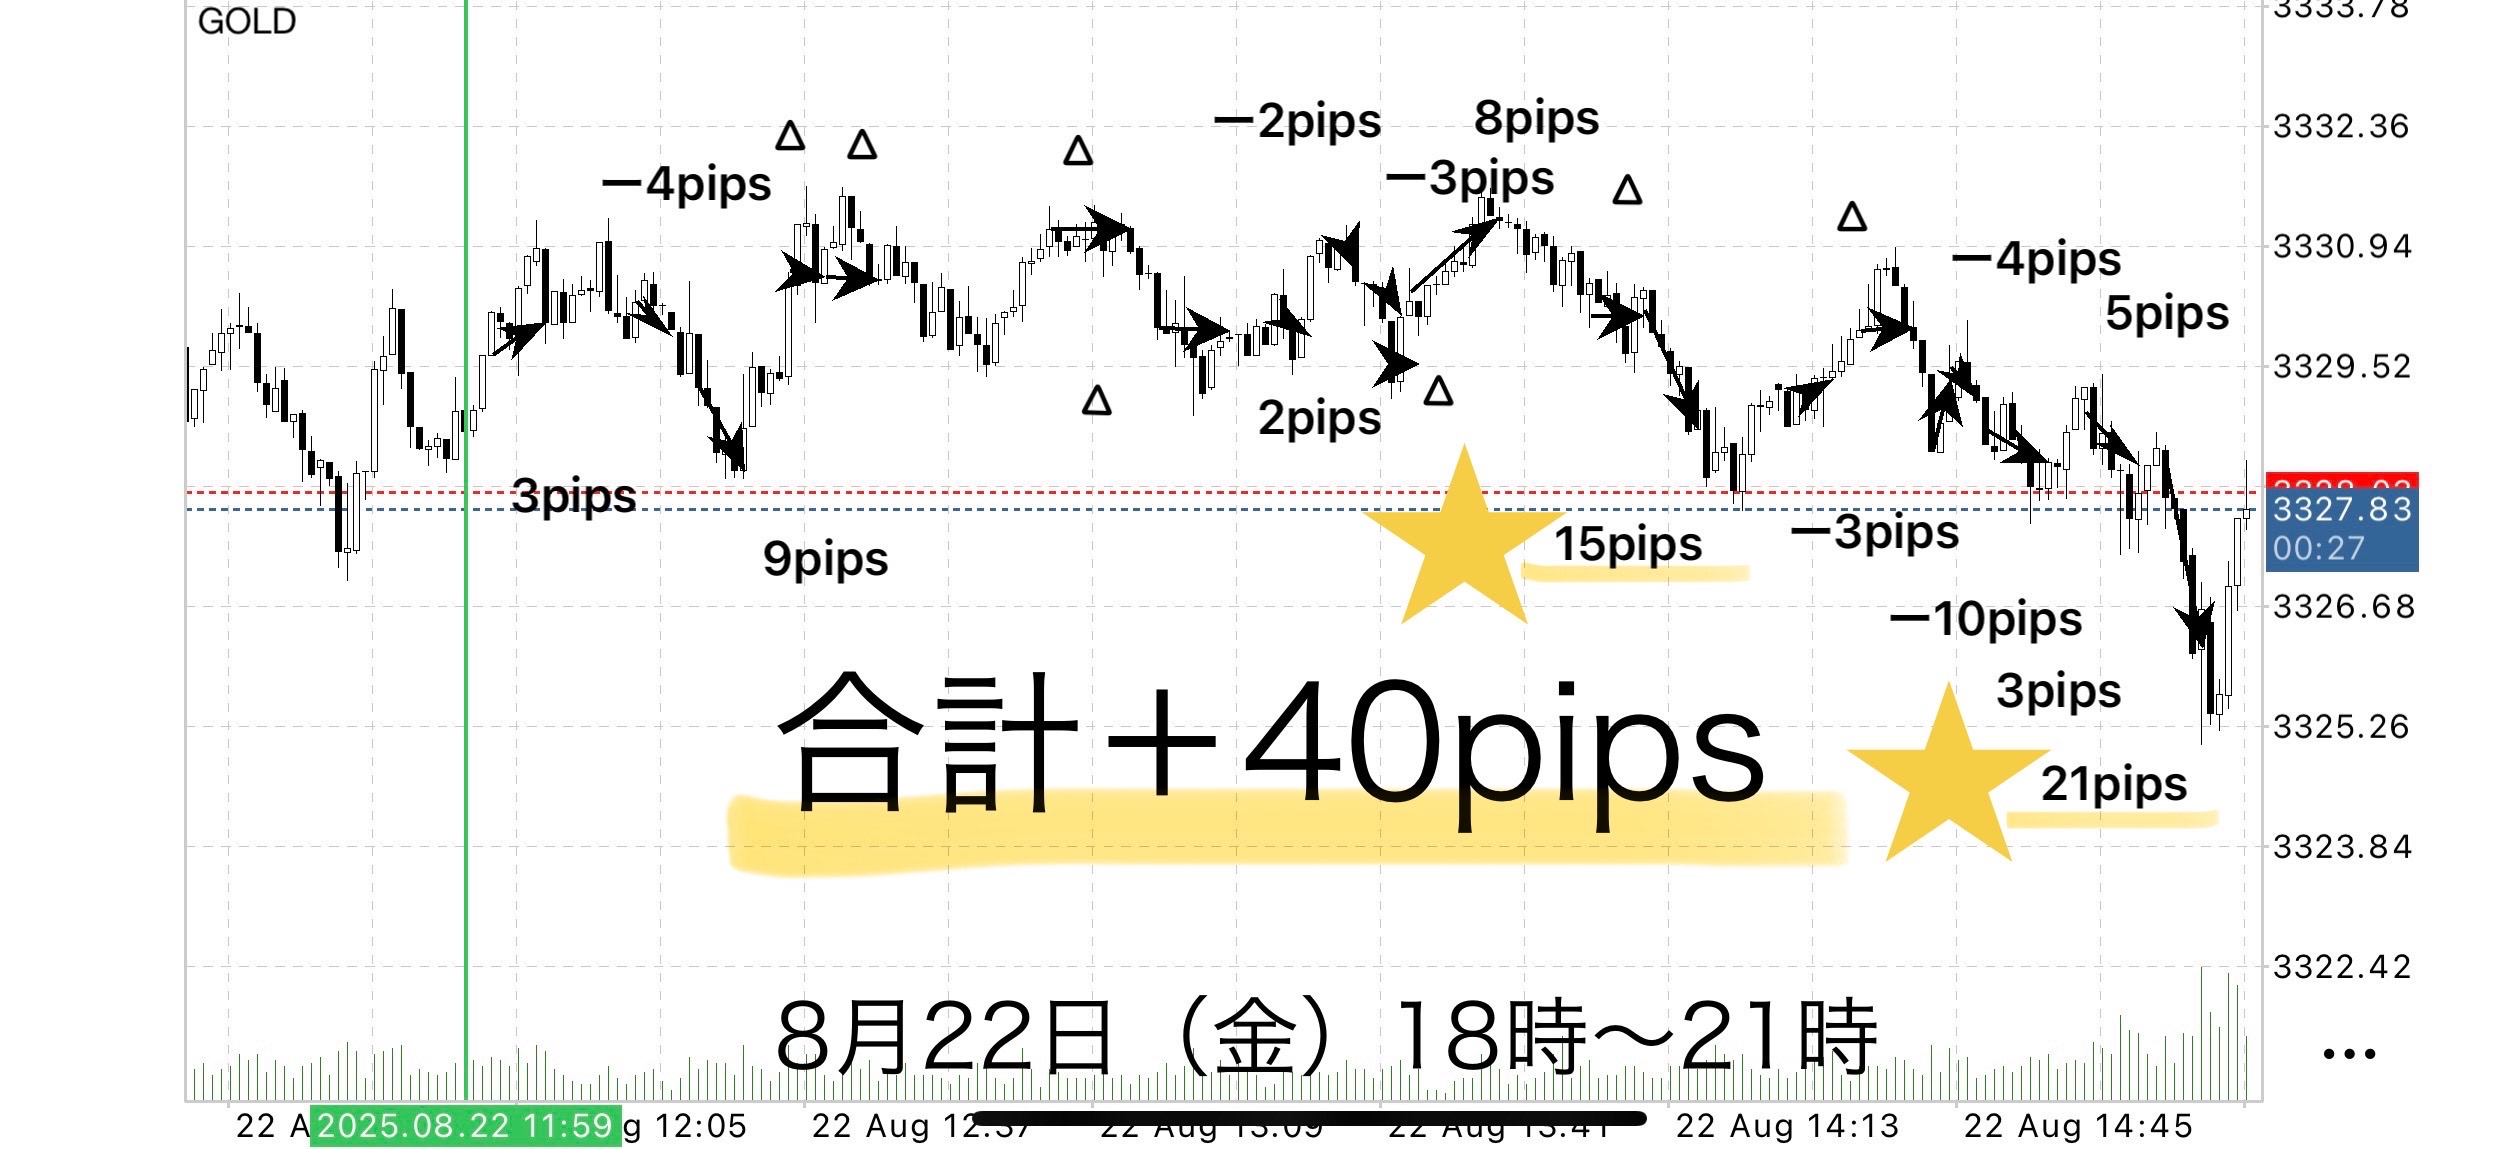
• Total trades: 21
• Profit-taking successes: 8
• Position settlements: 7
• Stop losses: 6 (all within −10 pips)
• Total acquired: +66 pips
• Total loss: −26 pips
• Net profit: +40 pips
• Win rate: about 38% (8 wins / 21)
• PF: 2.53
Position settlements were many and prevented price from extending.
Nevertheless, profits remained, concluding the week..
⸻
Discussion
Looking back on these five days,entry accuracy according to the logic was very high, and positions were held in good locations.
On the other hand, settlements were often shallow, and it is true that there were movements that could have been extended a bit more but were not completed.
However, in other words, this also means that “risk management with small losses and large gains” was functioning.
Even in weeks with many shallow settlements, the overall total ended up +115 pips, which is a strong testament to this logic.
In trading, the balance is not to chase huge profits every time but to steadily accumulate and seize big gains when they occur.
The results of this test reaffirm that basic principle.
EA-driven breakout strategy
“Sky Between” is a simple strategy where entry is automated by an EA, and traders focus only on monitoring after entry and executing the settlement rules.
The EA continuously monitors the chart and can enter accurately at the breakout moment.
This eliminates the stress of staring at the screen before entry and the anxiety of missing the timing.
As a buyer bonus, this EA is available for use.
If you wish to use it, message us and we will send you the download password.

Why publish negative results?
Investing Navi+ intentionally publishes negative results without hiding them.
The reason is that “trading is not something you can consistently win at.”
Rather, by recording losses you can analyze when you lose and make the logic more robust.
Instead of focusing on each win or loss,
on a weekly or monthly span, what matters most is that the total balance is positive.
• “Today I won, so I’m happy”
• “Today I lost, so I’m anxious”
To eliminate these emotional swings, let the EA handle entries, and have humans focus on “settling according to the rules.”
It’s not about “wanting to win,” but about “wanting to earn”—This mindset is the foundation for long-term profitability.
Stability gained by following the rules
A common trait of those who lose big in trading is the urge to win leads to breaking the rules
• Entry fully automated by EA
• Settlement under fixed, rule-based conditions
This reduces human intervention to the minimum and removes hesitation.
Merely mechanically following the rules stabilizes win rate and risk-reward.
⸻
There are numerous technical indicators in chart analysis: moving averages, RSI, MACD, Stochastics, Parabolic SAR, ADX, ATR, CCI, trend lines and channels, Fibonacci retracements and expansions, Ichimoku, volume, and support/resistance lines.
There is no single correct method; what matters is to pick one personal rule you can believe in and repeatedly test it.By doing so you gain a confidence that works in the market and the sense that your expected value is accumulating.
⸻
We tested the “max profit taking type” rules at Sky Between,
there are cases where position settlements dominate, but by adhering to the rules you can calmly seize the next opportunity.
Even in scenes where you could have captured more,
by closing at break-even according to the rules, you can maintain a positive total.This is the strength of the strategy.
The most important factor in trading is “Win rate” not “Reproducibility”
Most traders worry about win rate, but
Sky Between
•EA entry → mechanical stop → fixed take
making trading a sustainable business.
⸻
A total-positive strategy
Do not chase daily wins. For example, looking at weekly or monthly spans, a few negative days can be acceptable if the overall is positive.
Since the EA has no emotions, it is ideal for long-term fund management.
By operating under the vision of “earning” rather than simply “winning,” the capital growth curve tends to stabilize.
ℹ️
Currently, those who purchase Sky Between receive auxiliary tools (automatic entry + stop processing) as a bonus.
This was created from the desire to use it daily and
it automates breakout judgments and risk management according to market structure.
Profit-taking remains primarily a matter of your own judgment, and this tool is well-suited for that.
There are not many reviews yet, but this may be because it is simple and clear in structure before and after purchase.
However, if usage expands in the future, a paid version may be considered.
The reason is that this tool may require support and a bundled service rather than standalone sale.
◻️ For those who want automatic entry with EA
The tool that automates this logic is currently distributed as a purchase bonus.
If you are considering purchasing, please feel free to contact us.
If you are interested in Sky Between, you can join our online community
Join the online community here

We cannot explain specific trade logic inside the online community, but
you can join a “Chart critique community” that uses Sky Between.
• If you send a chart image you are curious about,
“What would have been the correct judgment in this scene?”
“Where were the entry and take-profit points?”,we will provide feedback with rules-based examples.
•Past charts at specific times are also OK.
We reply in a timely manner as time allows.
To those interested in Sky Between
Build a foundation to judge by rules without hesitation in short-term trading—
that is the core philosophy of Sky Between.

Free learning material here:
▶︎ Download 'Traces to the Gap'
In 'Traces to the Gap', you can learn in which situations you can actually trade?
Its judging criteria are explained more clearly.
The selling page for Sky Between could not fully convey it,
and details on entry points and zone selection are also covered with diagrams and case-by-case explanations.
Even beginners can reproduce easily, so
if you’re interested, please take advantage of it as well.
If you’re interested, please first receive the free material 'Traces to the Gap'.
From there, your first step into the Gap begins.
“Will you include this chart?”
When you’re unsure,switch your thinking from “feel” to “rules.” This may help.