

【August 18, 2025】Verification of the Day/Night Indicator Devising Method (USD/JPY)
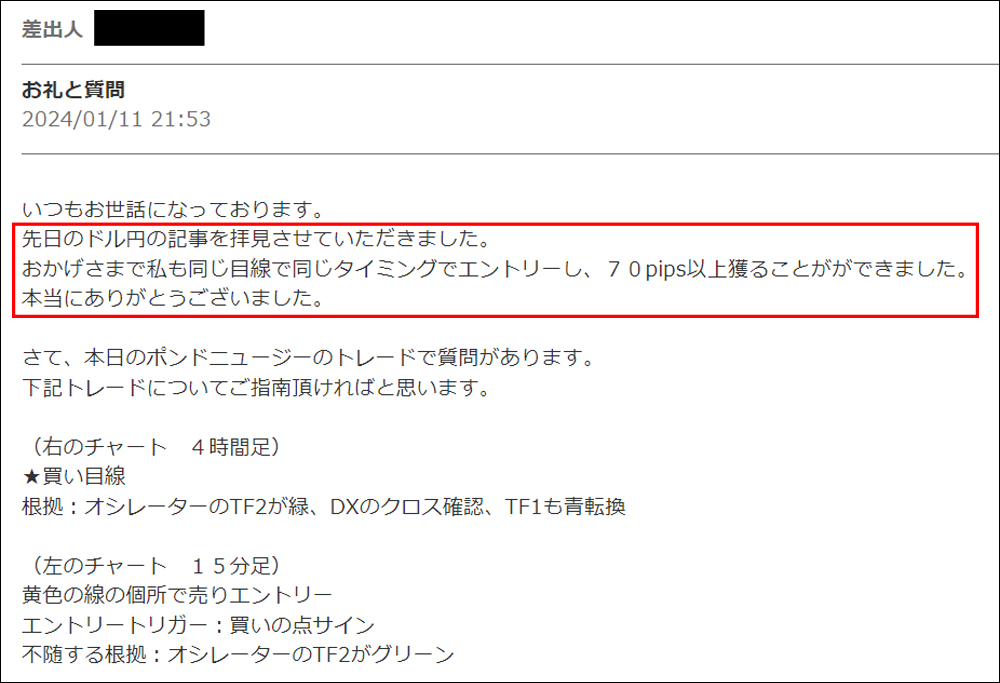
This time, we will introduce the entry point for USDJPY (Dollar/Yen).
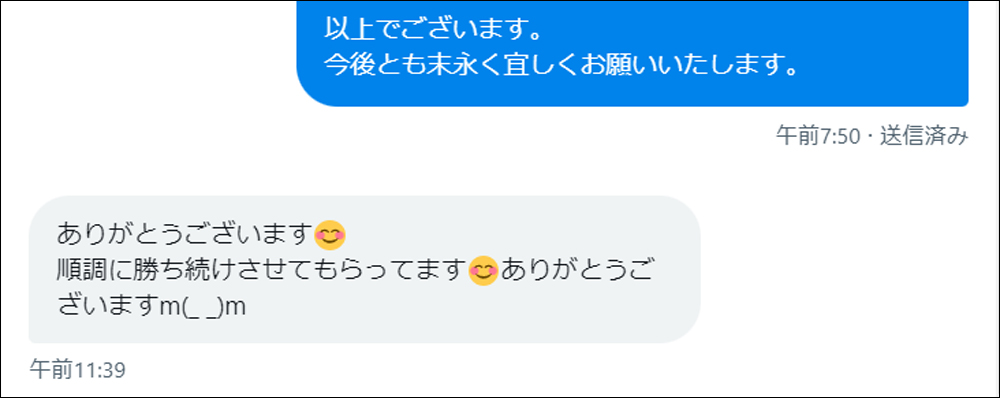
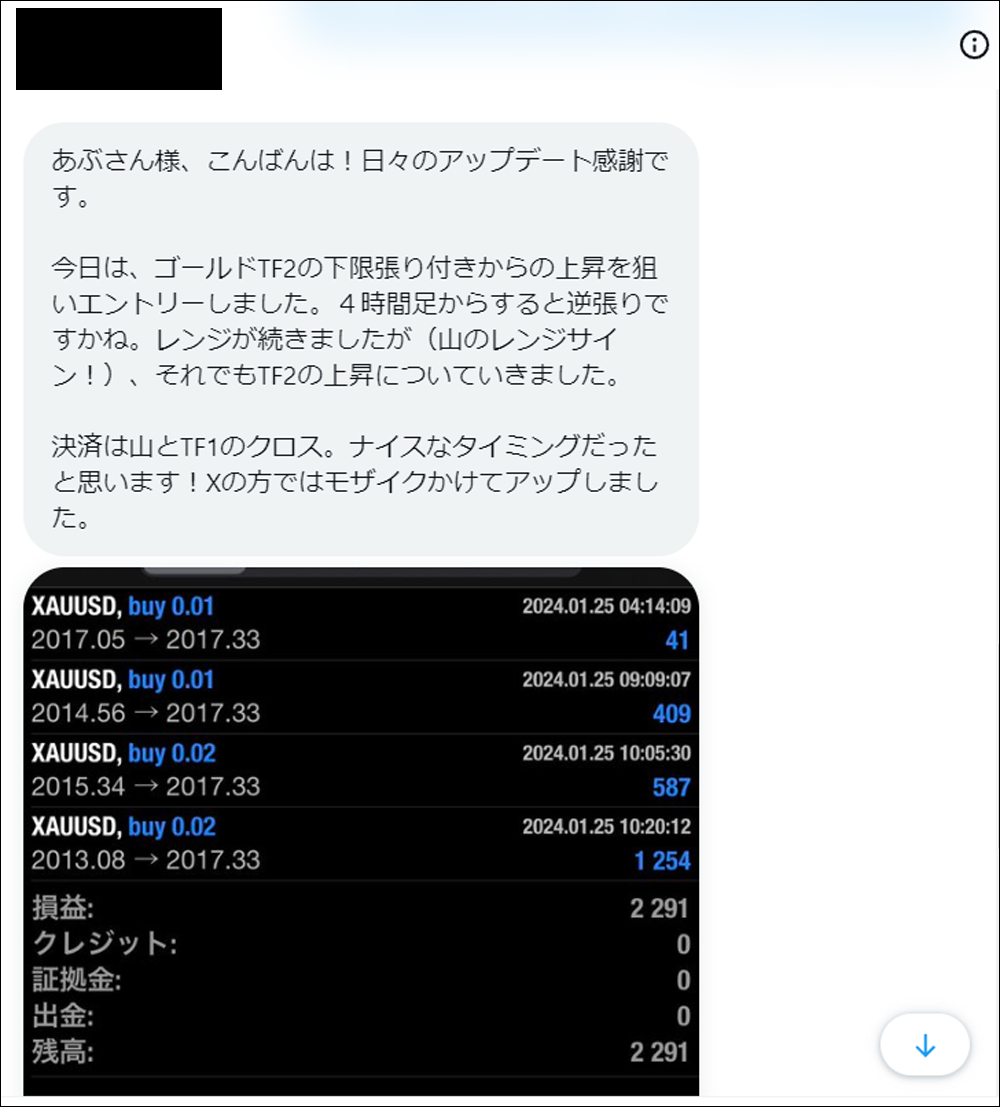
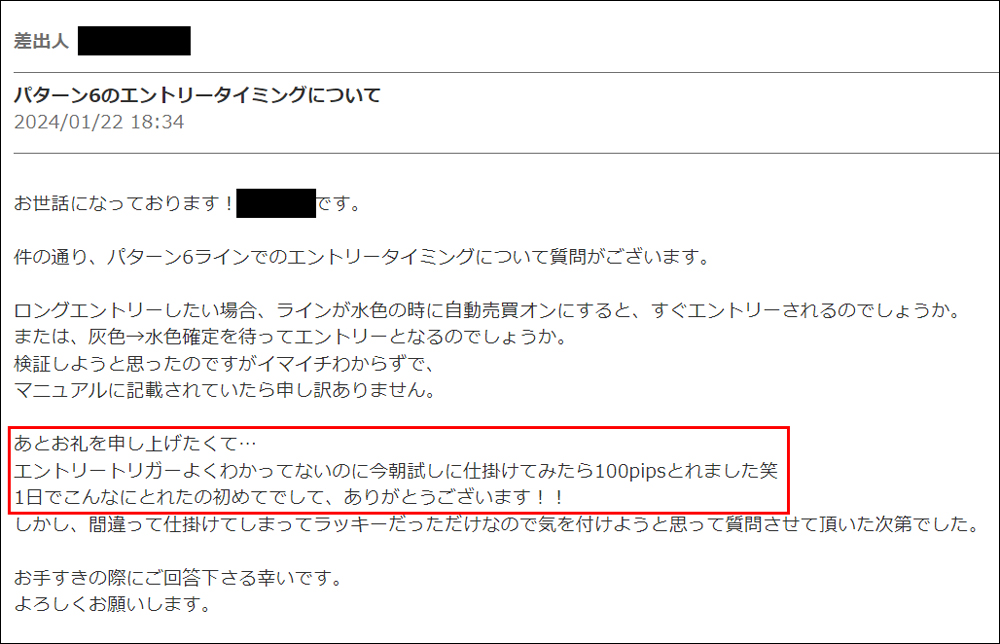
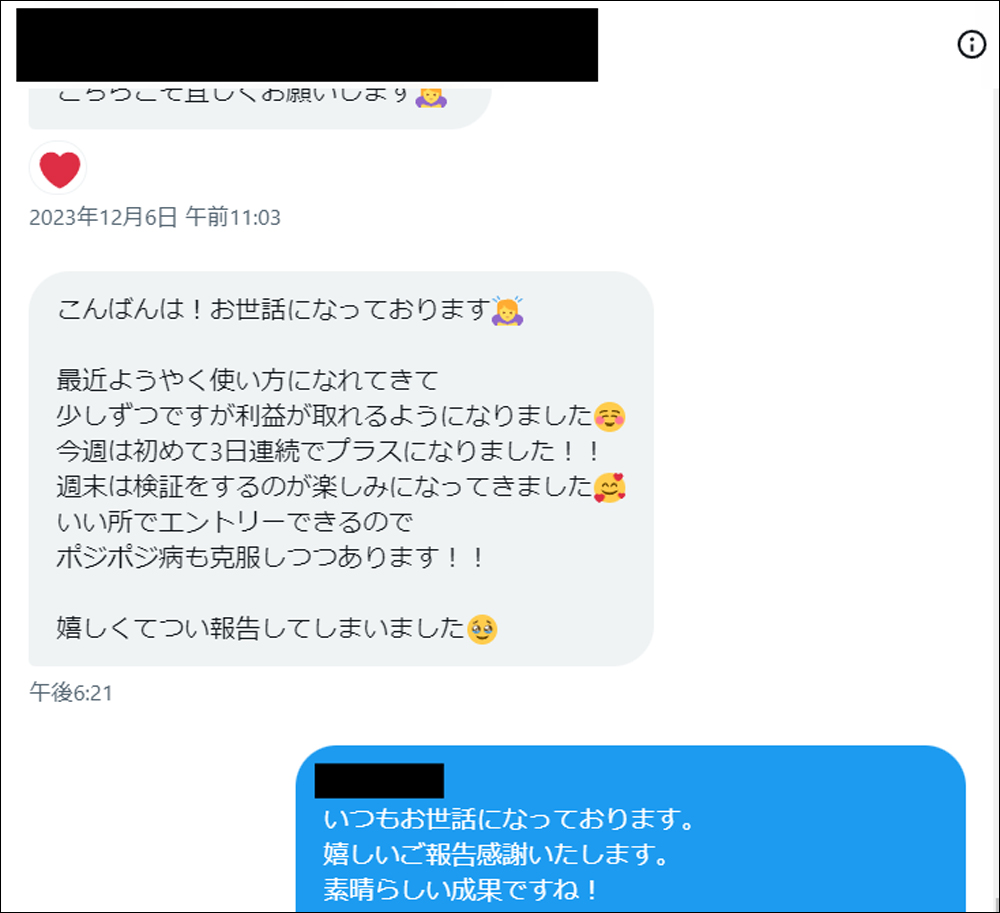


・In articles linked below, we introduce valuable DMs, reviews, posts, and other feedback from users and monitors. We carefully select winning reports and other useful messages, so we believe they will be helpful to everyone. We update them regularly, so please take a moment to read when you have time.
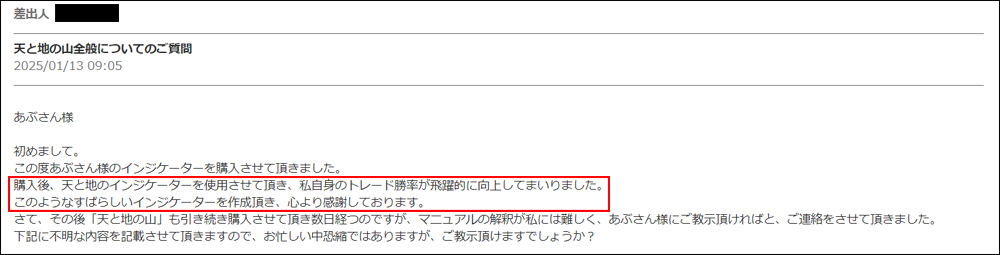
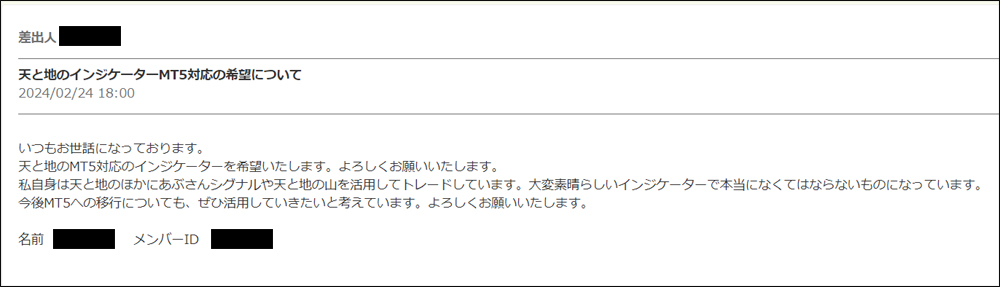
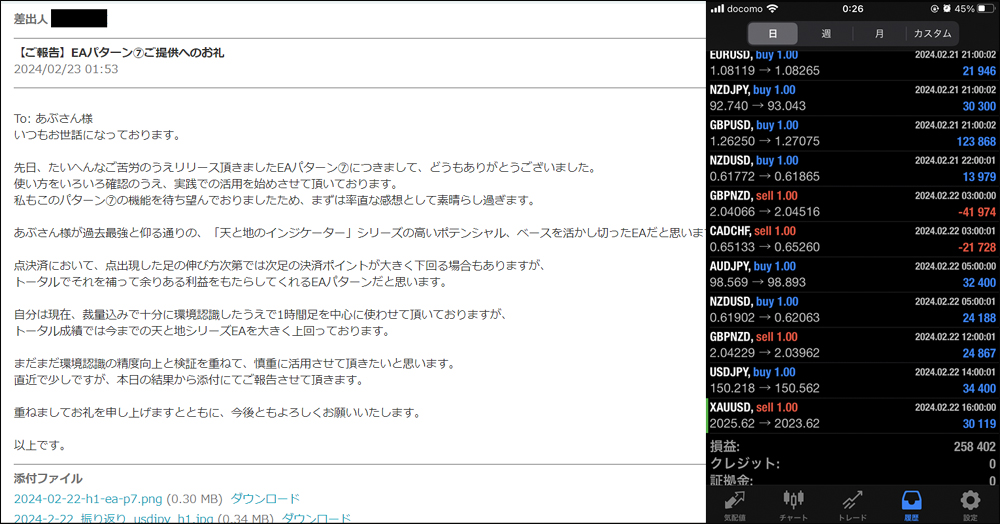
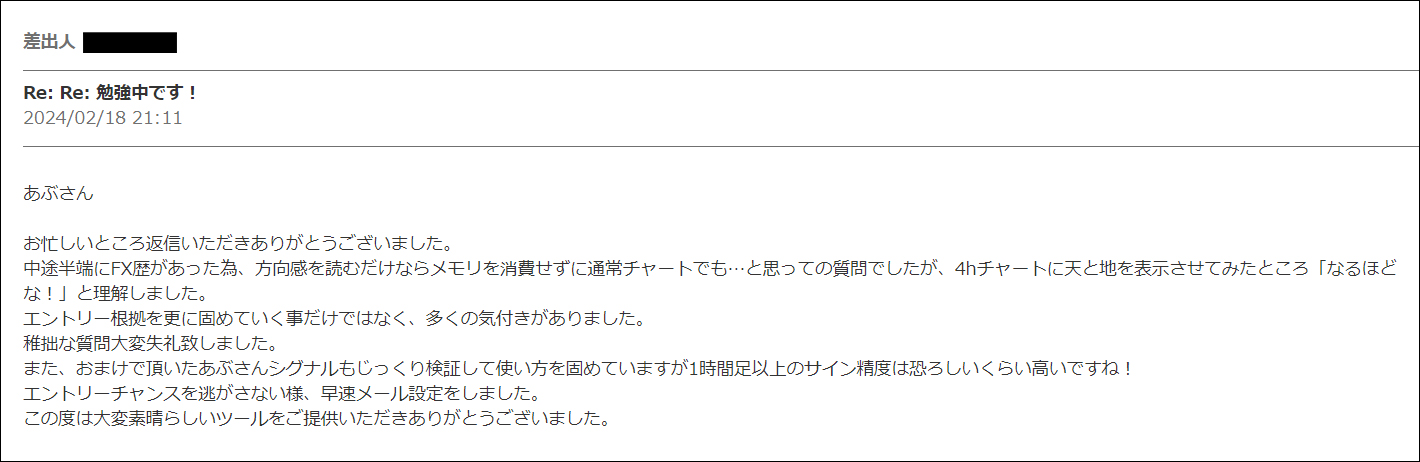
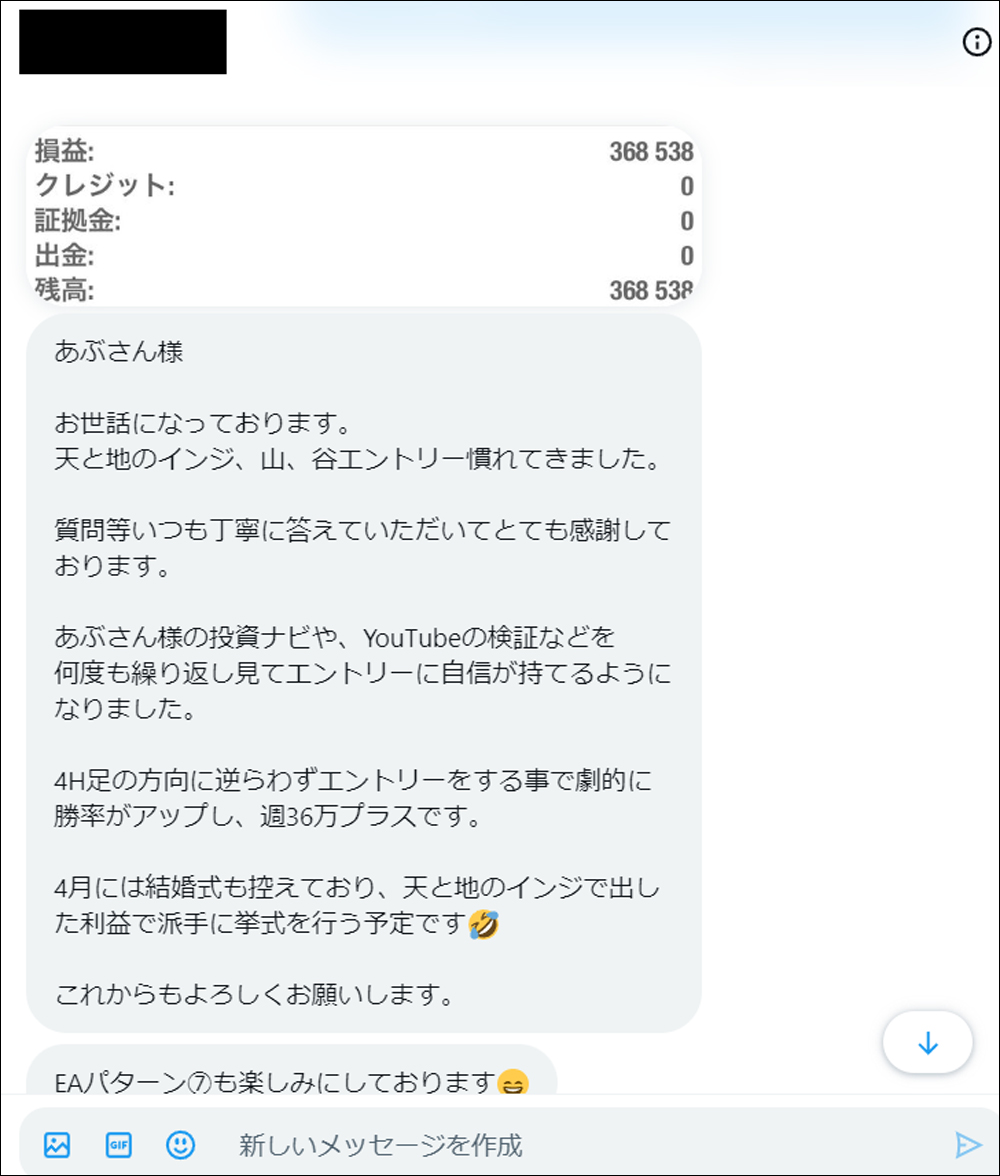
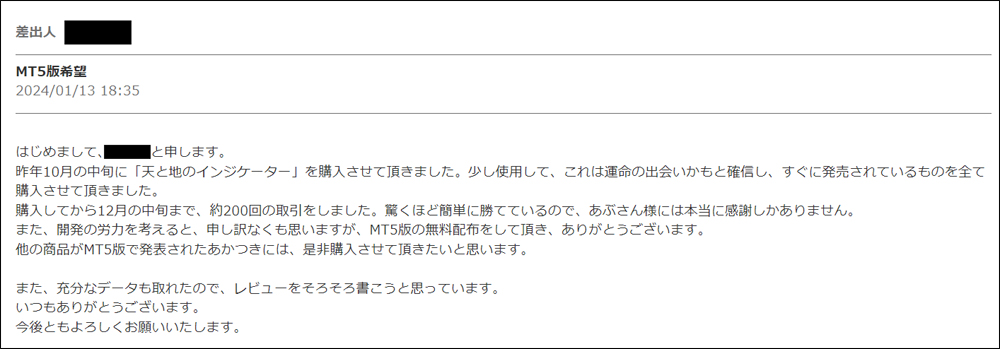
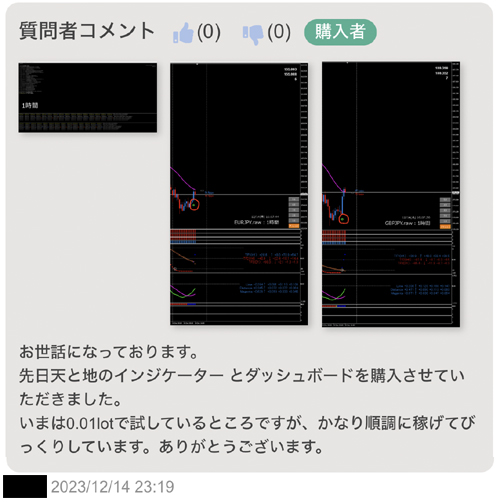
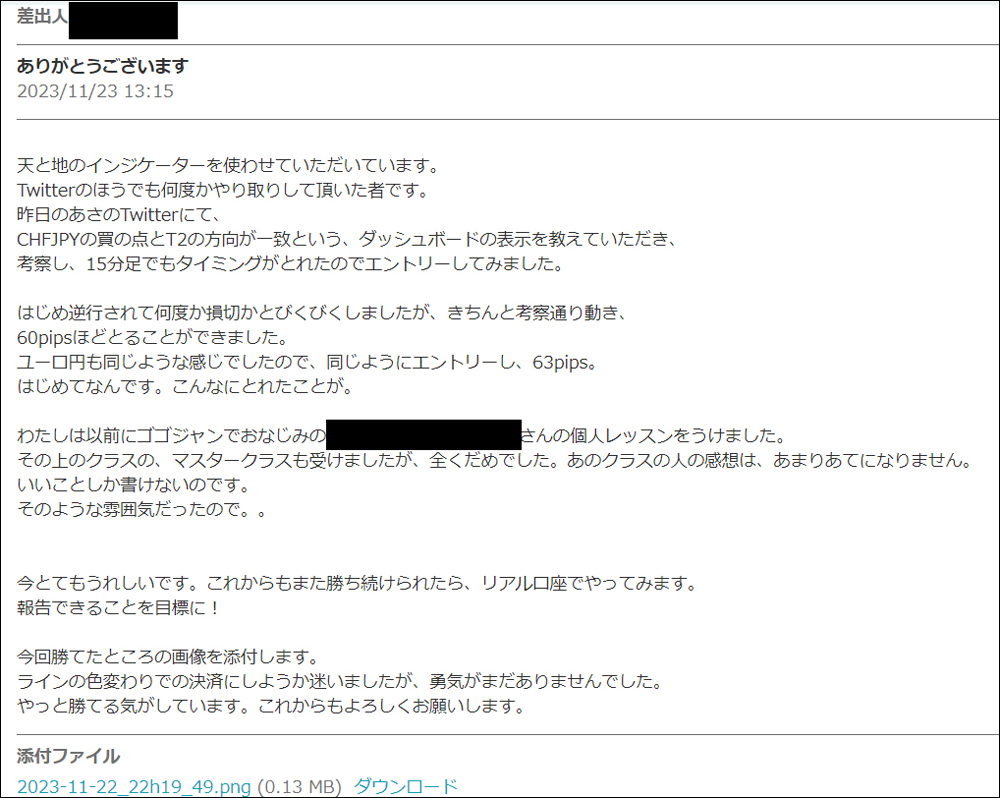
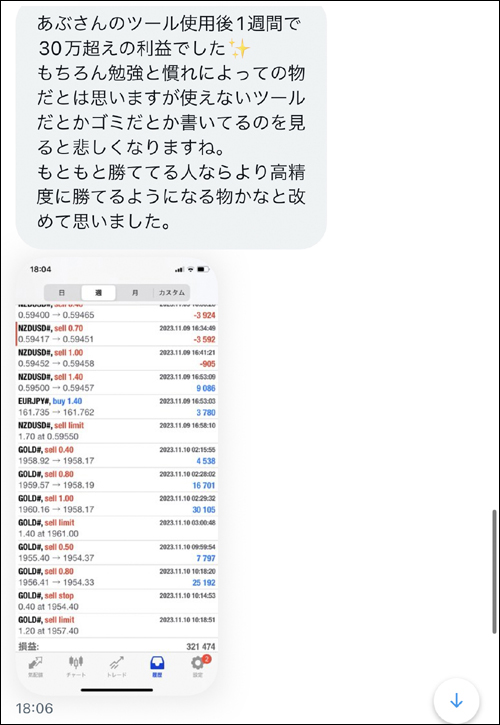
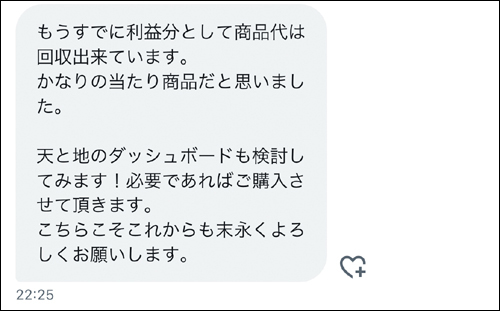
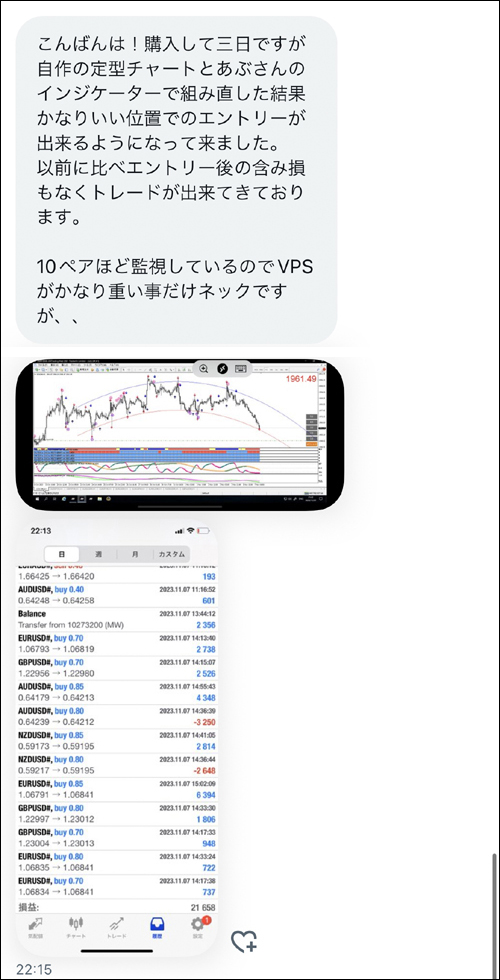
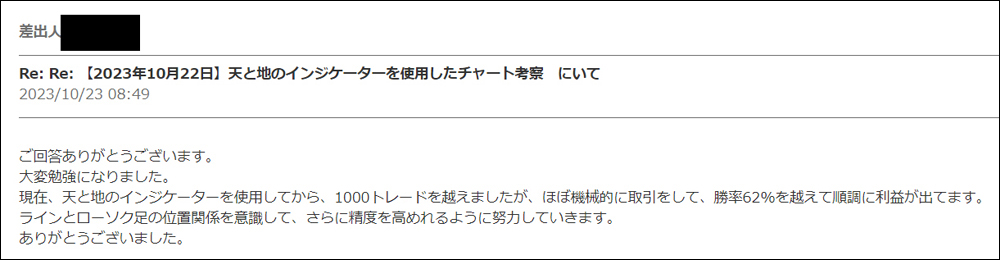
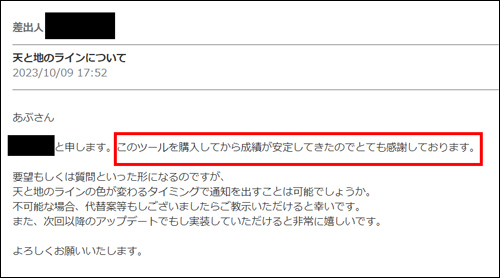
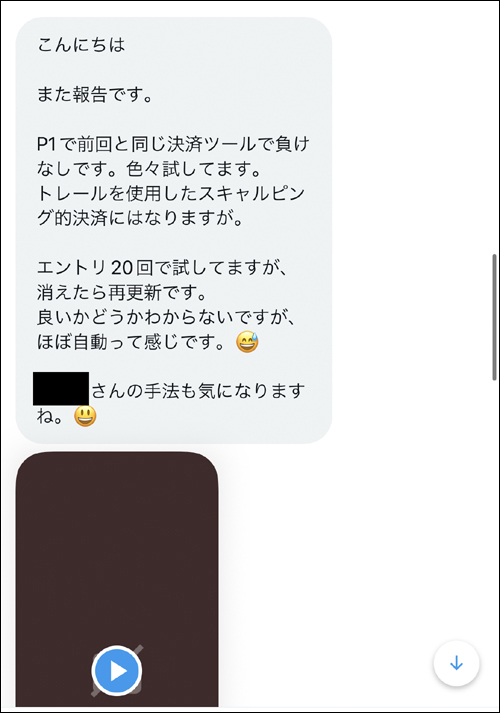
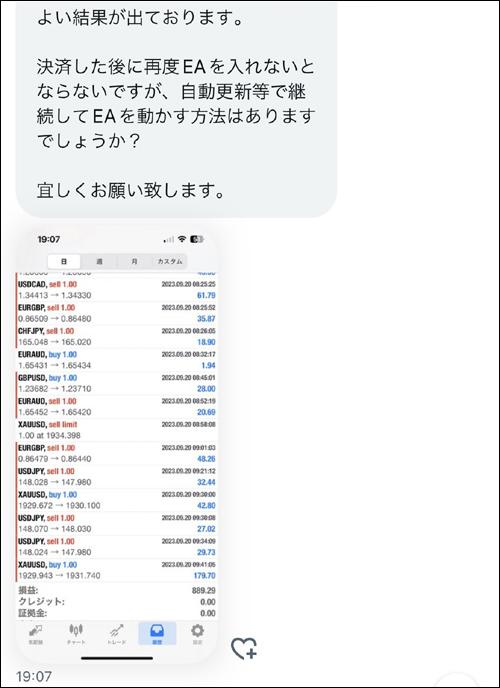
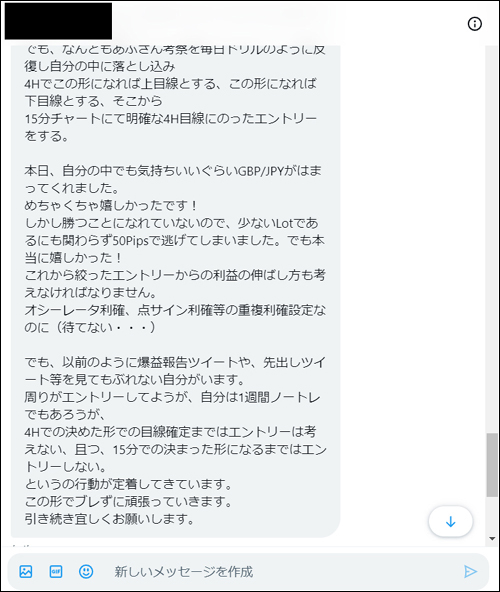
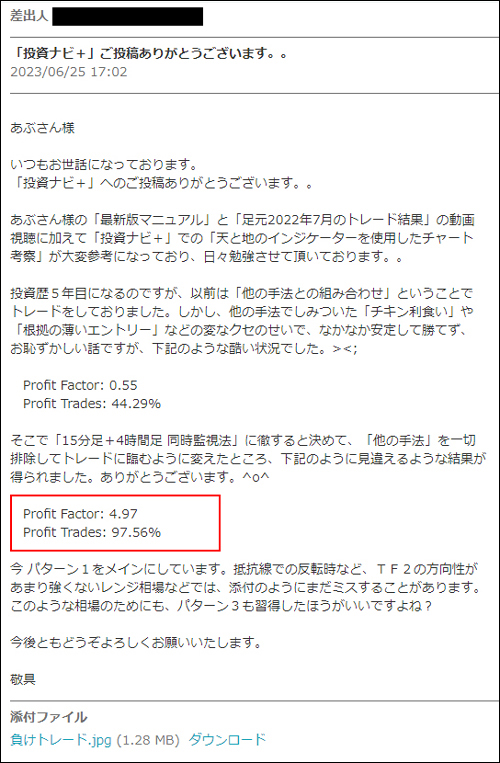
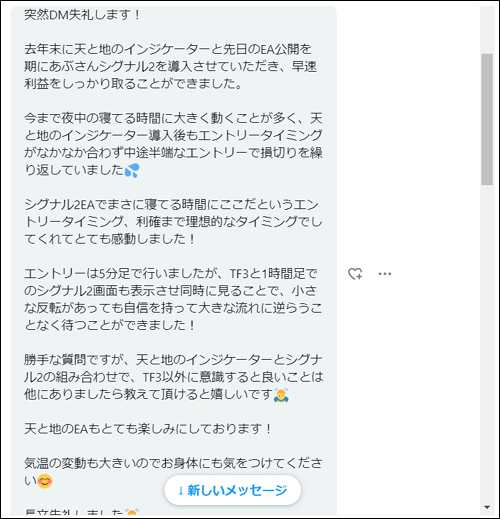
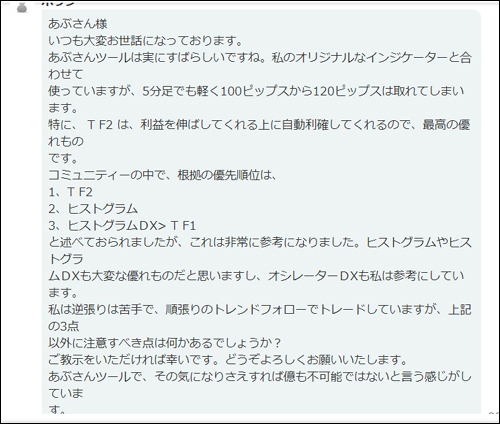
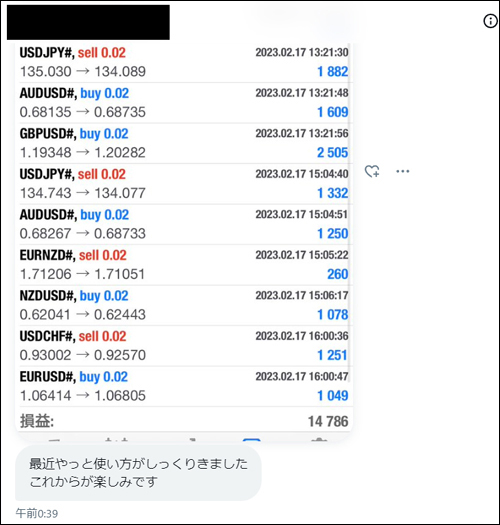
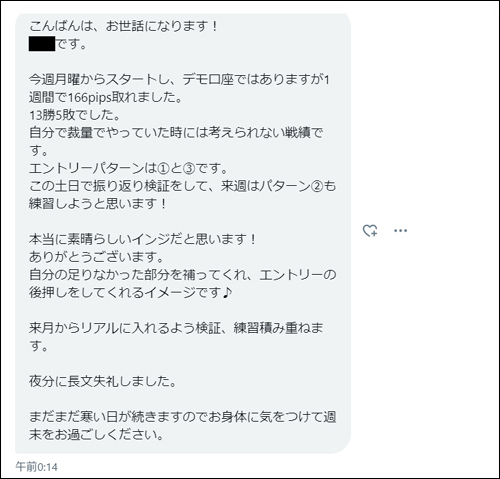
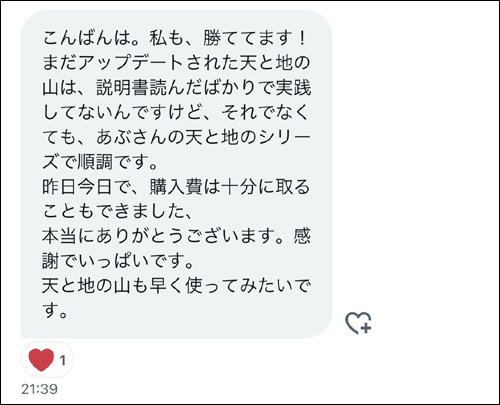
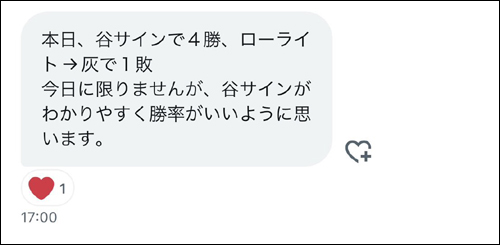
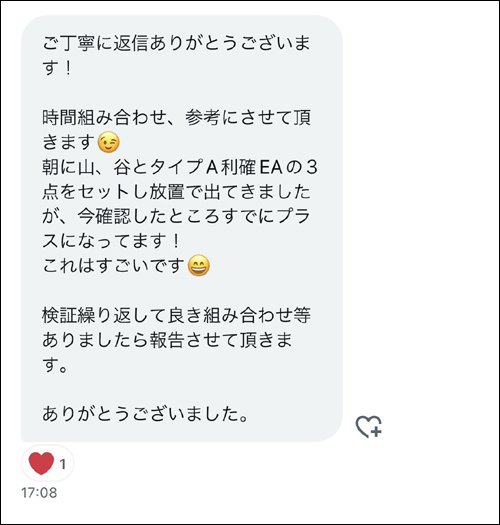
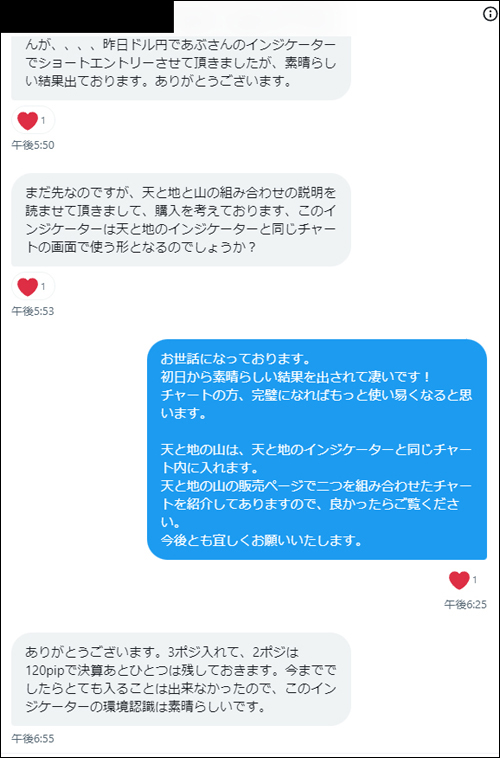
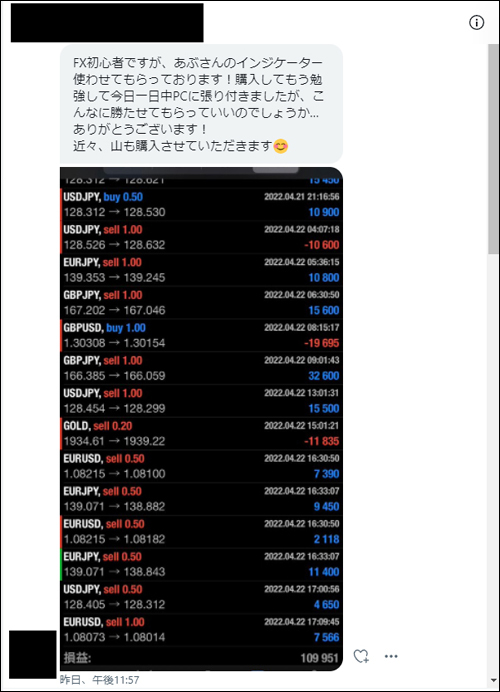
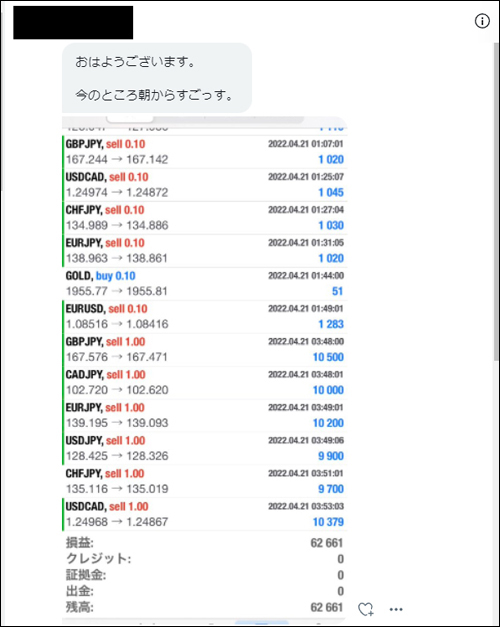
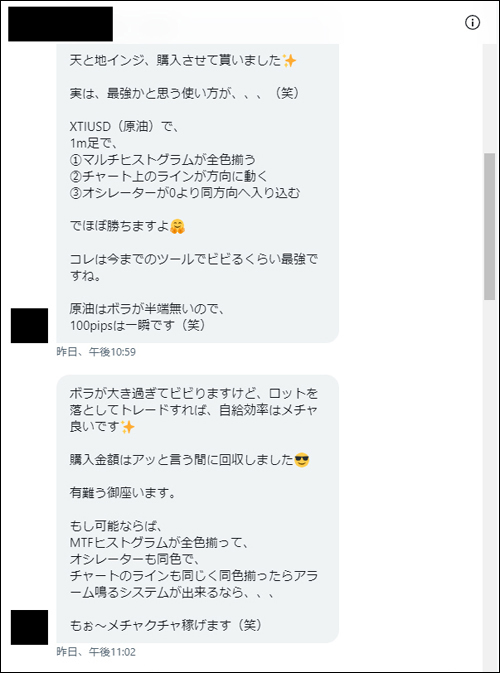
・Feedback from users who actually used the Ten to Chi indicators (Review version)
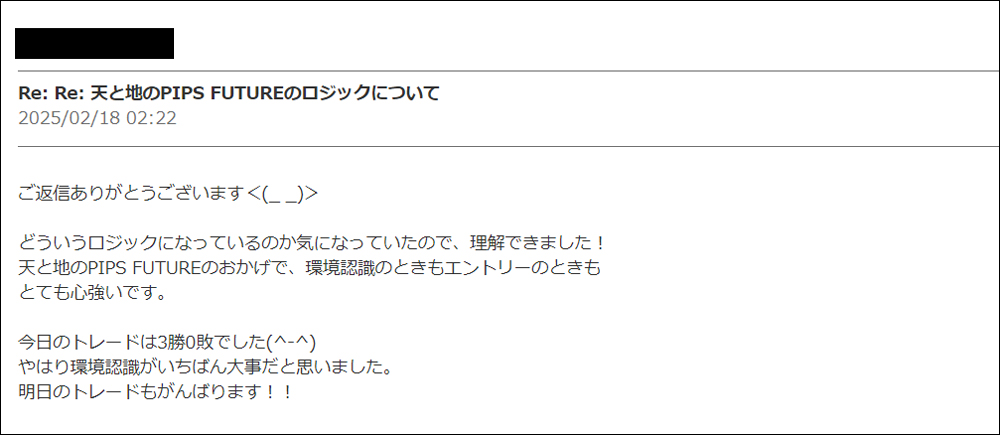
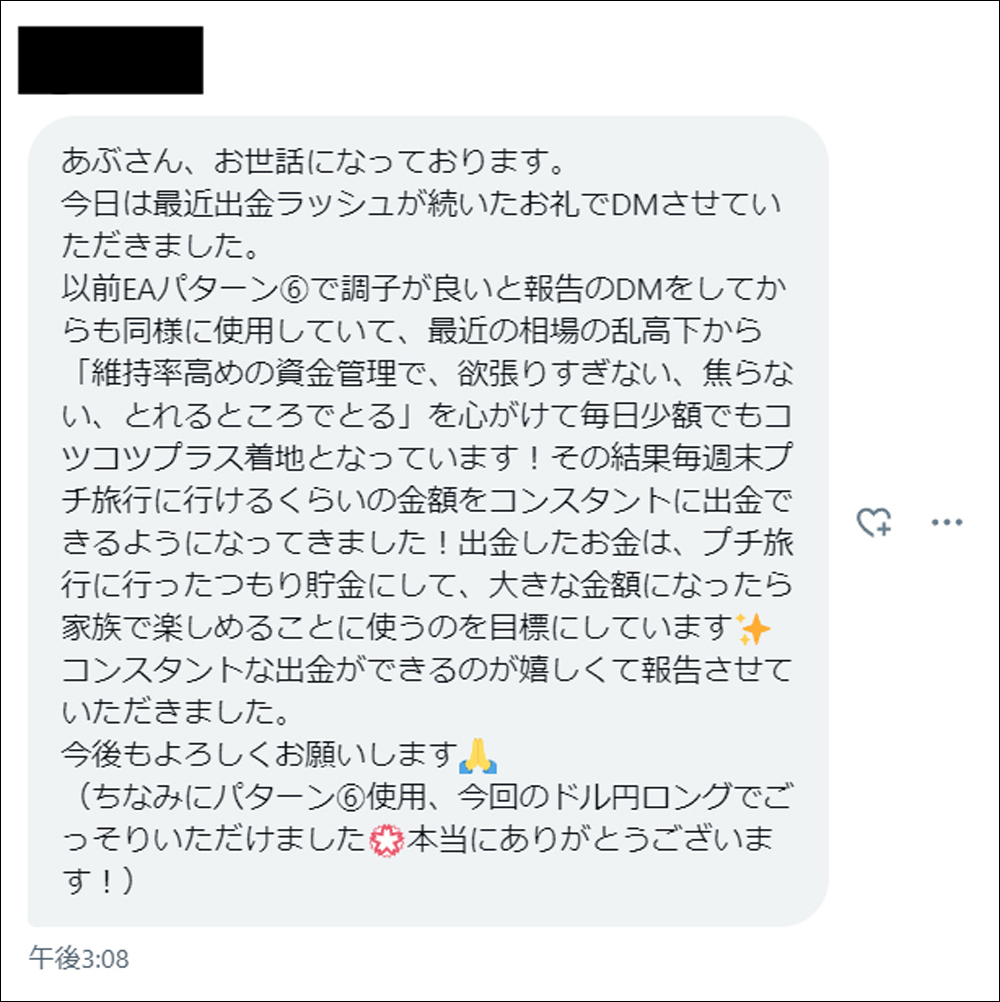
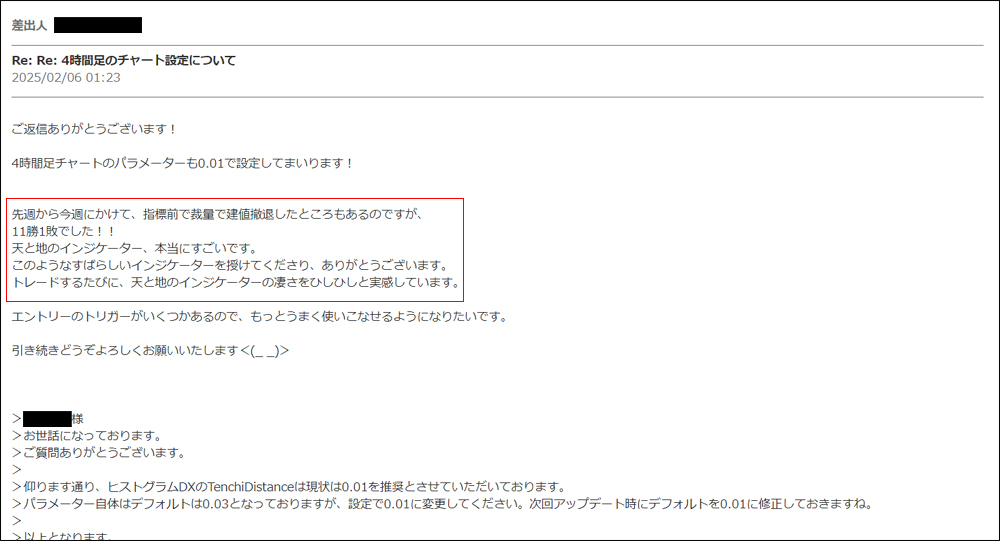
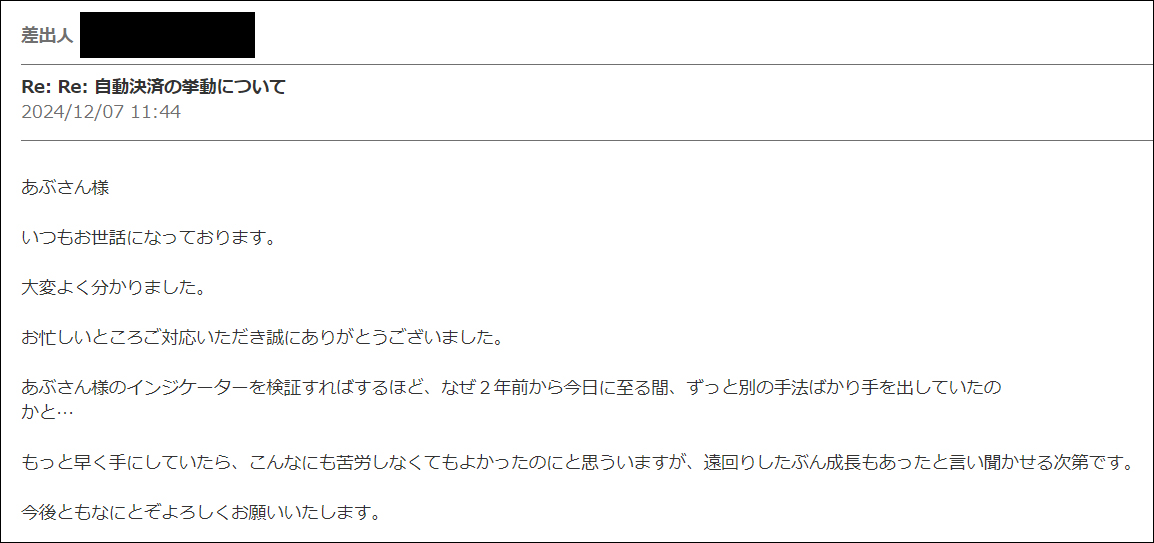
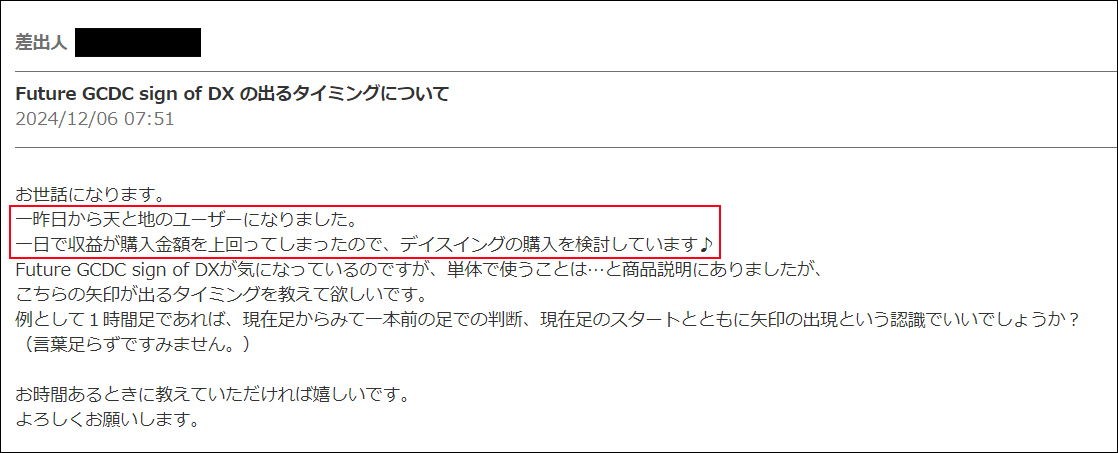
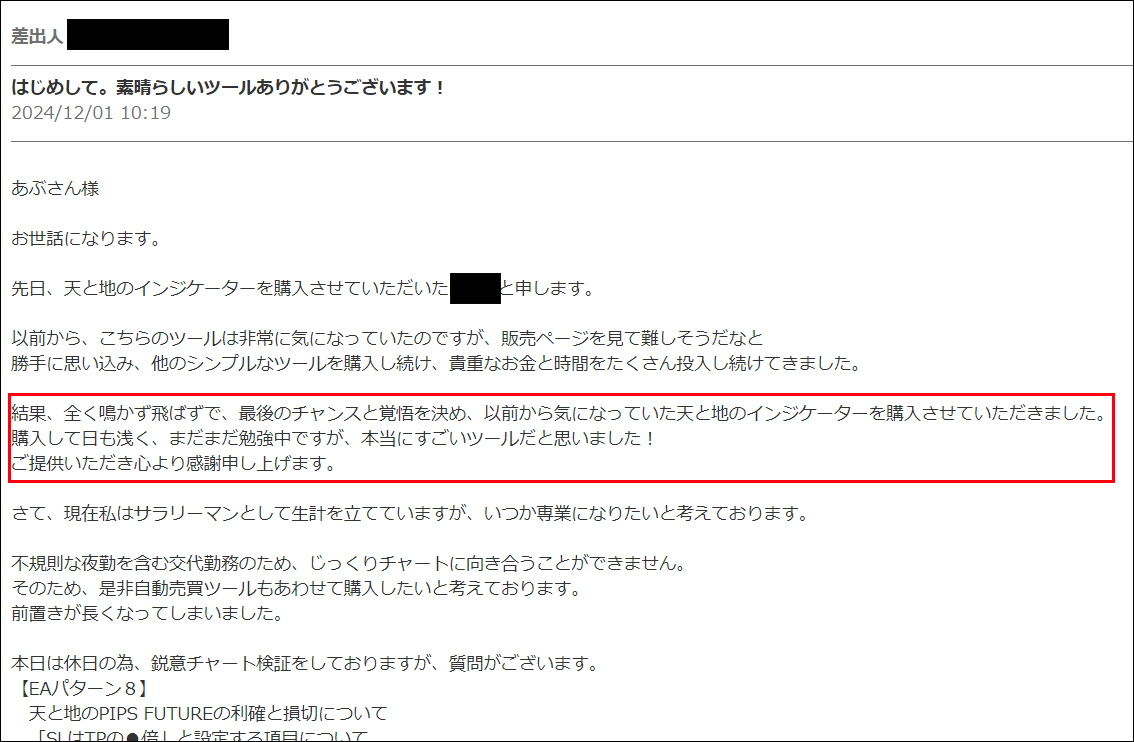
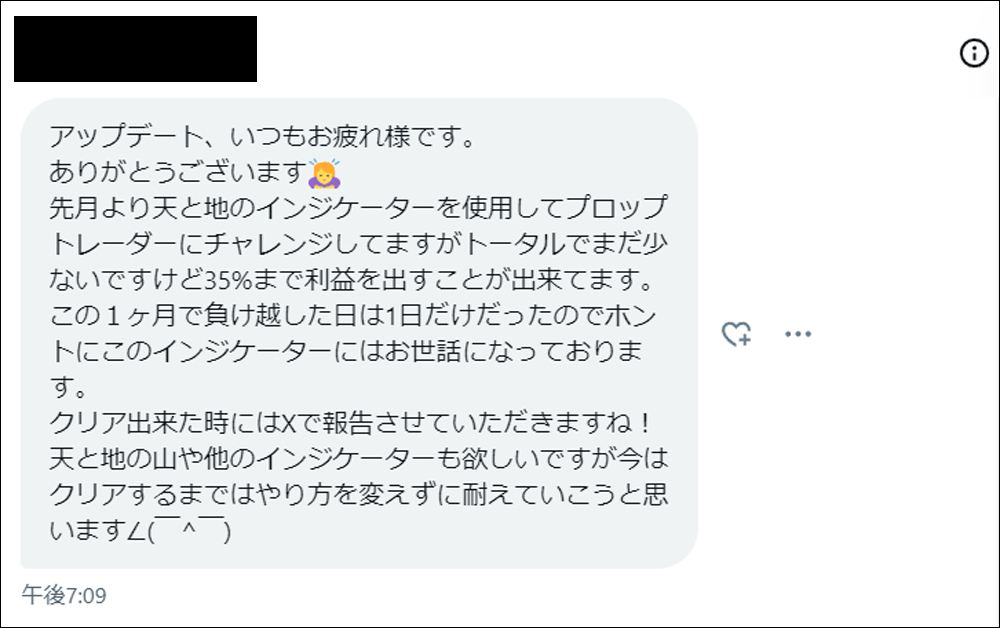
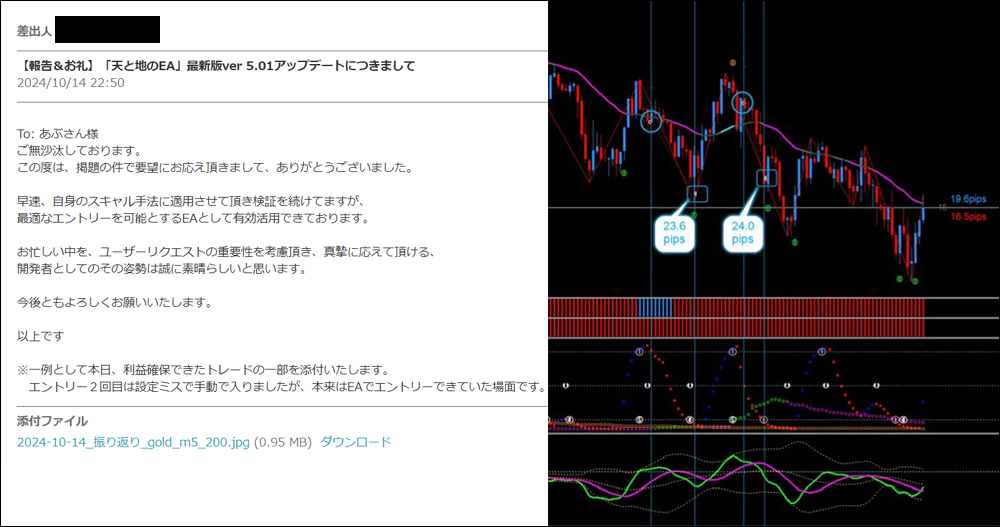
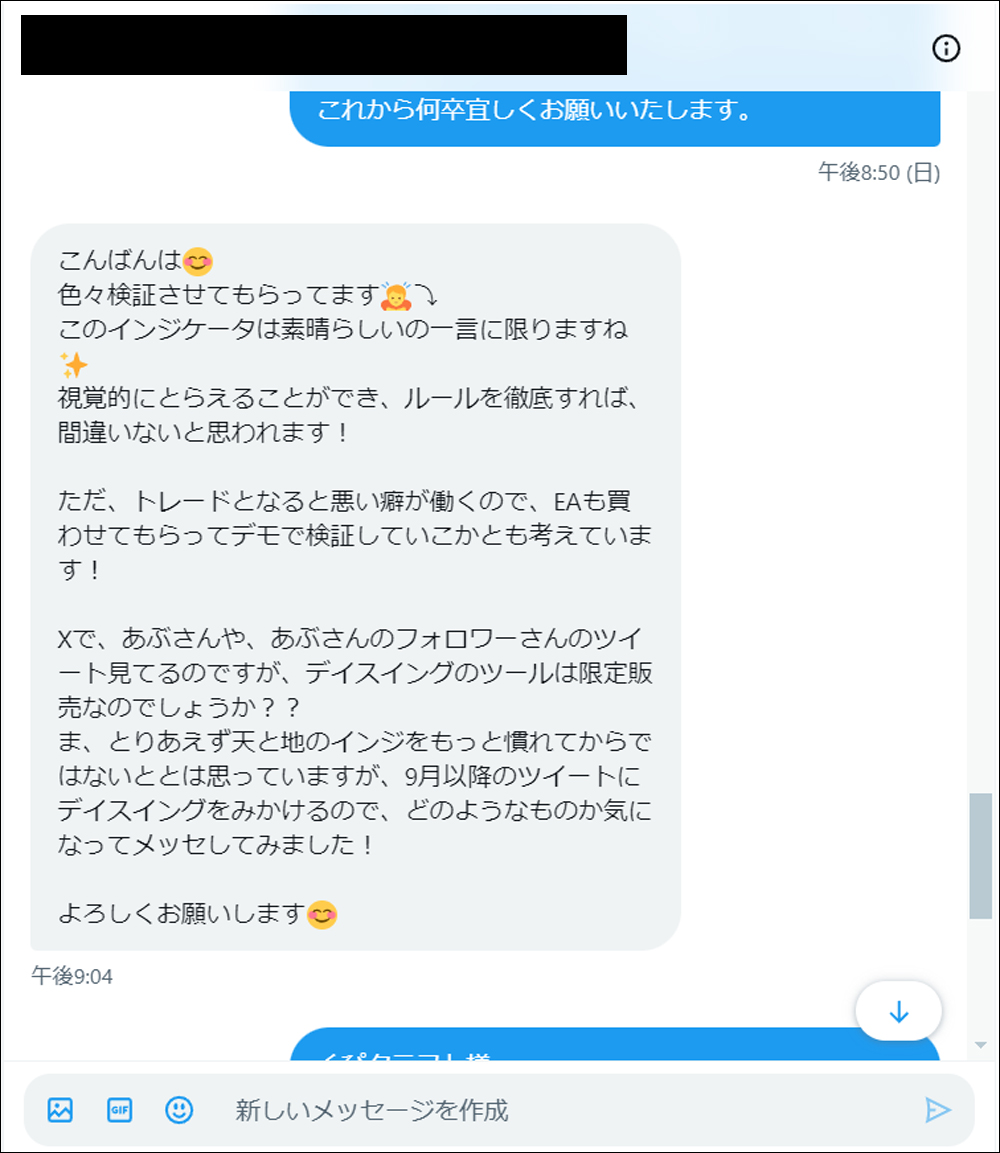
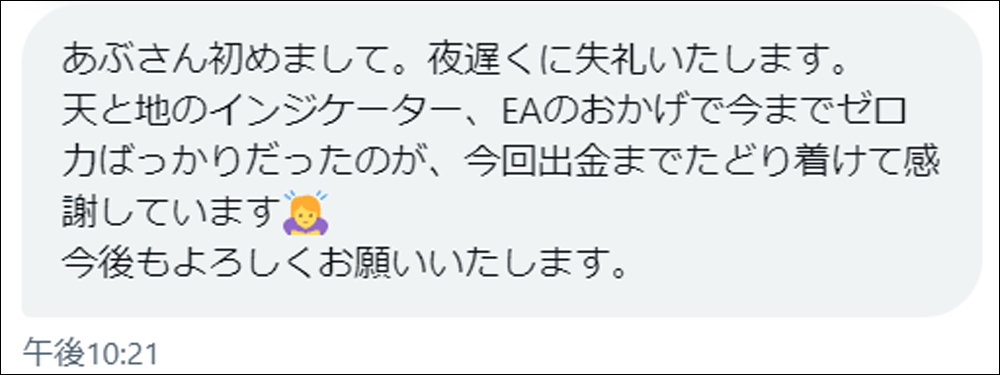
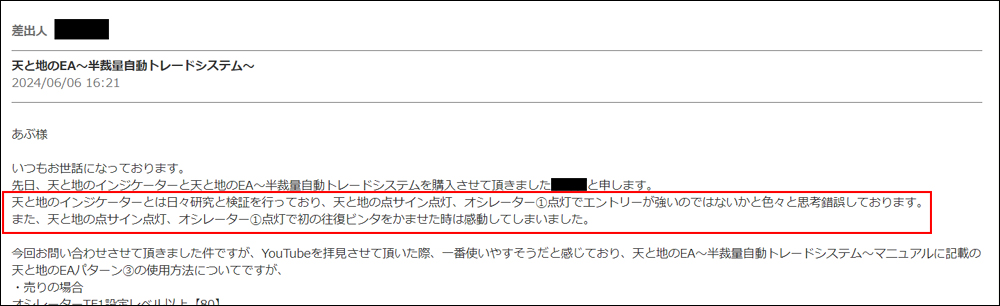
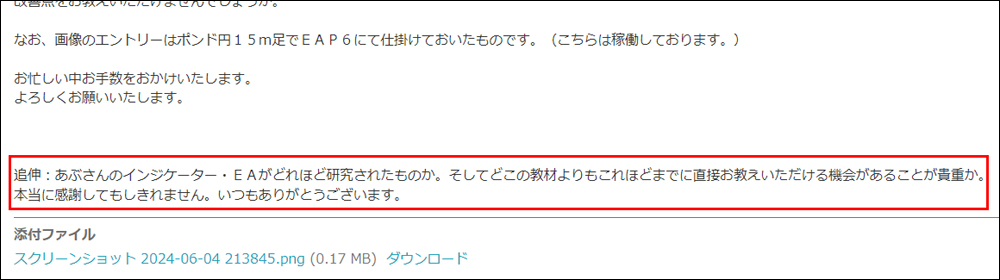
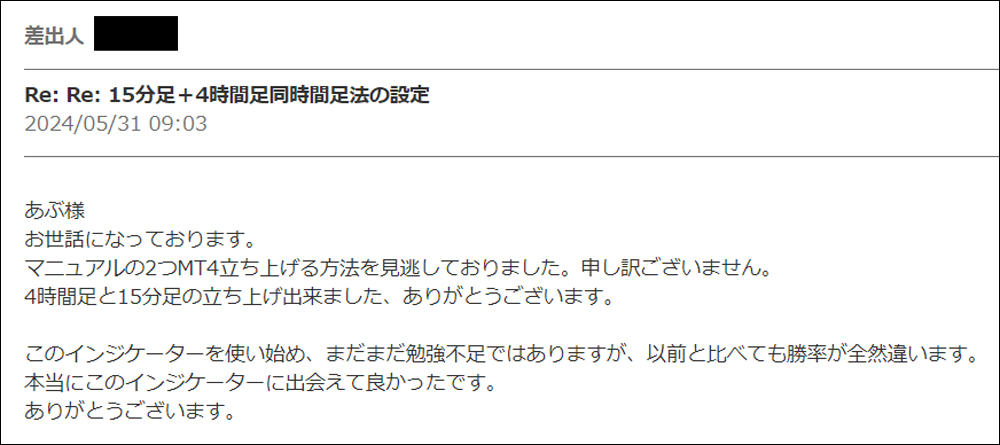
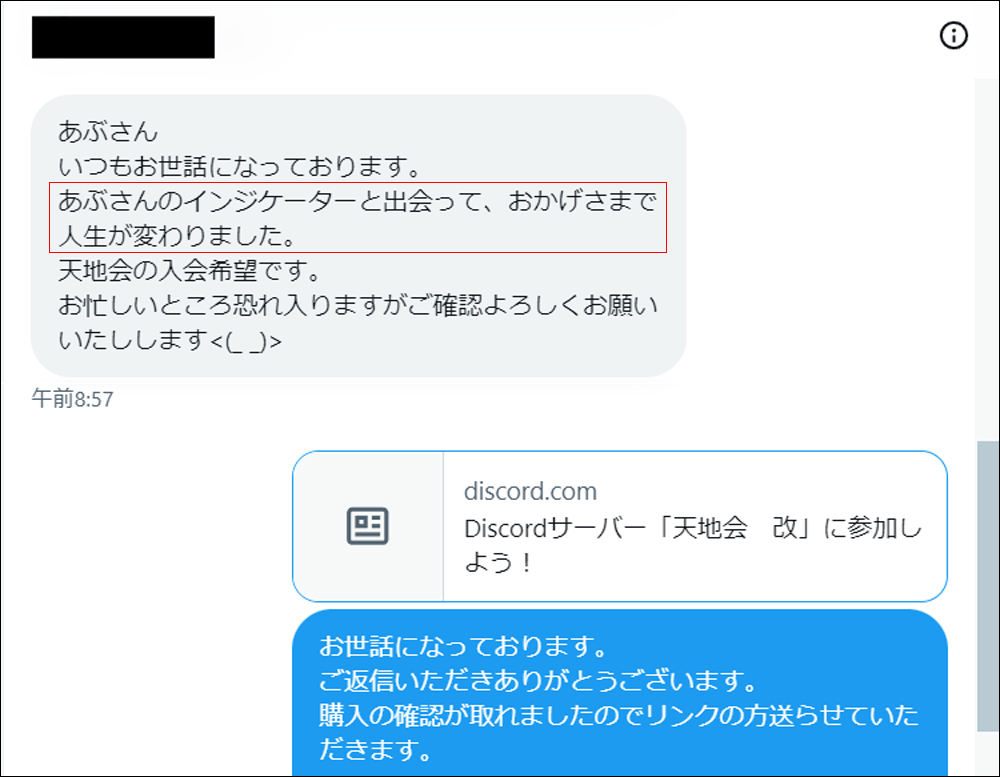
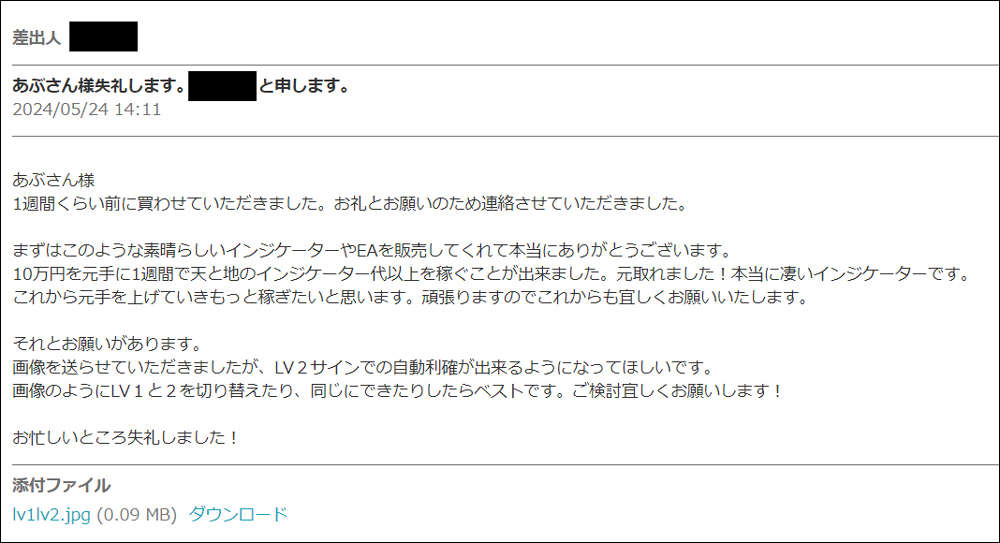
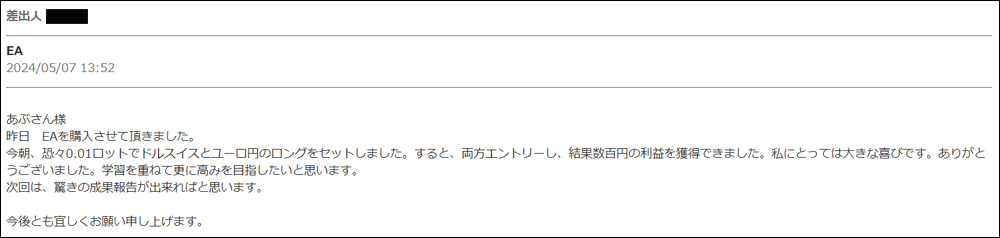
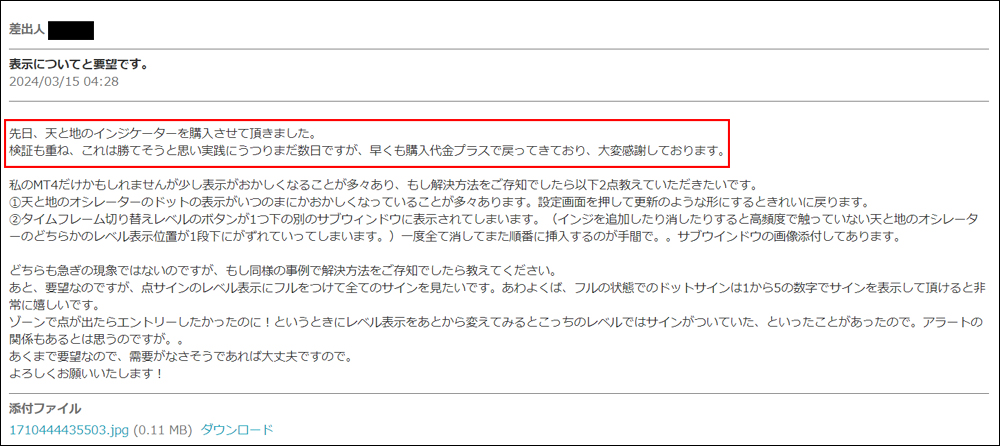
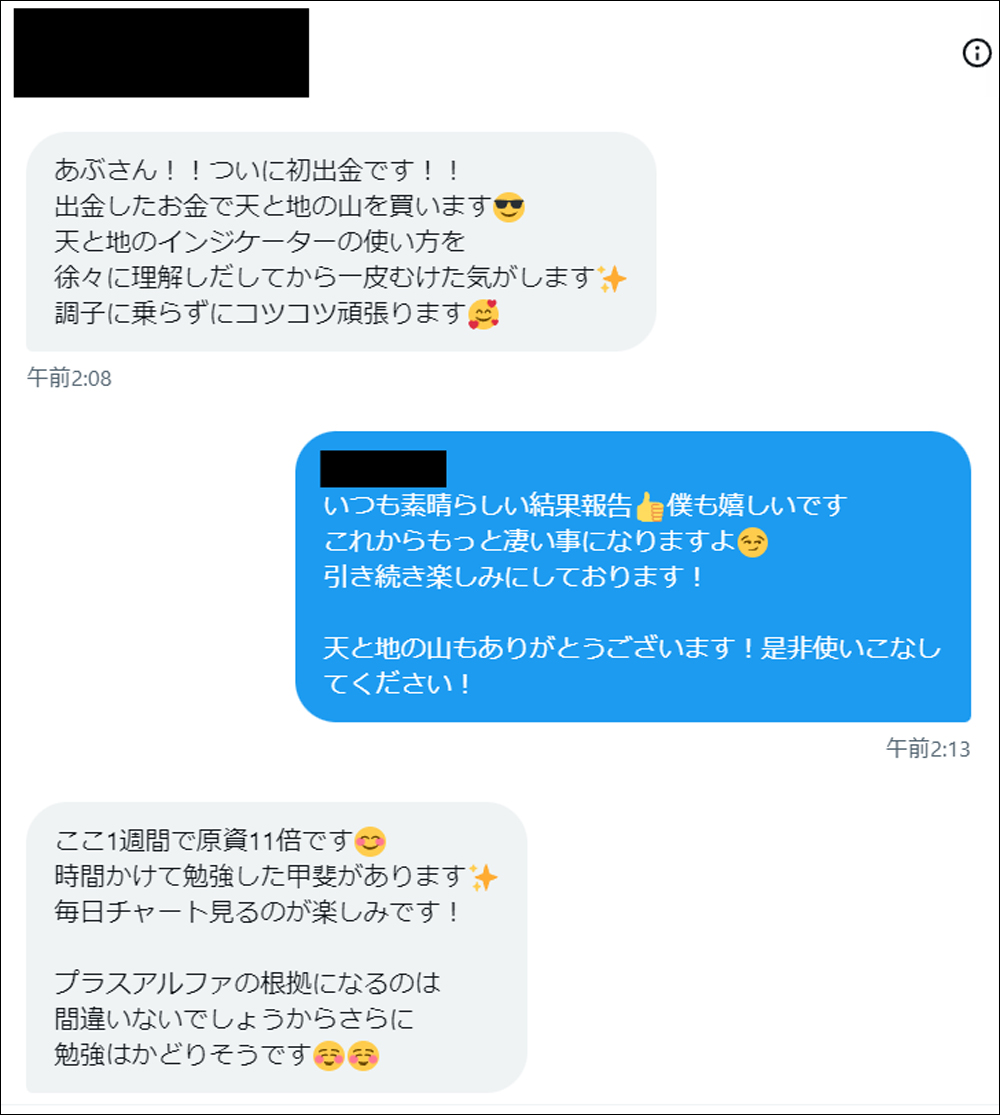
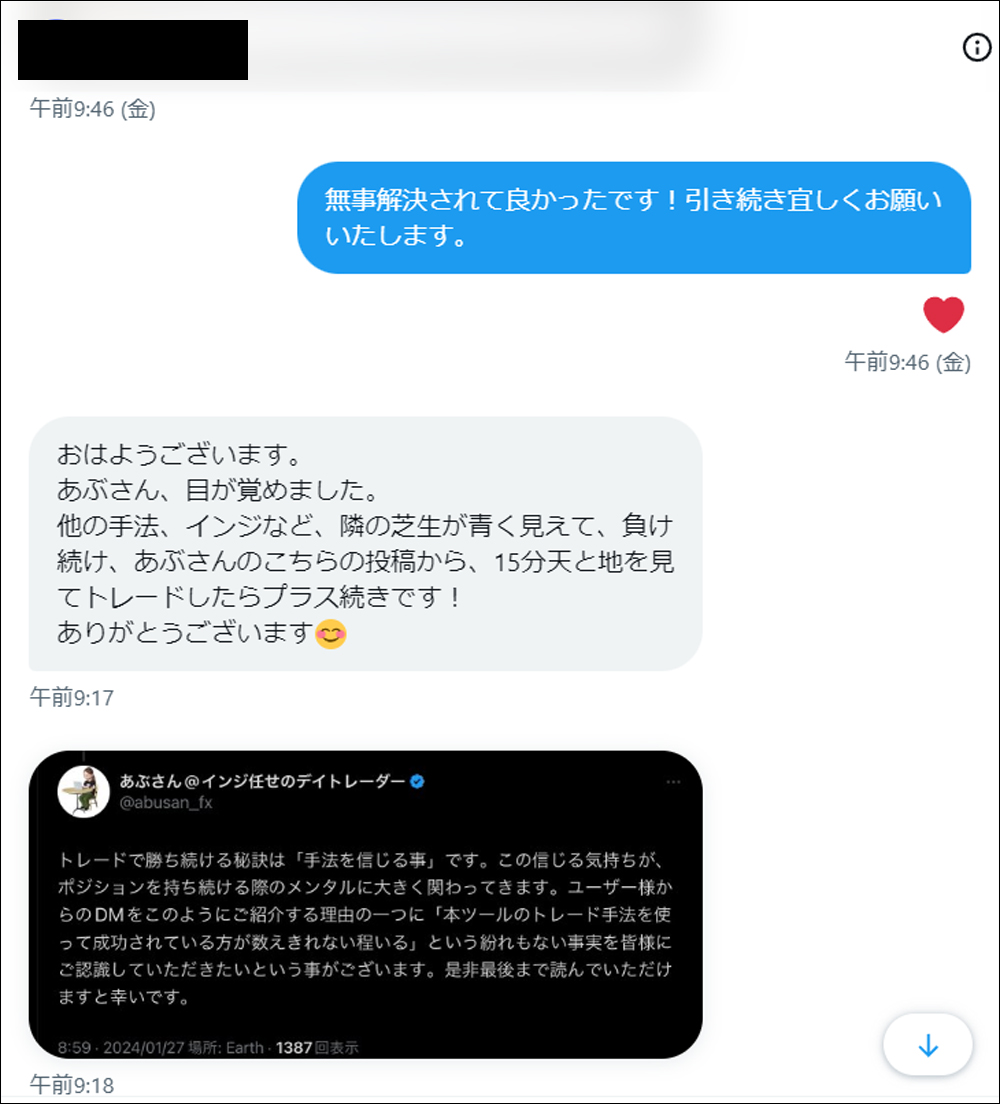
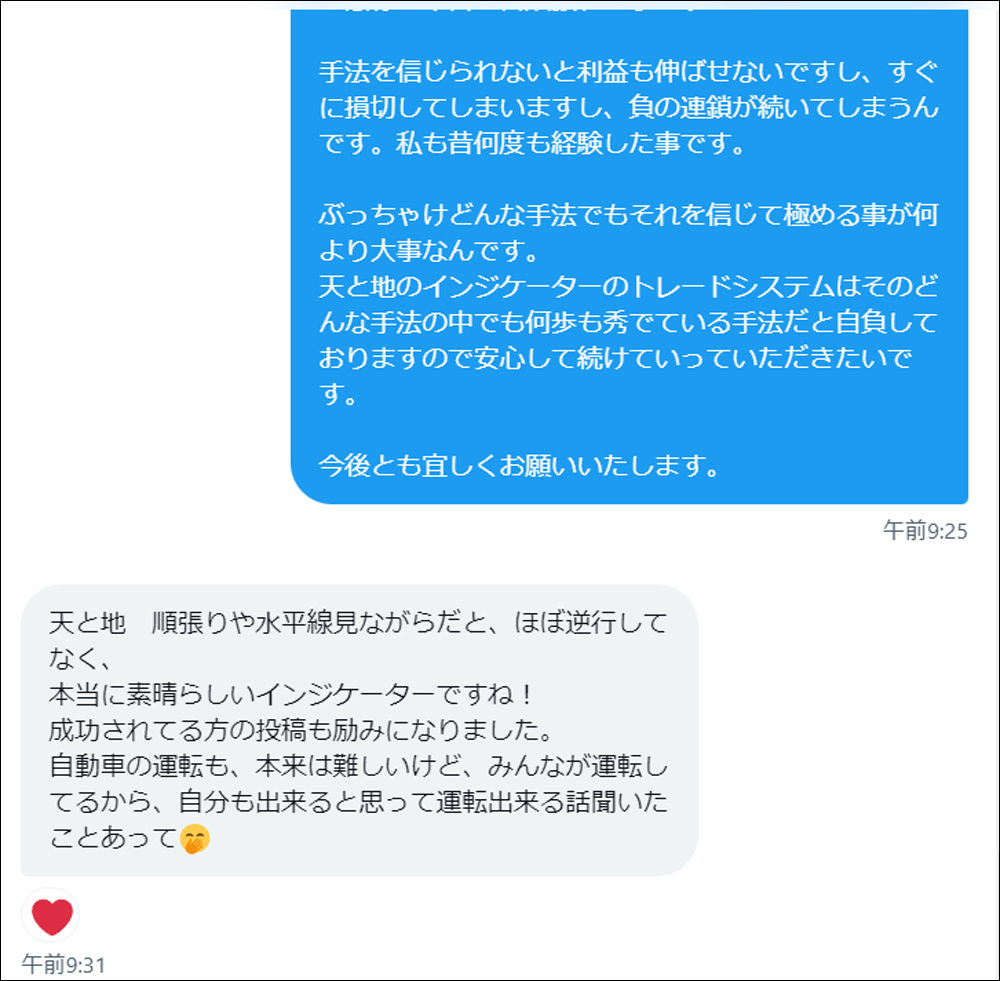
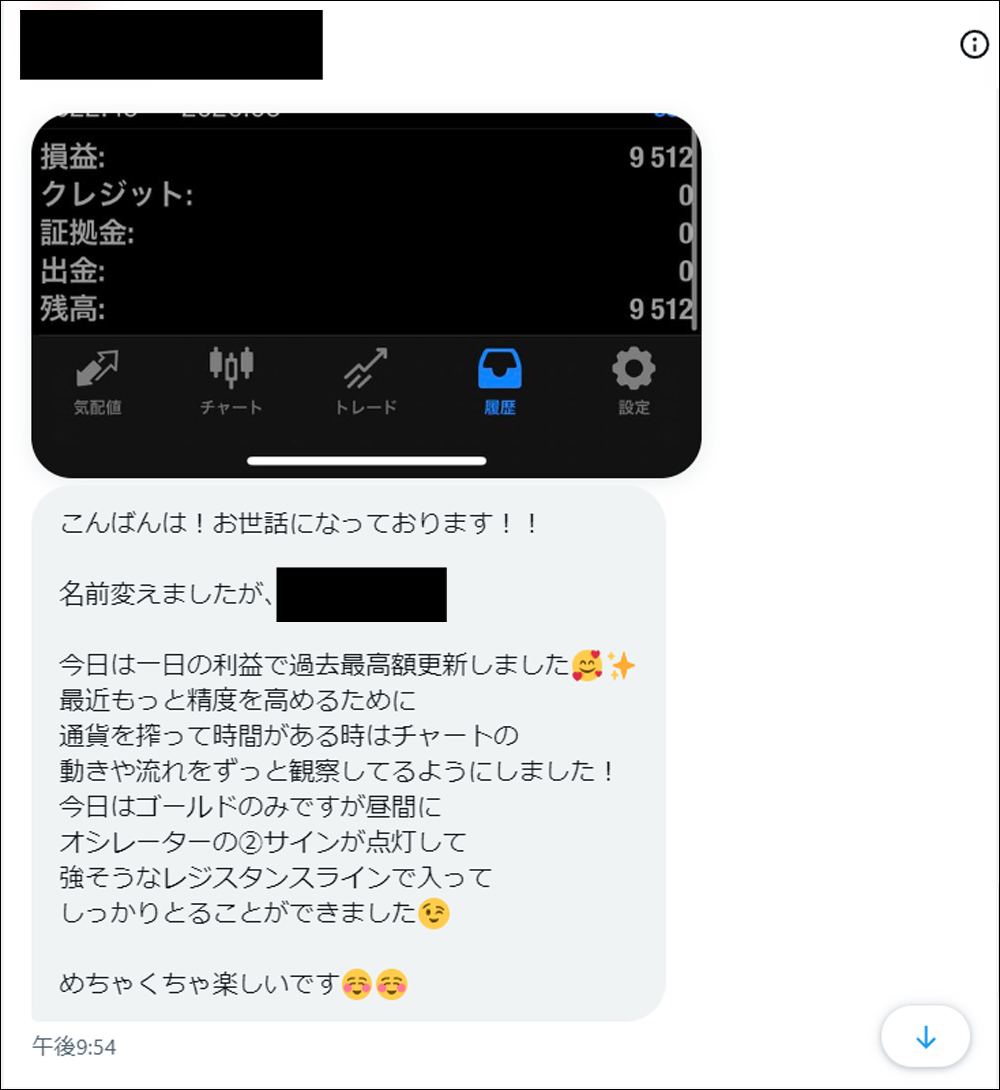
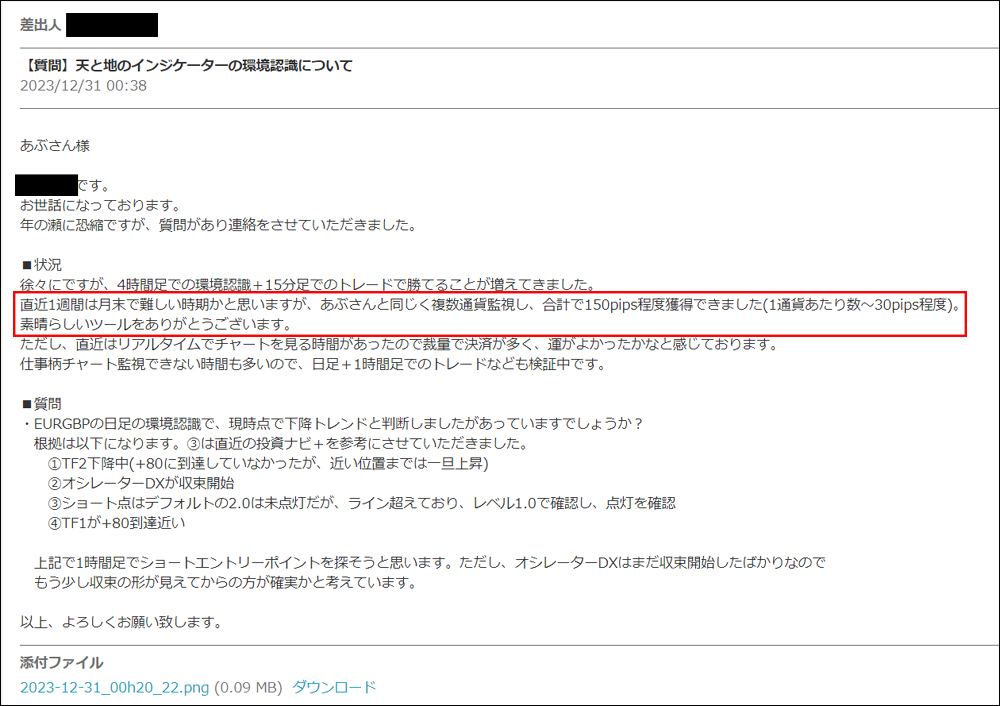
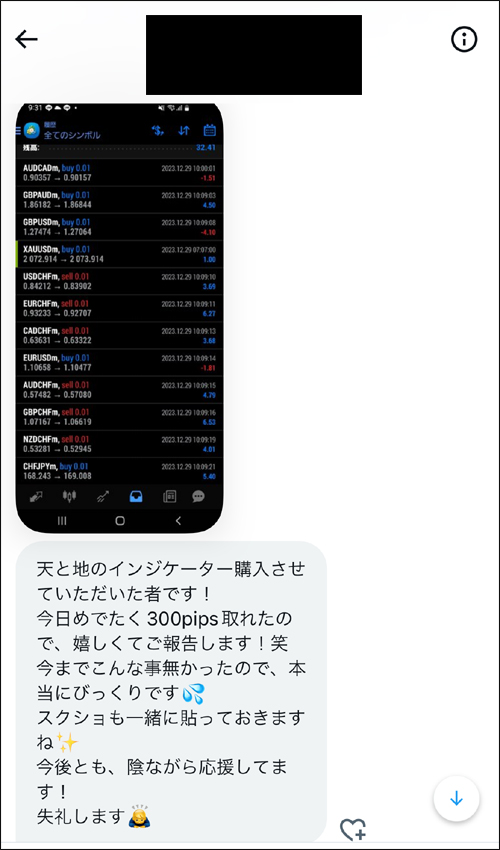
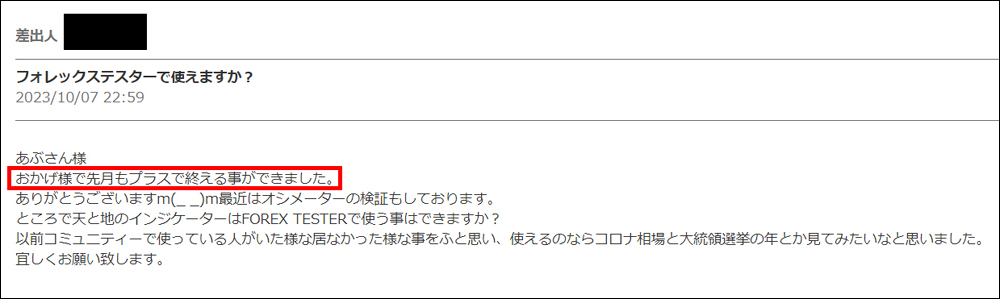
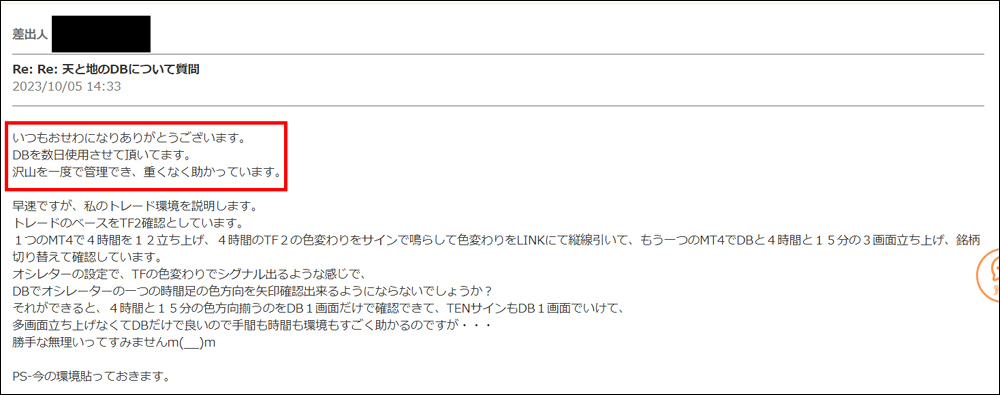
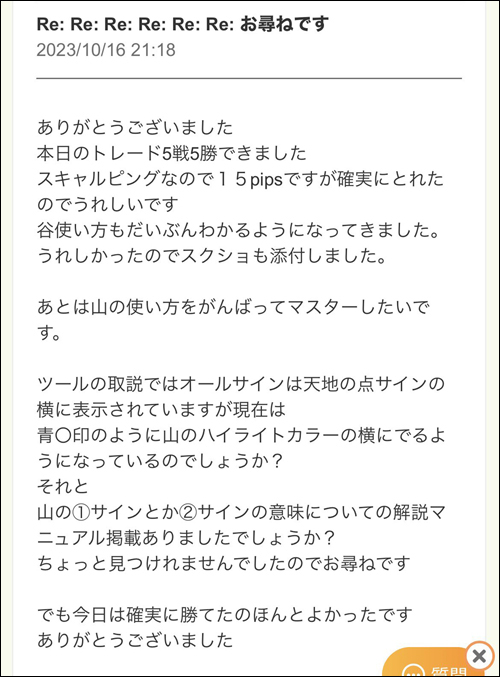
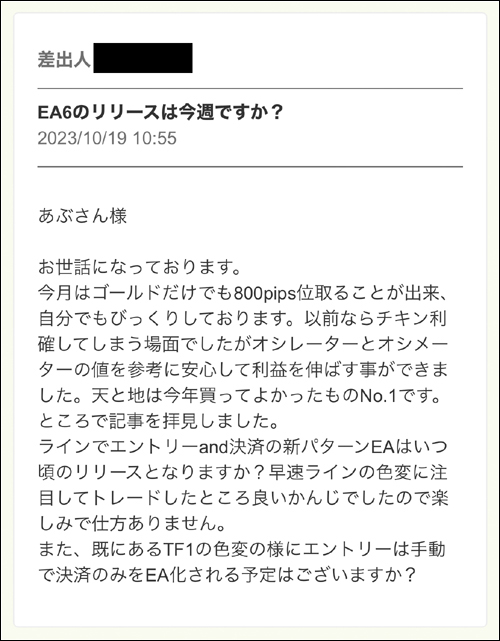
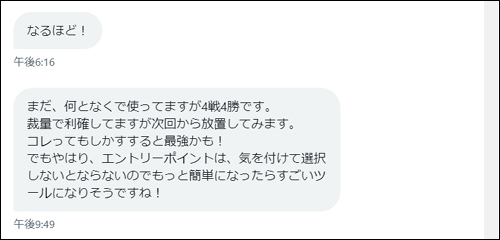
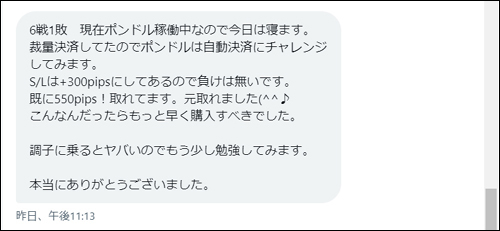
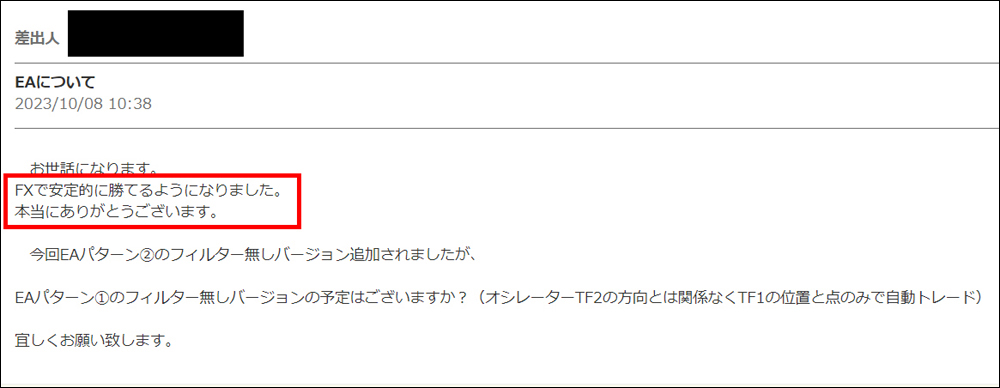
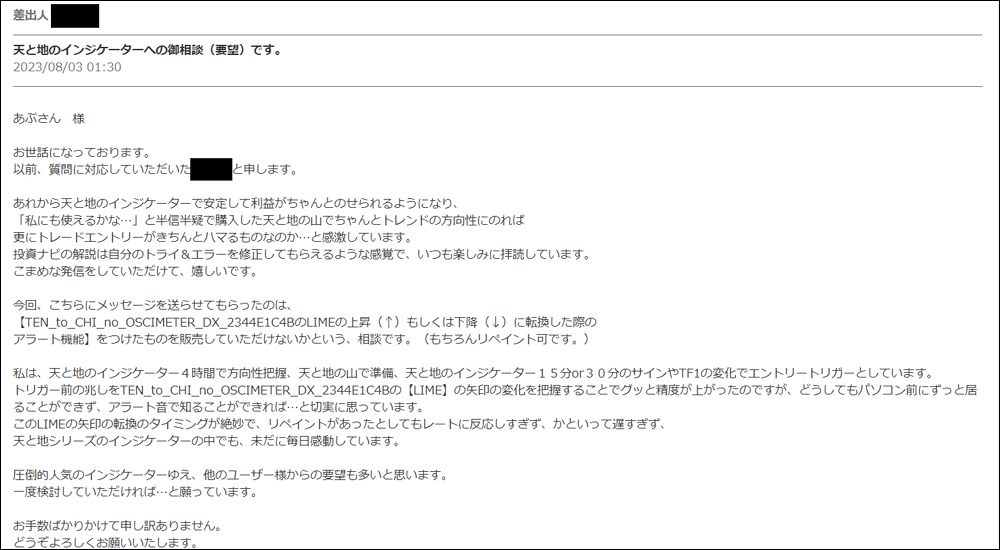
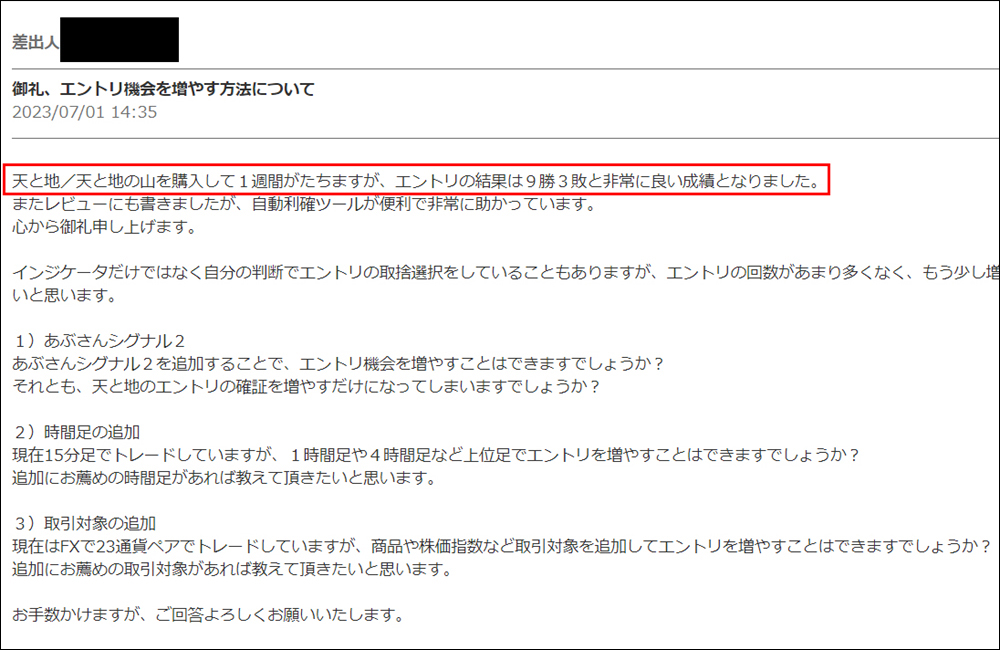
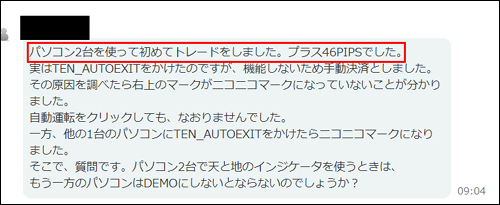
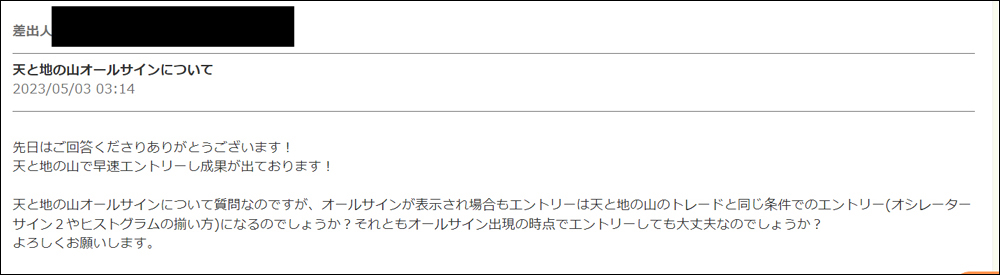
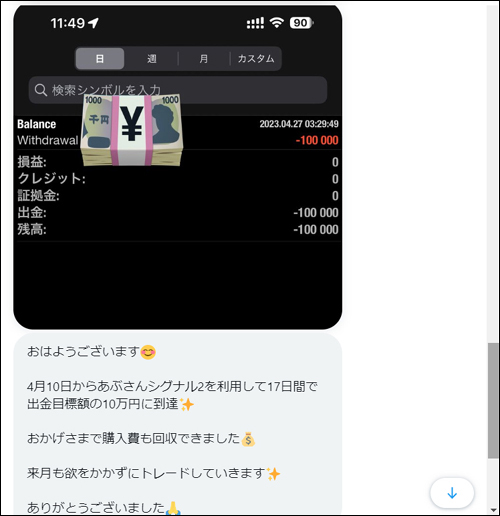
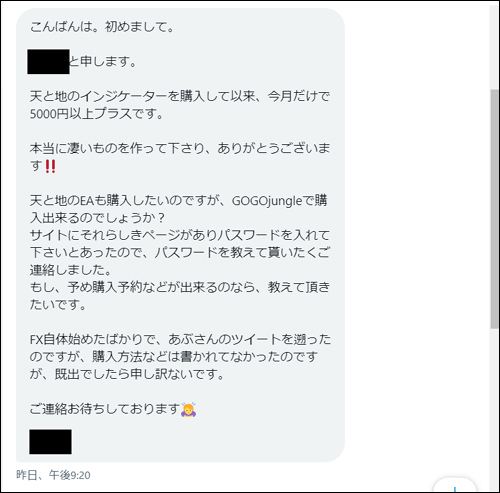
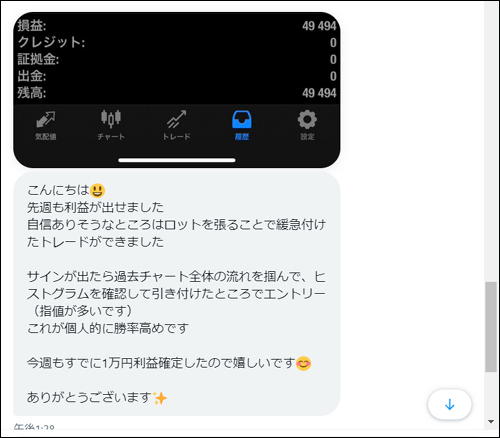
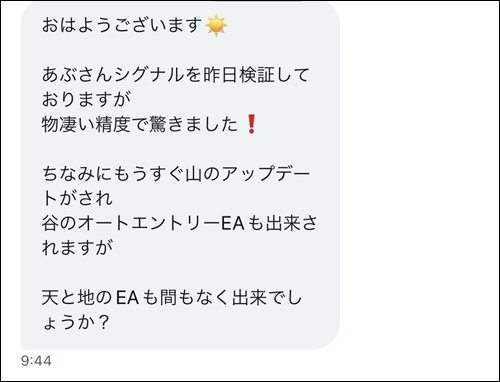
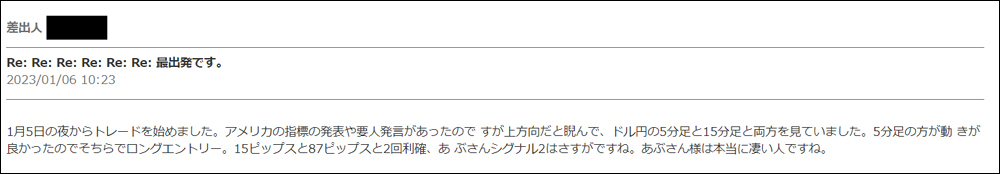
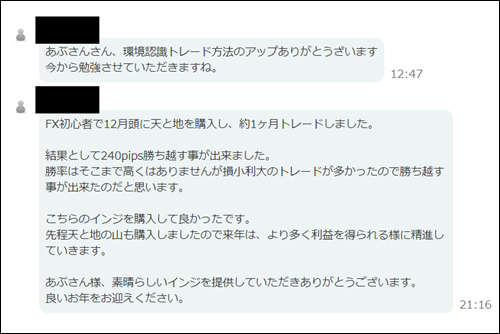
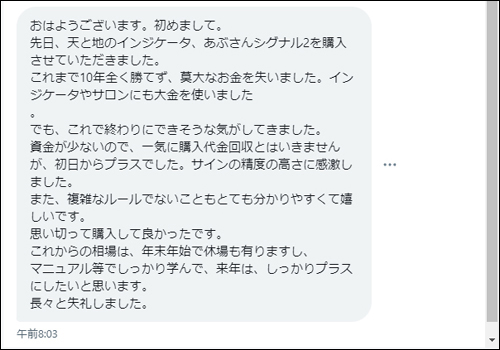
・Feedback from users who actually used the Ten to Chi indicators (DM version)
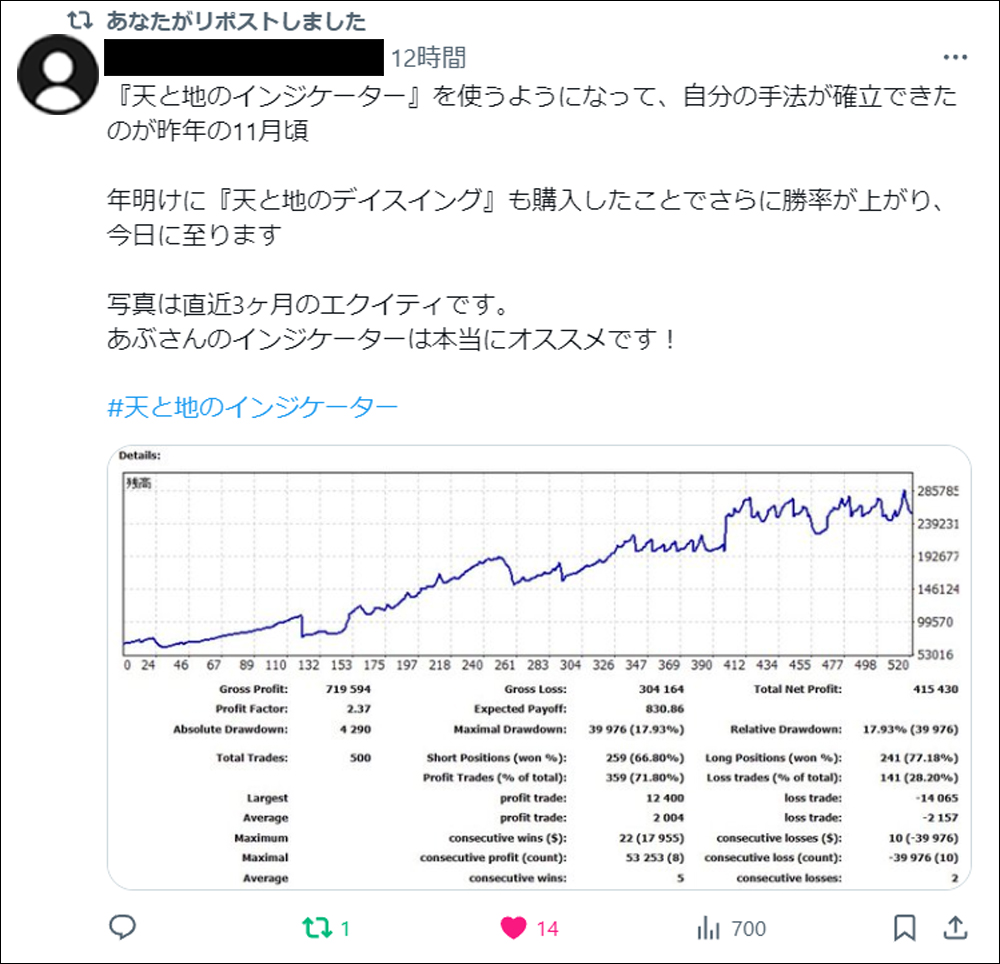
・I searched for “#Ten to Chi Indicator”
・We introduce posts from monitors who actually used the Ten to Chi Daiswing
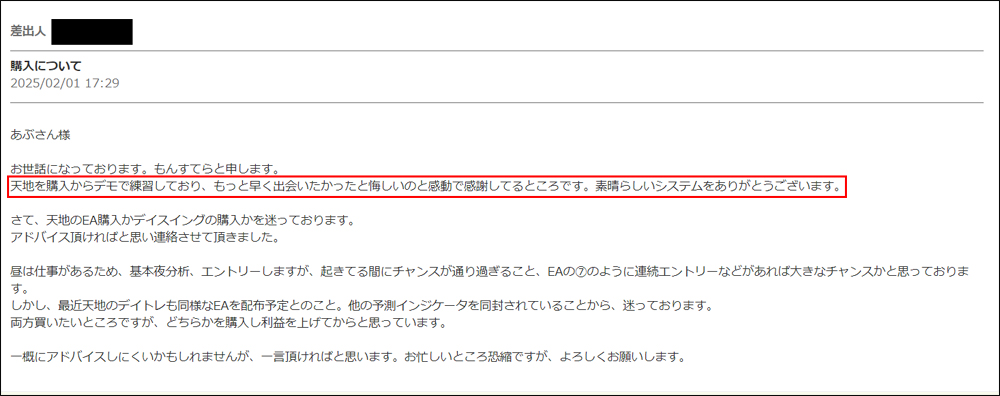
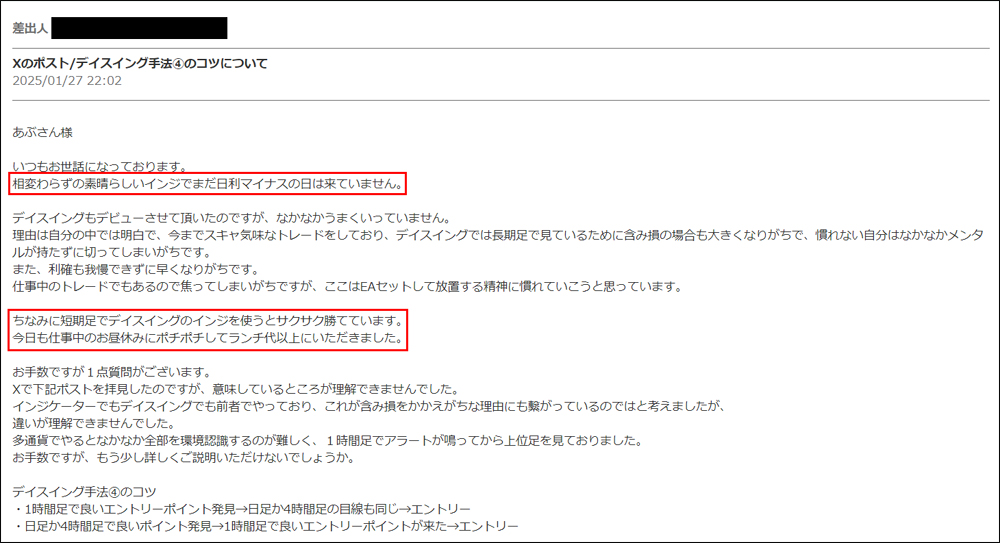
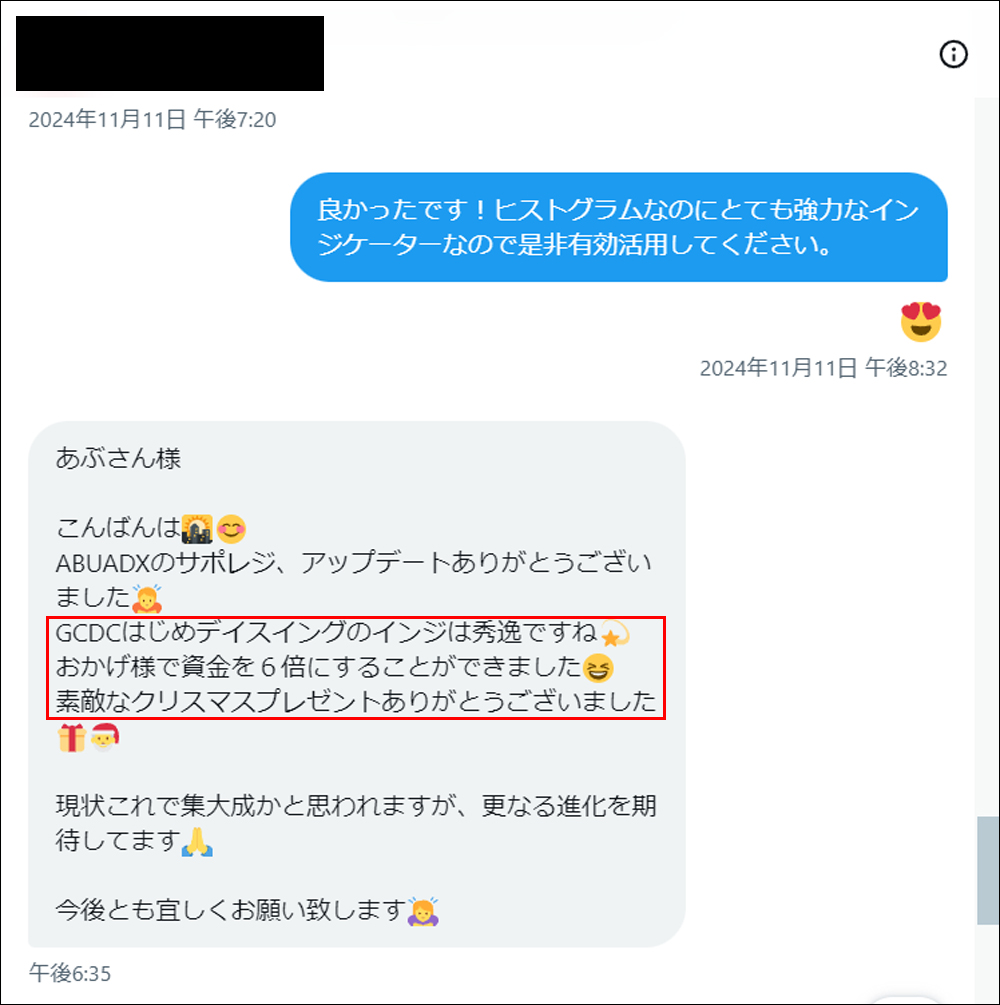
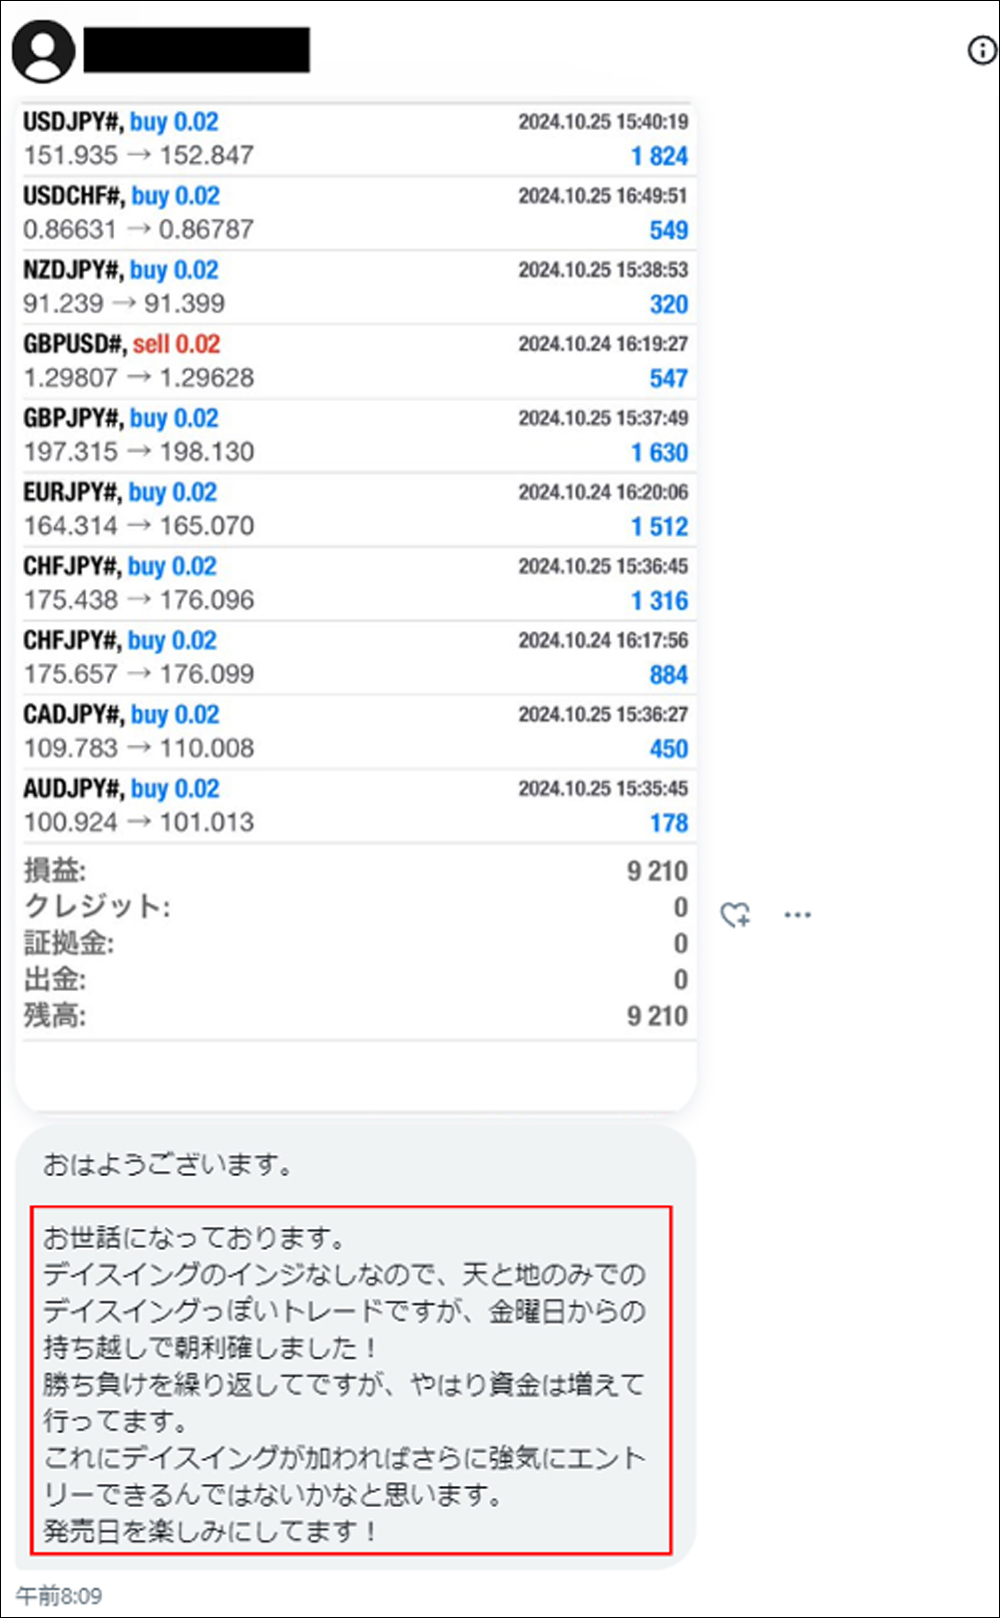
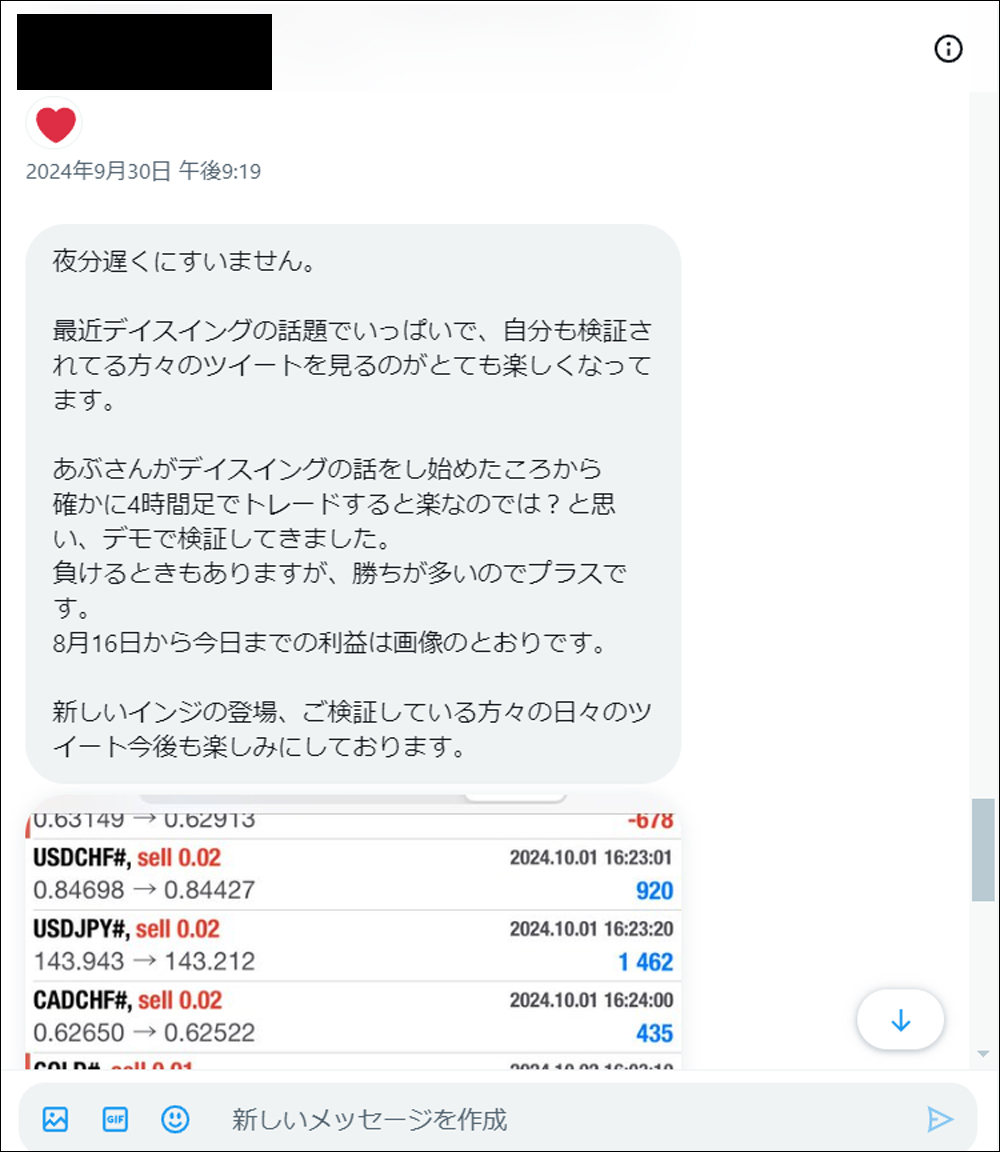
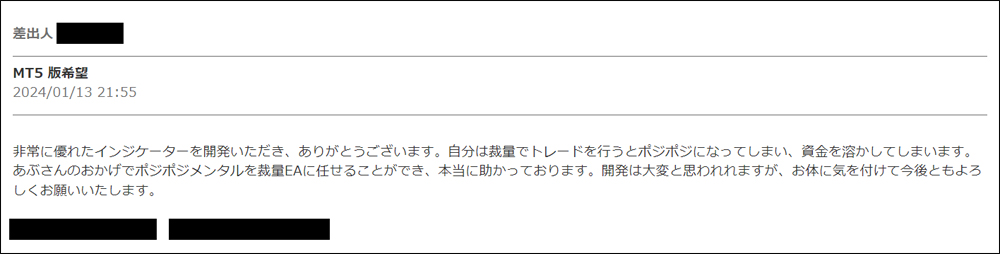
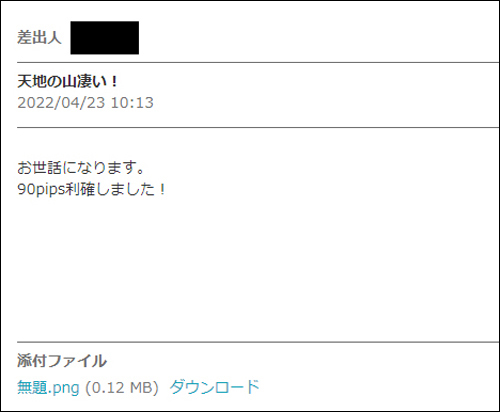
・Feedback from users who actually used the Ten to Chi Daiswing

・Ten to Chi Indicator is a trading method using an original indicator developed by me, Abusan, released in February 2022.Thanks to everyone’s support,「GogoJungle Award 2022, 2023, 2024 has been awarded for three consecutive years.
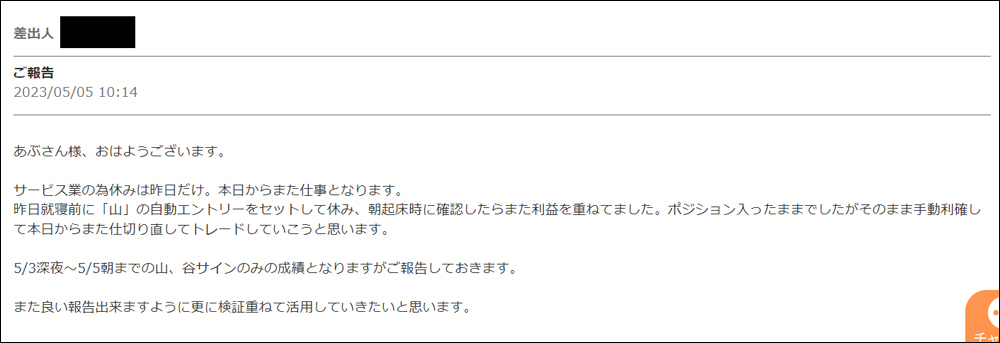
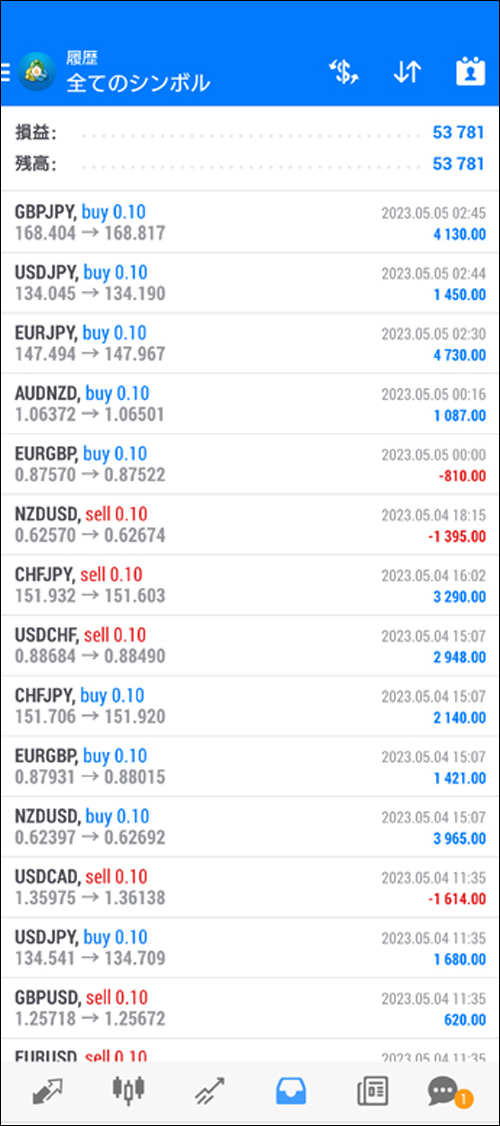
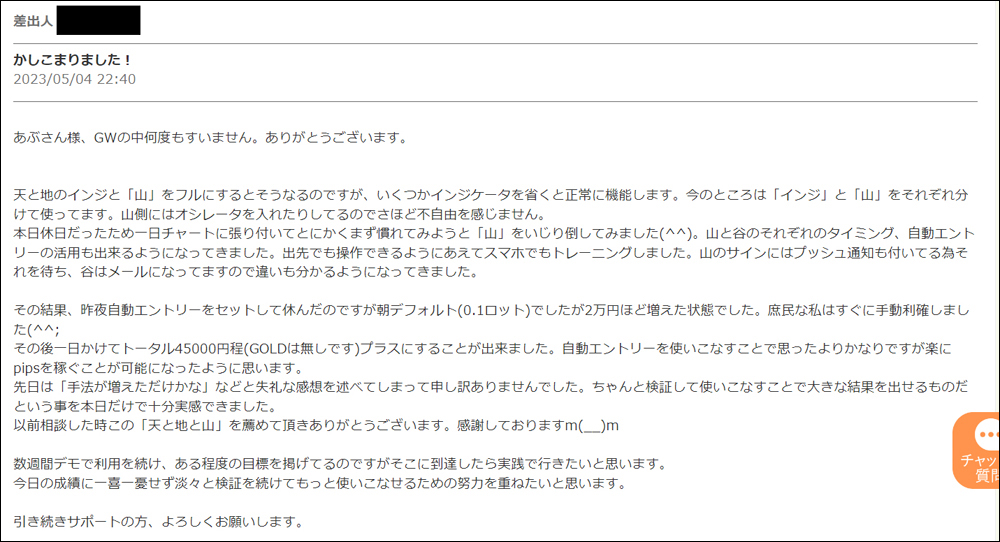
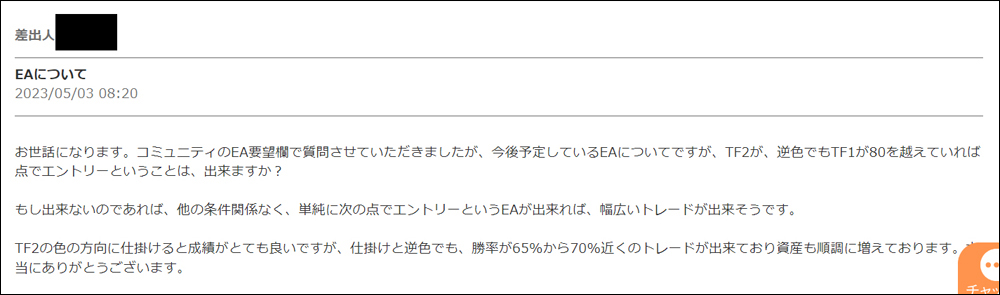
・In this article,“Ten to Chi Indicator” is used to validate and discuss the method of“Ten to Chi Daiswing”Ten to Chi Daiswing is examined. For the basic trading method of the Ten to Chi Indicator, please refer to articles published before August 2024.


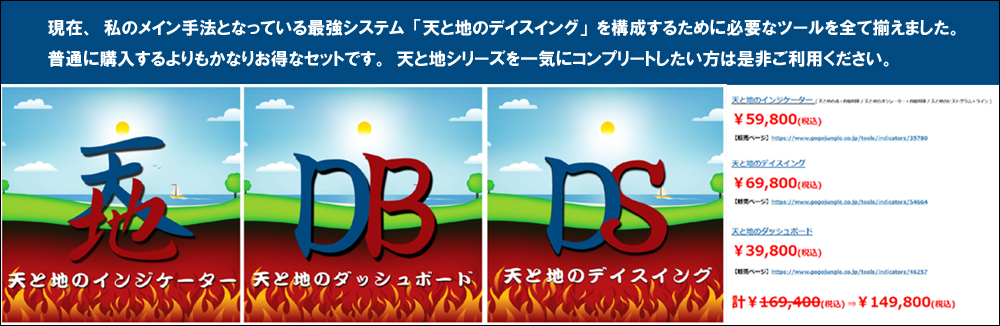
【Limited Release】Ten to Chi Full Set
【Abusan / Special Video Vol.1】Over 3,200 devoted users! Are you still trading FX without “Ten to Chi”? Why not relax while earning?

【Abusan / Special Video Vol.2】Is it a difference in ability? No, it's a difference in gear. Those who don’t use this will be vastly behind.


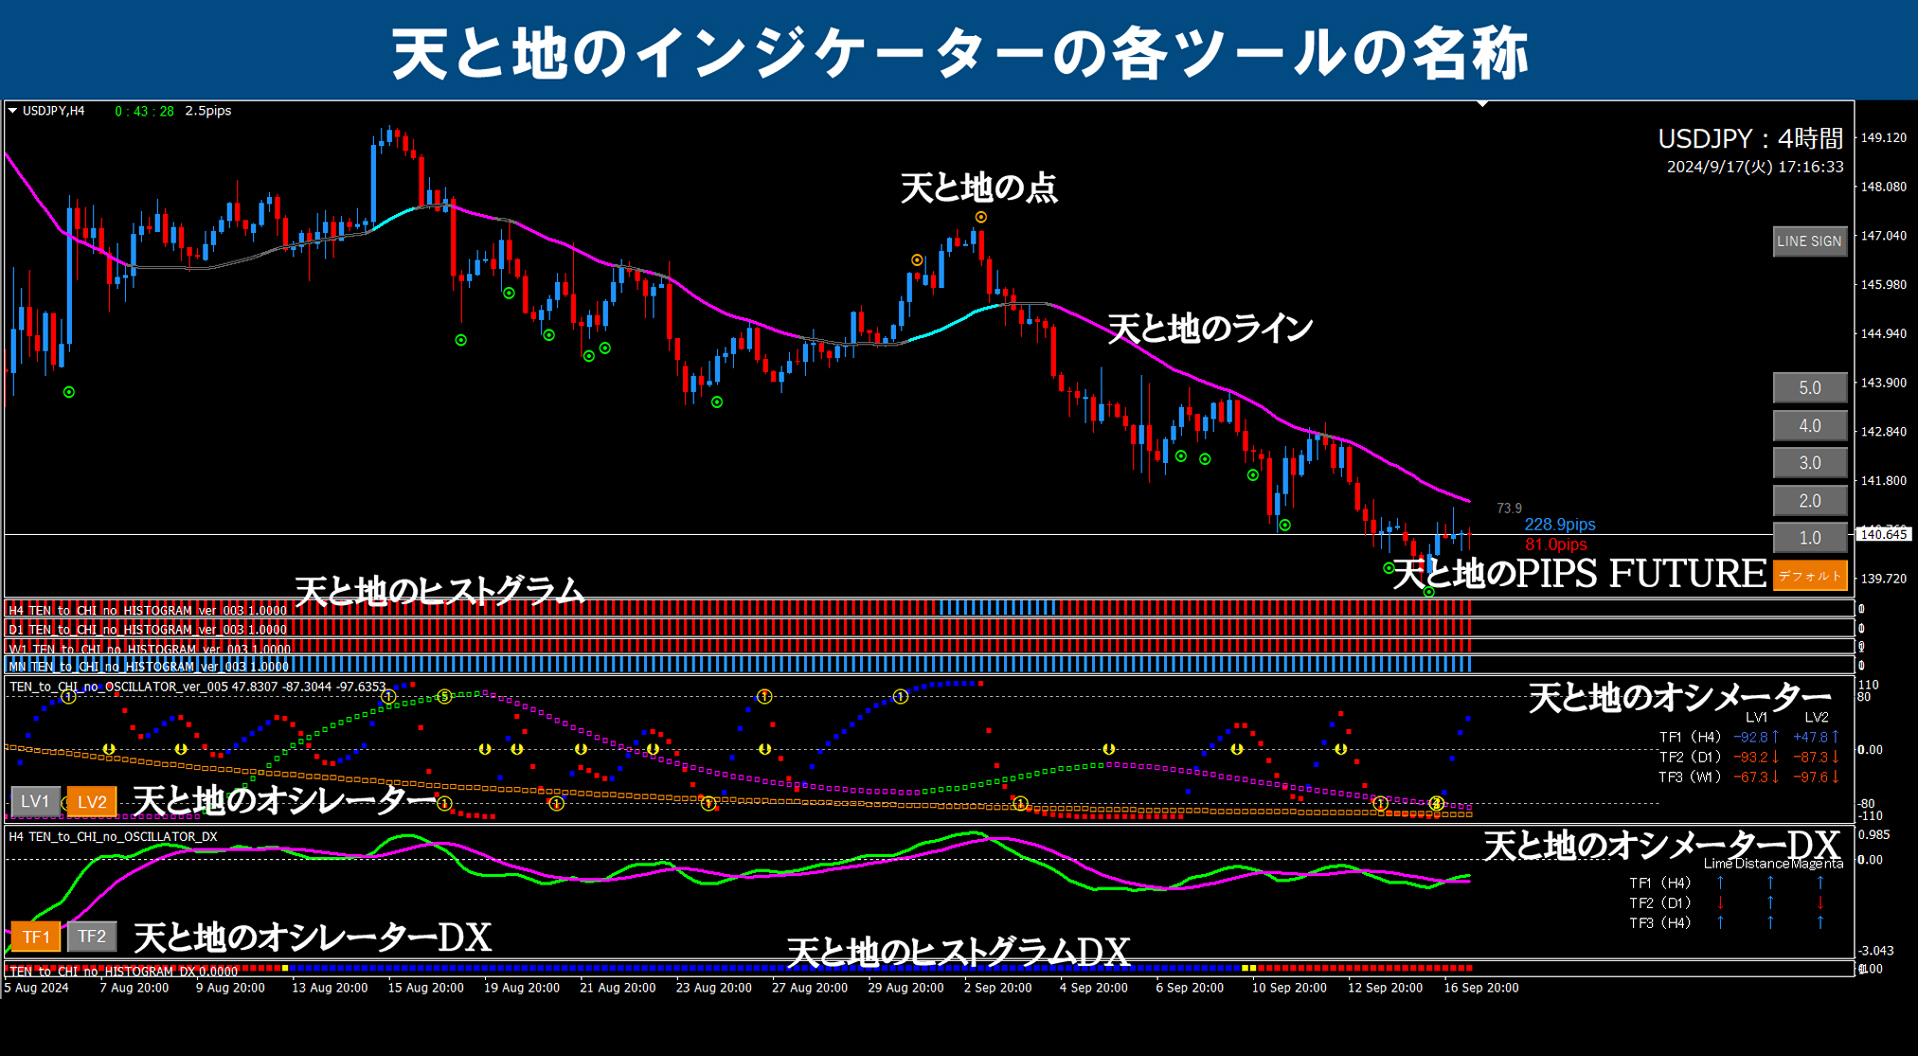
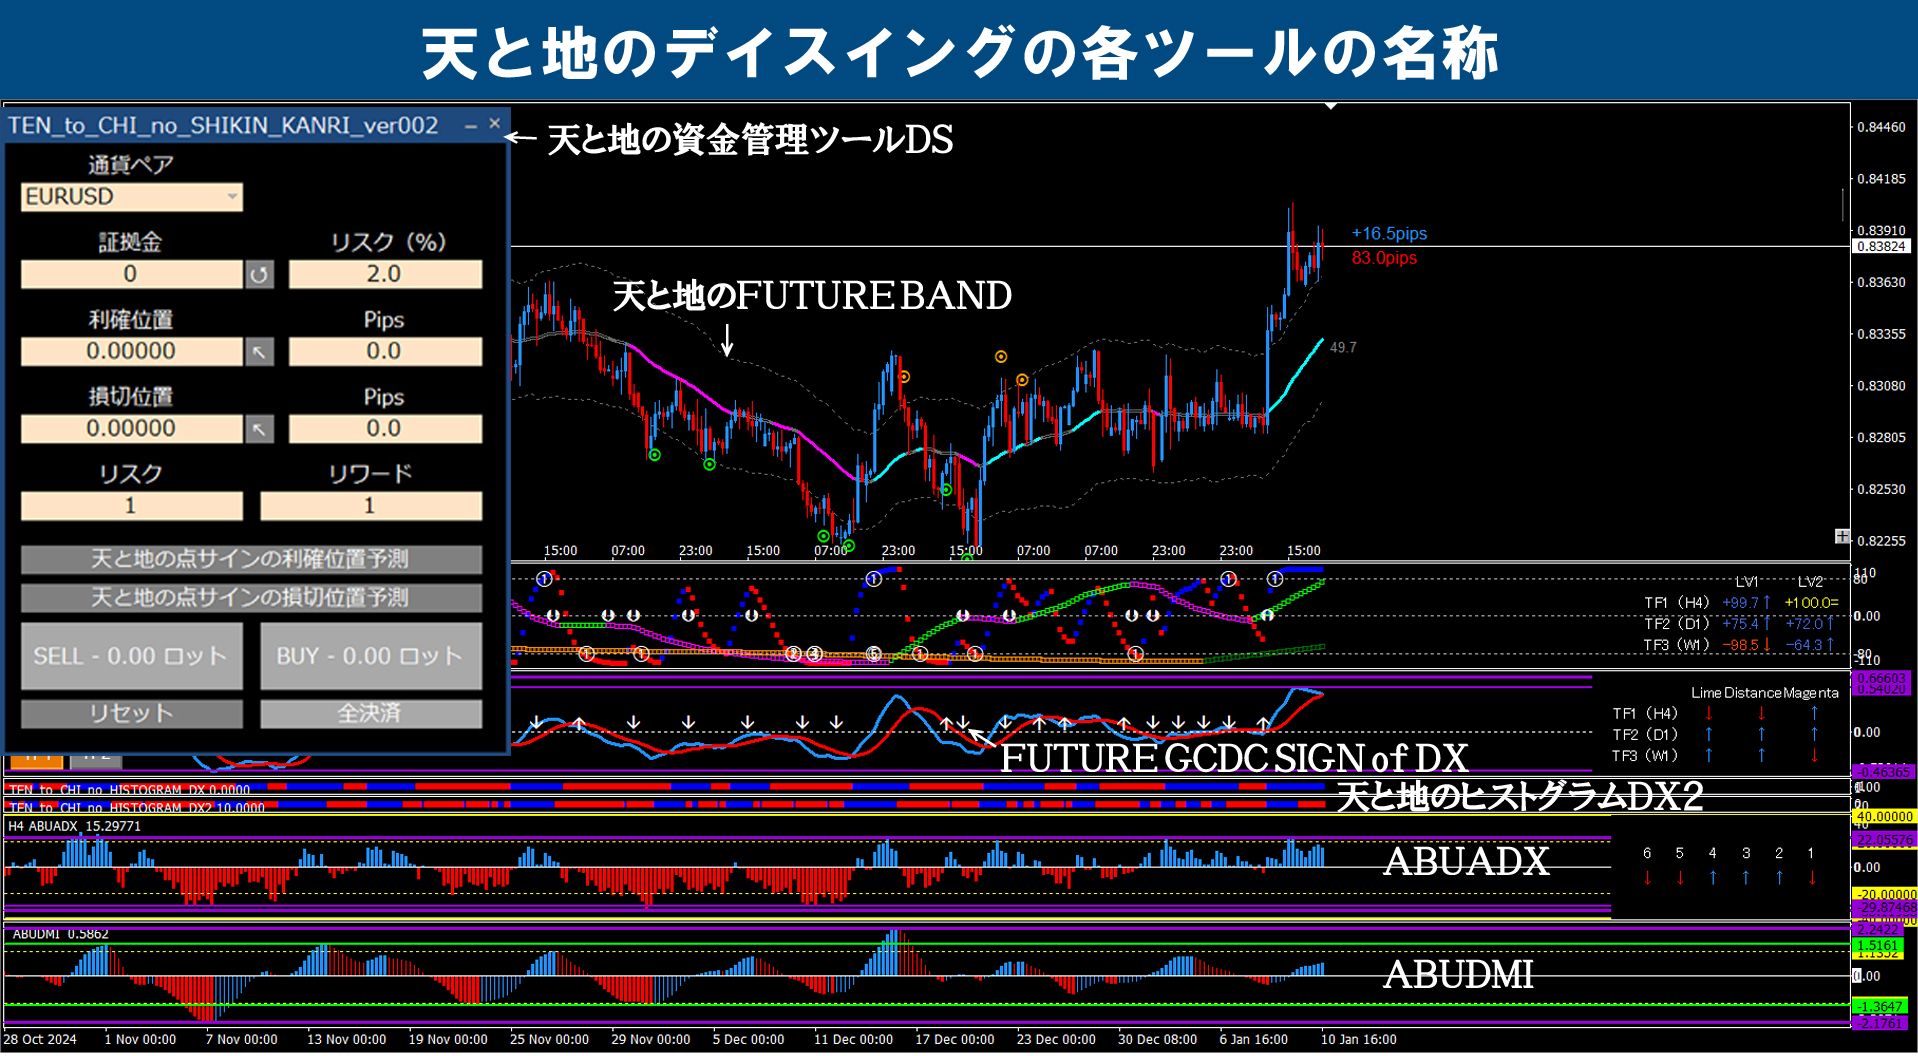
※Regarding the specialized terms used on this blog, please refer to the image below. (All images can be enlarged by clicking.)


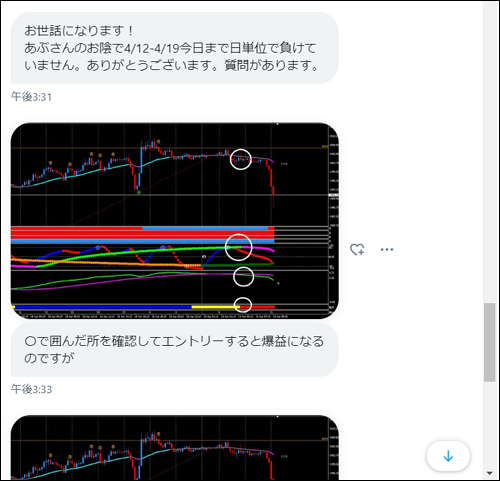
Dollar/Yen (USDJPY) / 1-hour chart + 4-hour chart + daily chart historical verification
※ Yellow dotted line indicates all timeframes drawn at the same location.
※ Yellow circles denote important points.
※ Clicking the chart will enlarge it.
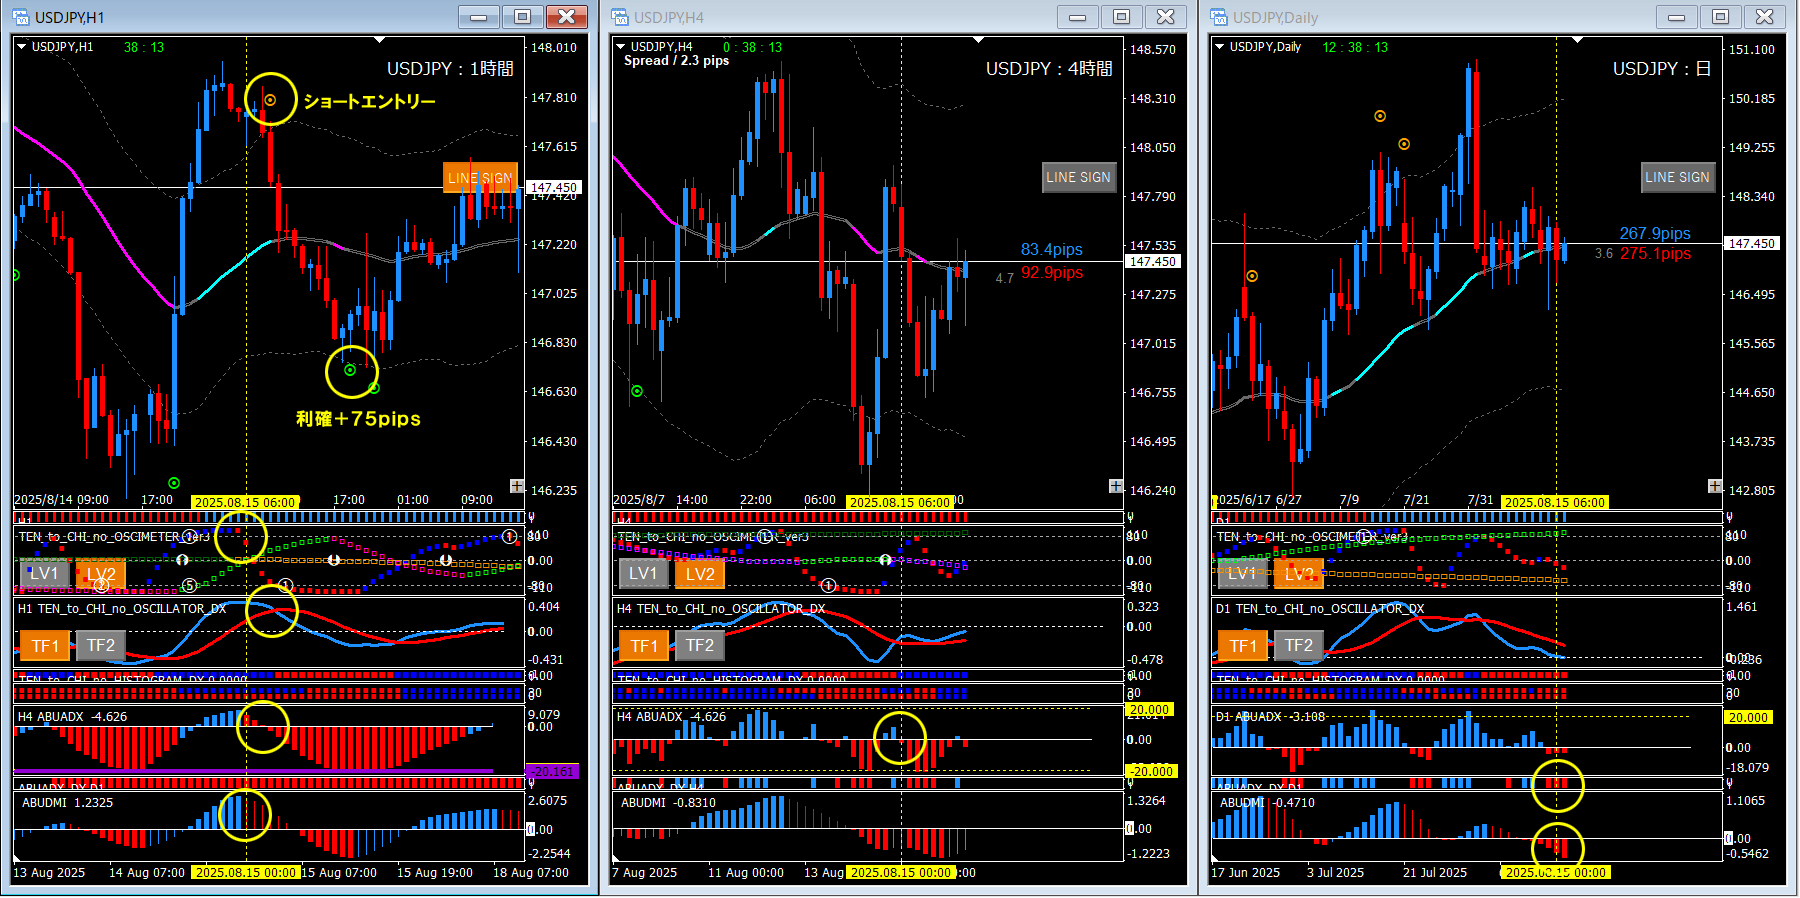
■ 1-hour chart (left: entry chart)
・ Point sign entry
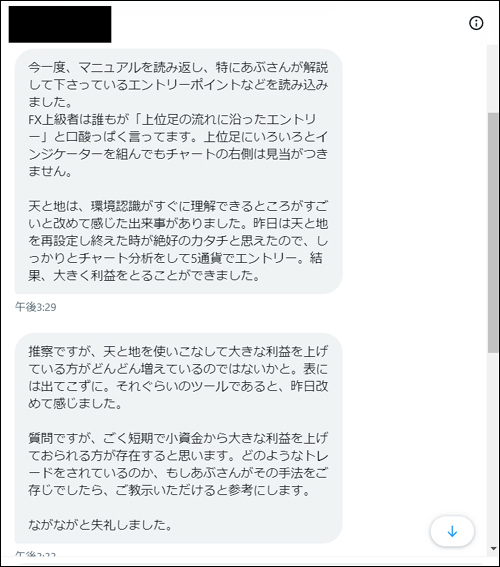
■ 4-hour chart (center: market overview chart)
・ABUADX (zero line)
■ Daily chart (right: market overview chart)
・ABUADX_DX (red)
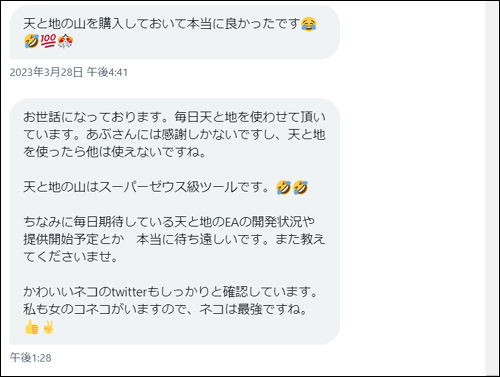
■ Summary
This time, we will look for a short entry point on the 1-hour chart based on the lighting of ABUADX_DX on the daily chart. Although the basis is only ABUADX_DX on the daily chart, multiple good patterns can be confirmed on the 1-hour chart, so it would be okay to adopt ABUADX_DX on the daily chart as the entry criterion as is.
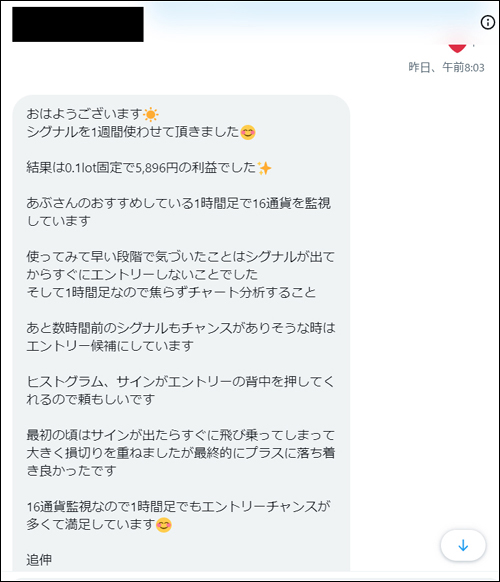
■ If you use DSATEA
Because I judged a downward trend at the yellow dotted line, I will set DSATEA to short-only on the 1-hour chart for entry. As candidates for entry, it will likely be one of the four: Point Sign, Oscillator TF1 color change, Oscillator DX downward cross, ABUDMI.

I hope this is of some help to everyone.
Press the GOOD mark? to give me energy for future work. I would appreciate your cooperation for further motivation.
