
[The First Step of the Winning Class] It starts by believing in this technical indicator.
[First Step for Winners] It starts with believing in this technical indicator.
If you challenge with only a sign tool, you will remain on the losing side forever.
Winnershave standards to avoid hesitation.
ZoneBreaker Coreprovides those standardsas a zonethat are clearly visualized.
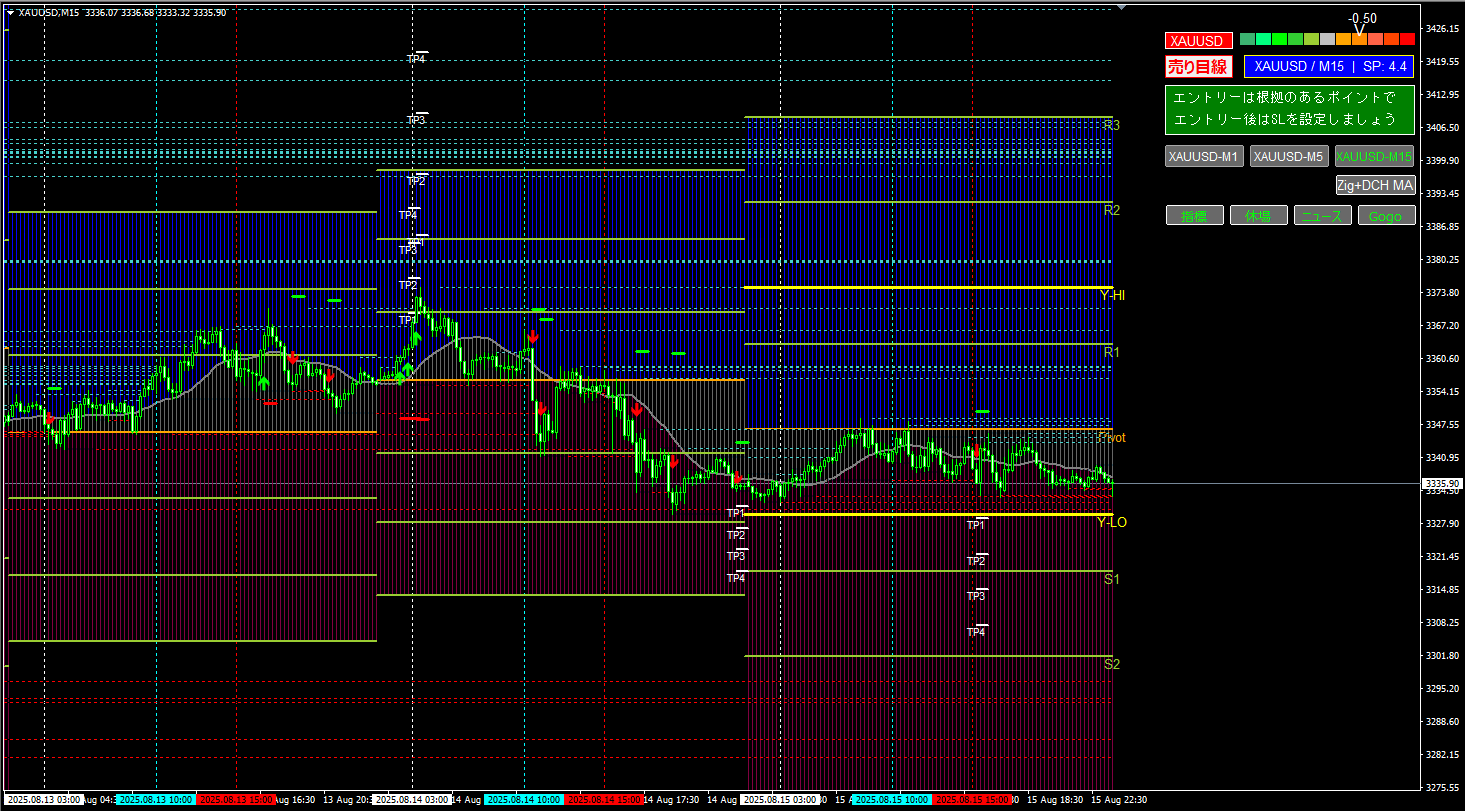
Why does it work
- Maximum fractal line:Past reversal points = price most watched by the market. First candidate for rebound/break.
- Pivot line (P・R/S):An intraday indicator calculated from the previous day's values.Aiming points for intraday landing/reversal.
- Previous day high/low (Y-Hi/Y-Lo):Today's turning point. Breaks through it, continuation; if it stops, a reversal warning.
Automatic drawing that looks like a “look-ahead”
These support and resistance lines aredrawn the moment you open the chart.
(See image)
What makes it look like it’s predicting the future is the following mechanism.
- Pivot & previous day high/low:From the previous day’s high, low, and close, for today’s portioncalculated all at onceandextended horizontally across the entire day.
- Maximum fractal:Extracts the latest swing high/low andextends horizontally to the current position. Immediate judgment on proximity reactions.
- Zone formation:Based on computed lines, automatically generates zones for“attack / wait / escape”. Reducing indecision.
Note: This is not guesswork; it is
objective automatic drawing based on prior-day data and recent swing.
How to use is simple
When price approaches the lines above,attack / wait / escapeimmediately decide.
ZoneBreaker Core thenzonesthese insights into,
showing “where not to trade.”
From being tossed by the market to being able to read it.
The first step to becoming a winner isto use ZoneBreaker Coreas your standard.