

[August 10, 2025] Verification of the De-switching Method of Heaven and Earth Indicator (Bitcoin)
This time, we will introduce the entry point for Bitcoin (BTC).

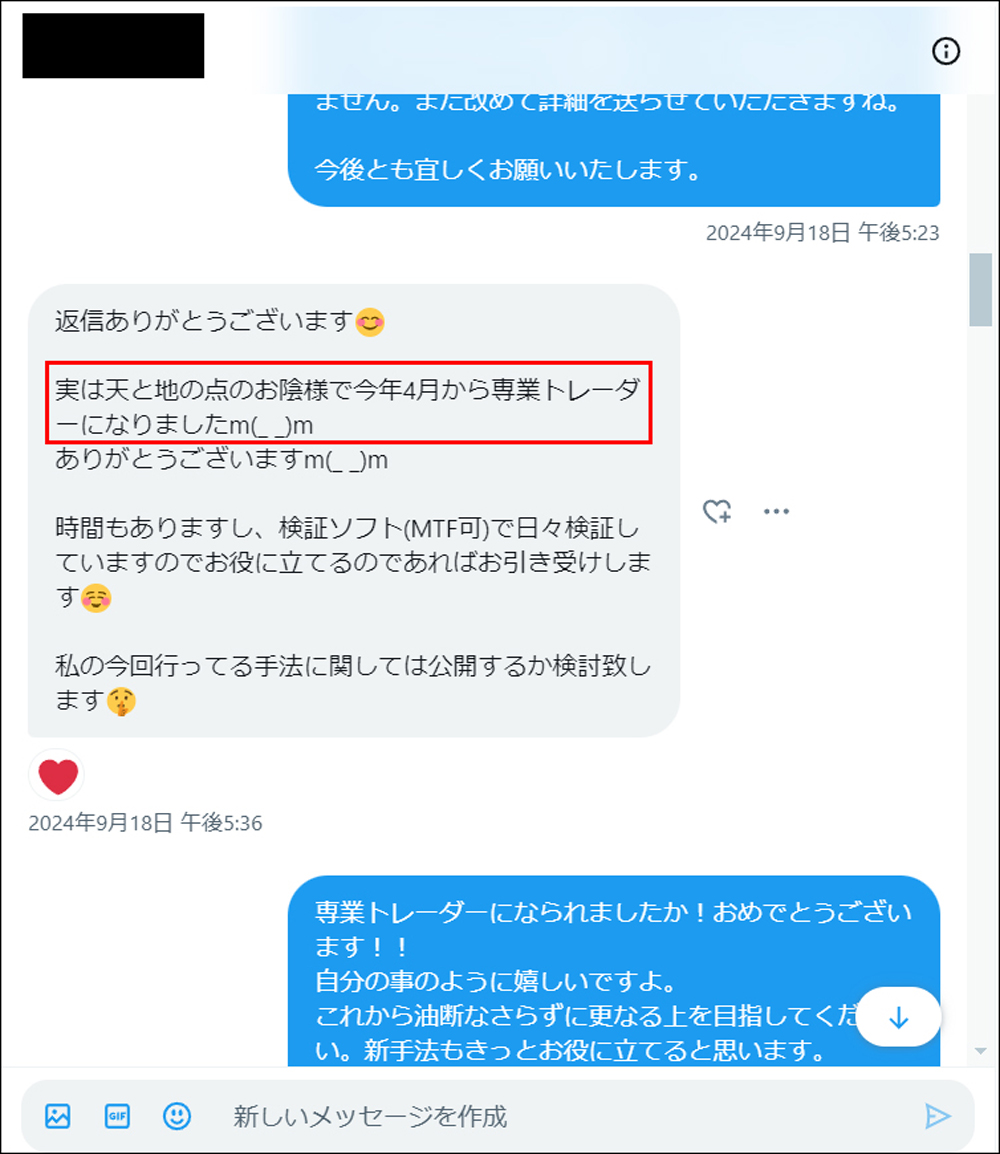
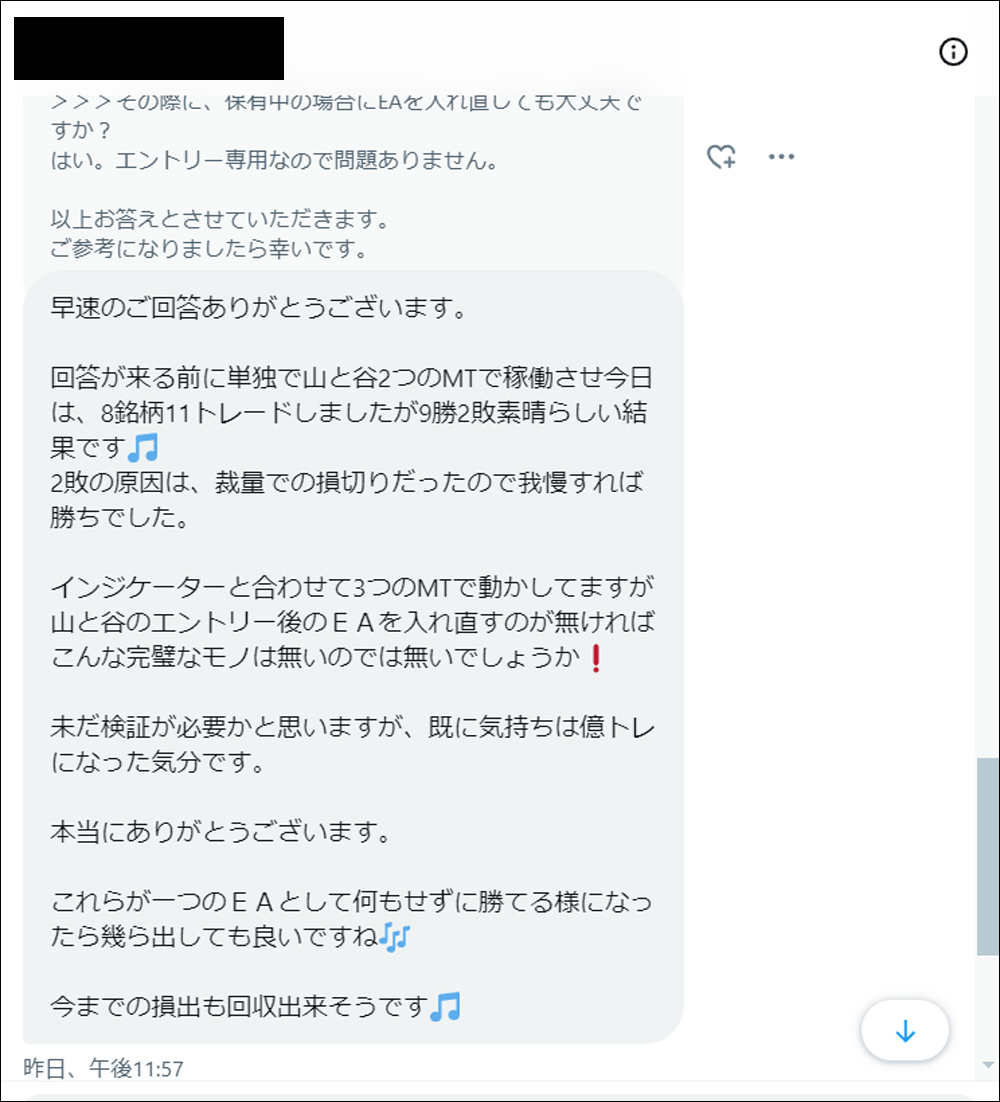
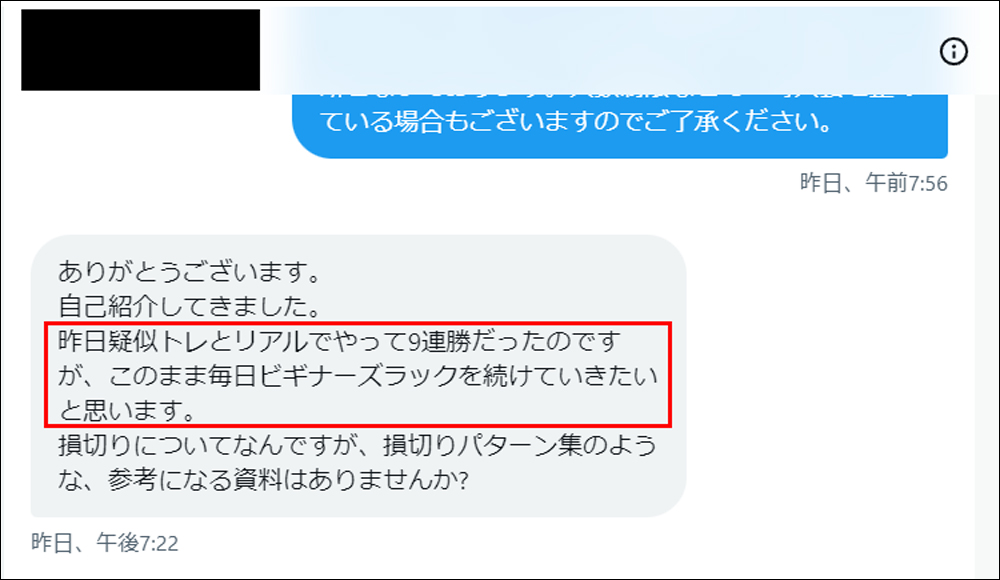
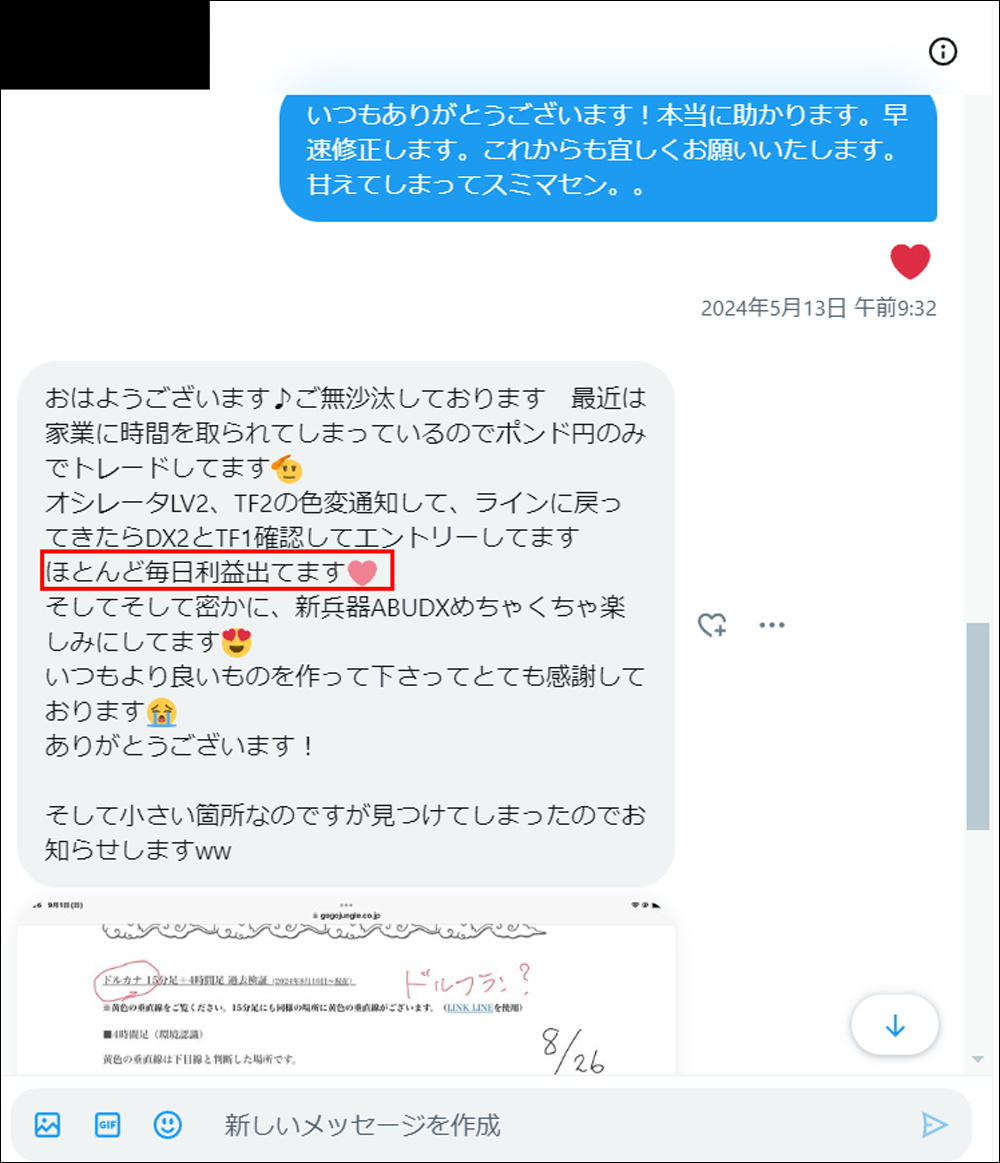

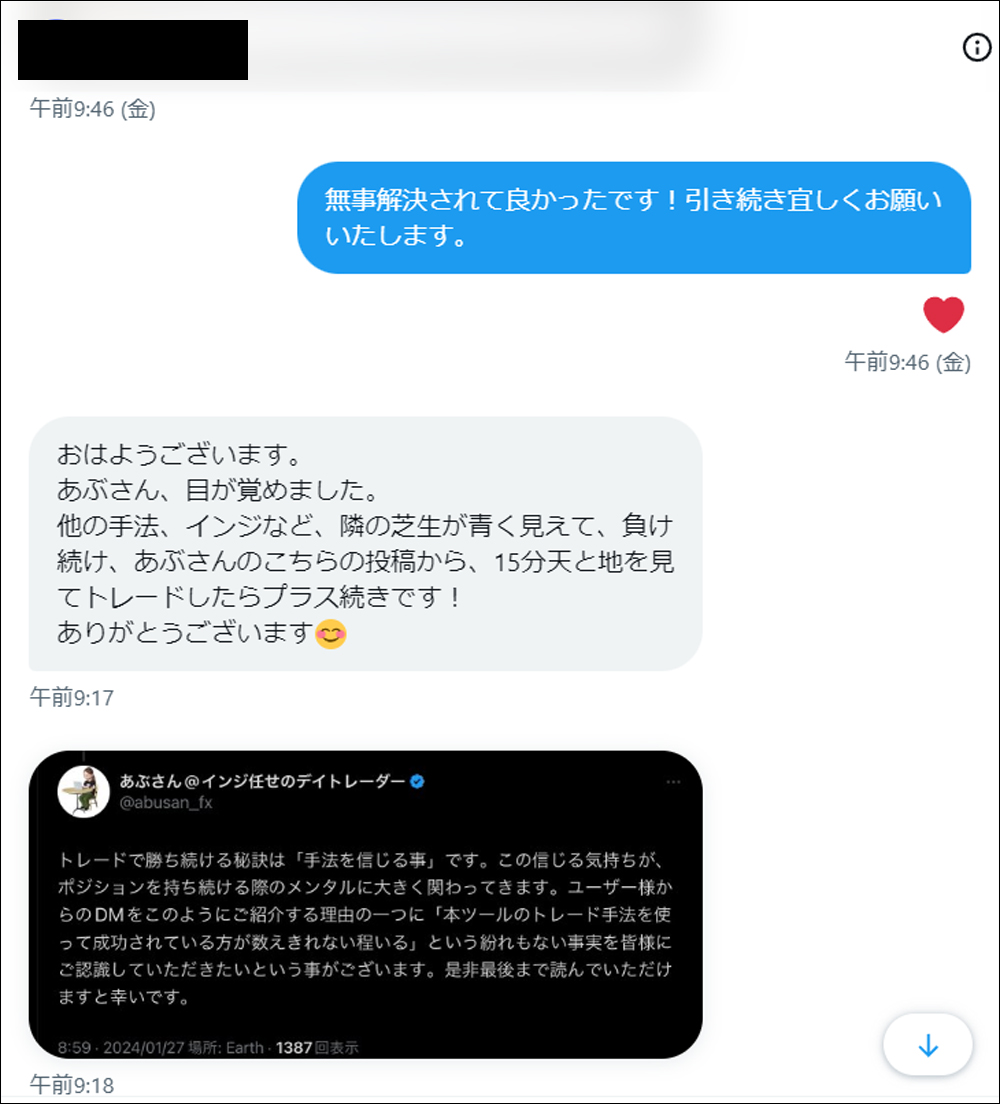
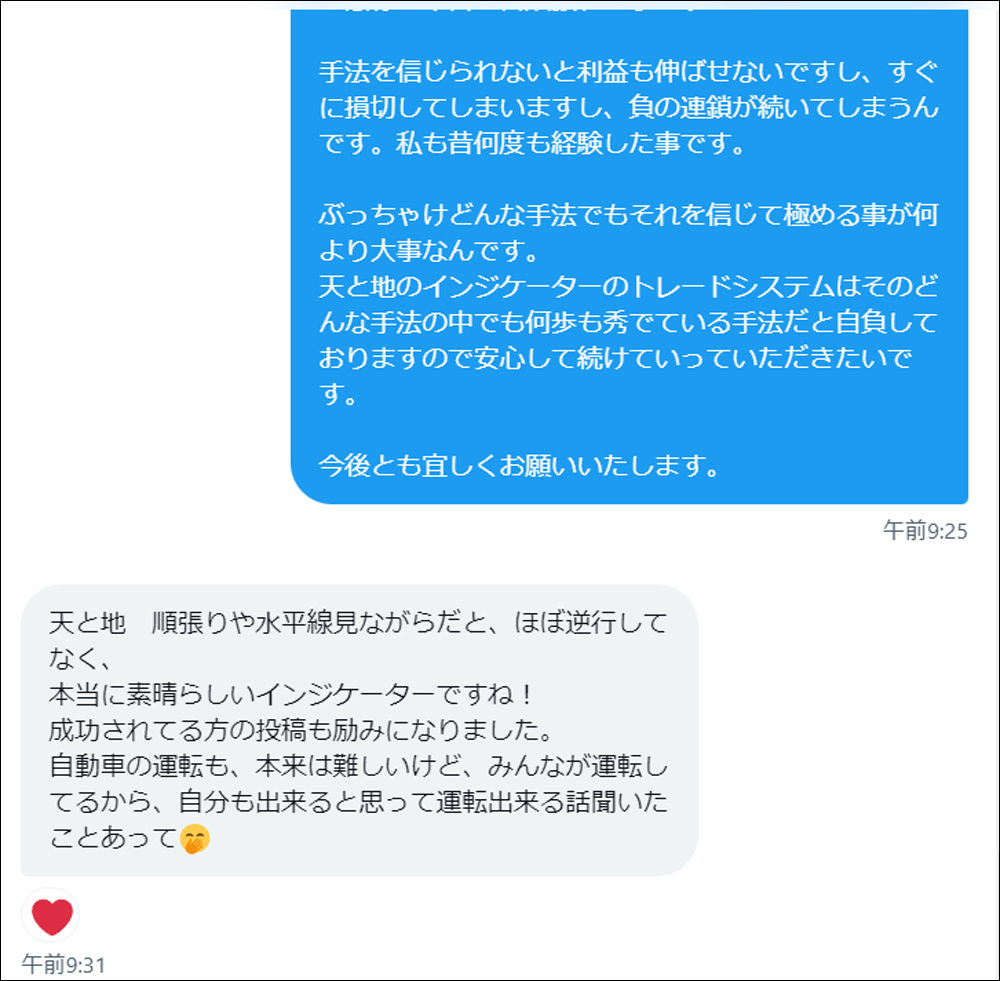
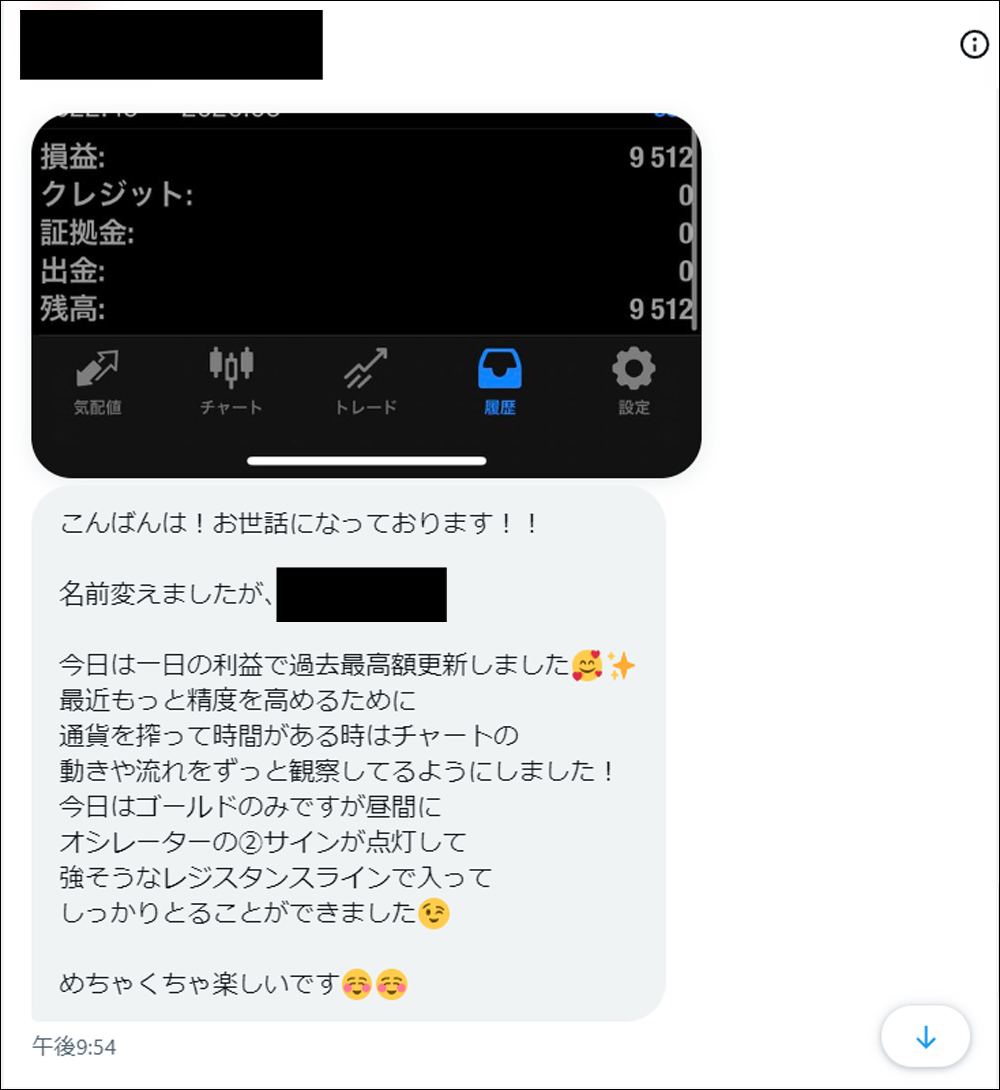
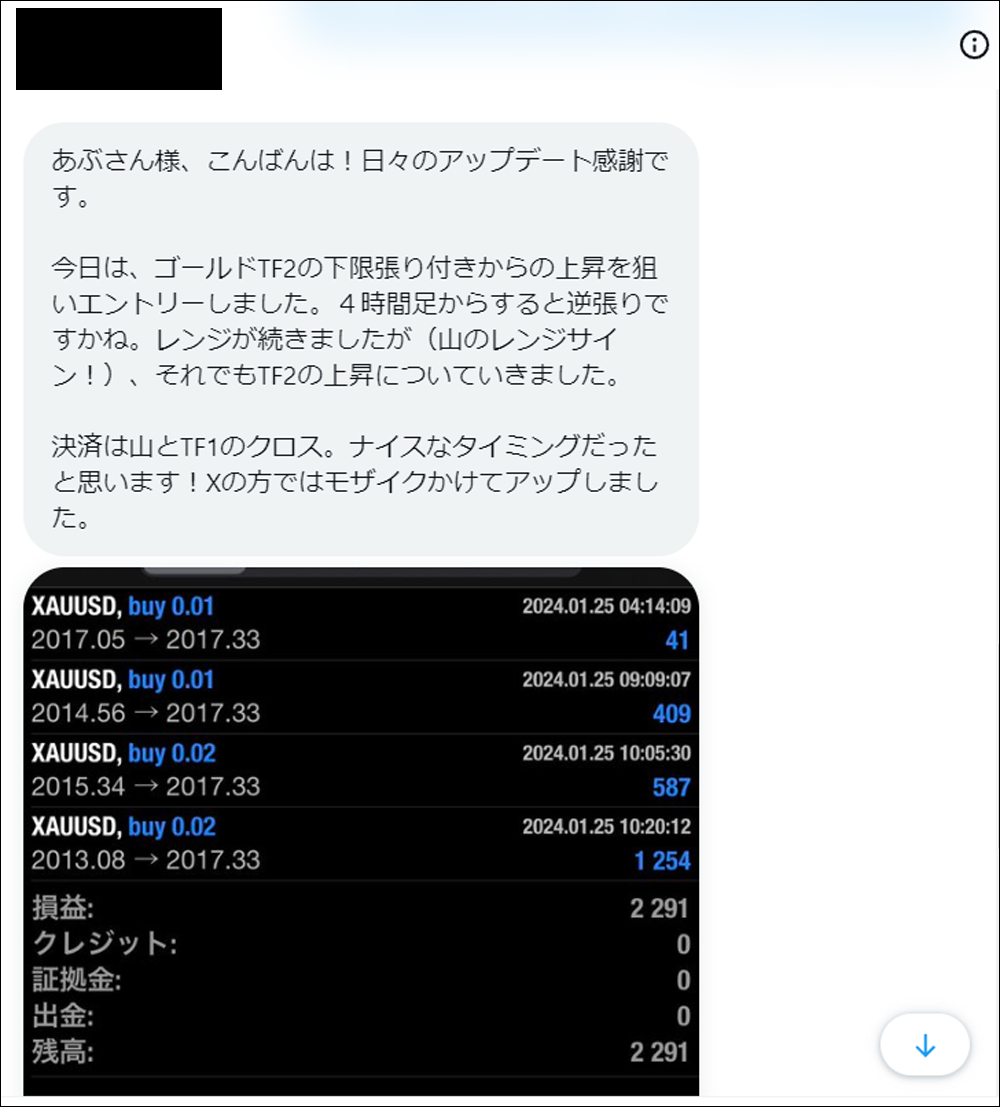
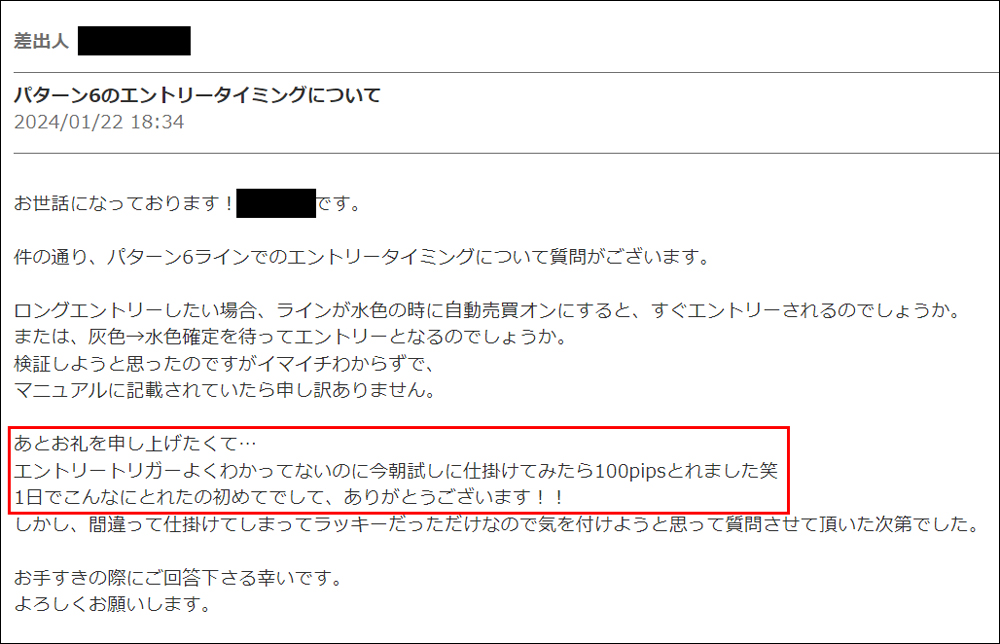

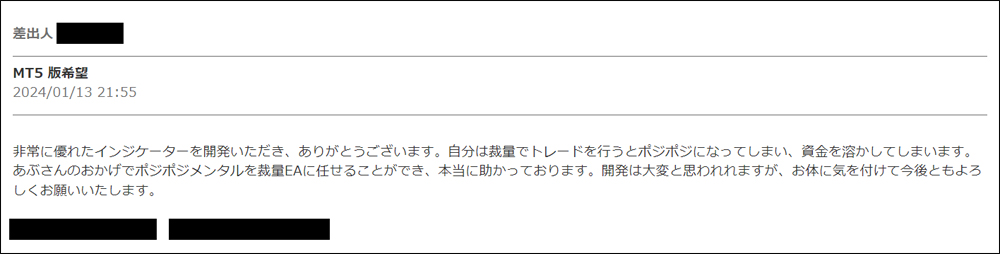
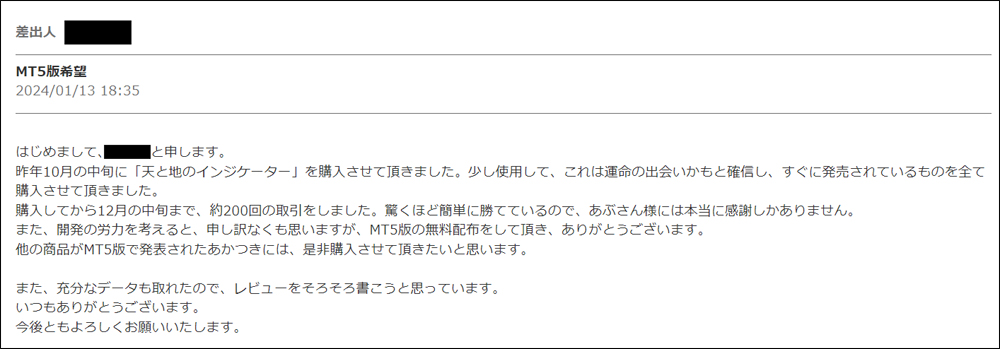
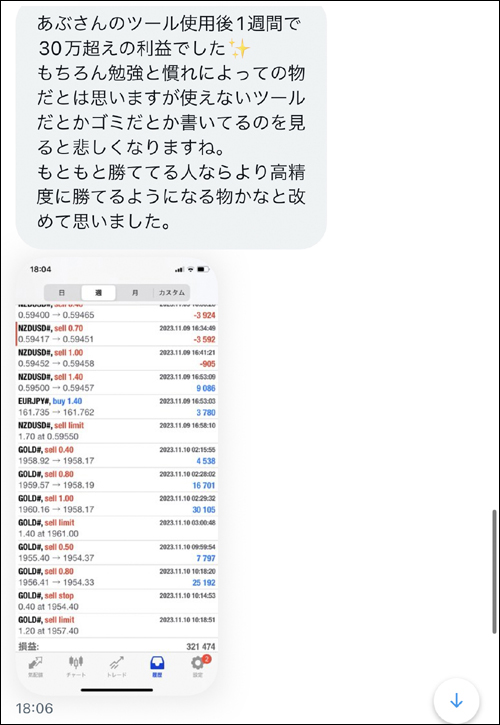
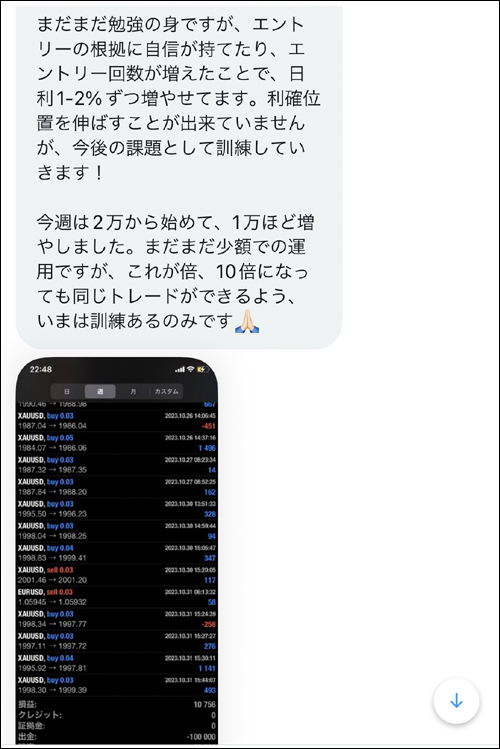
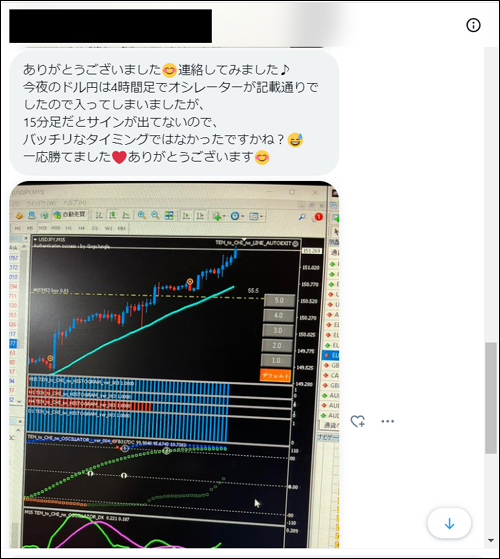
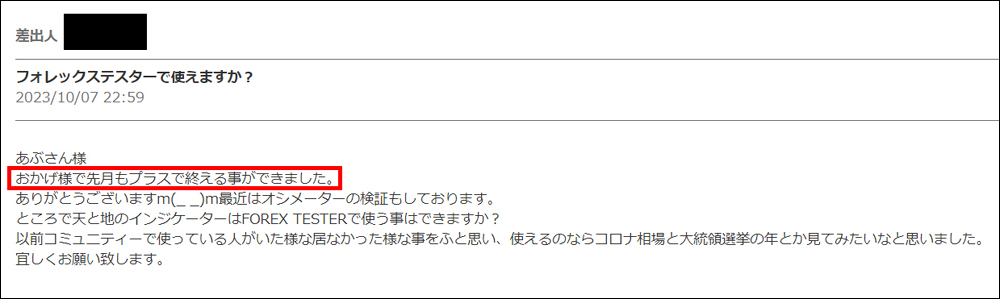
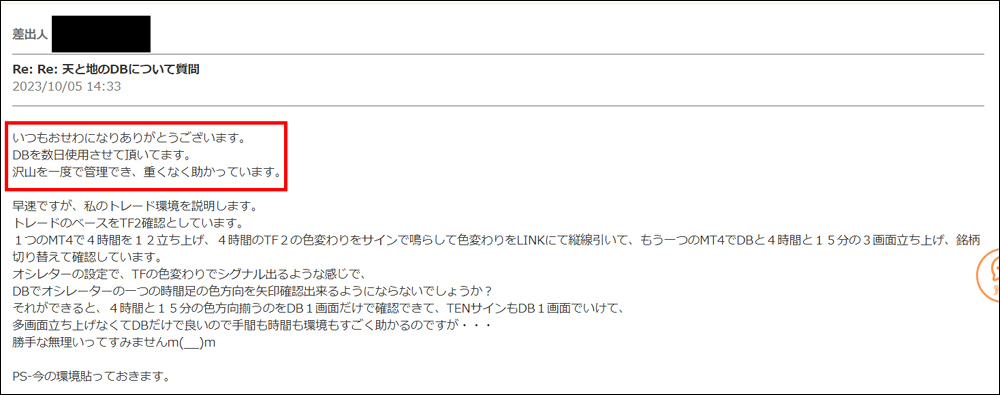
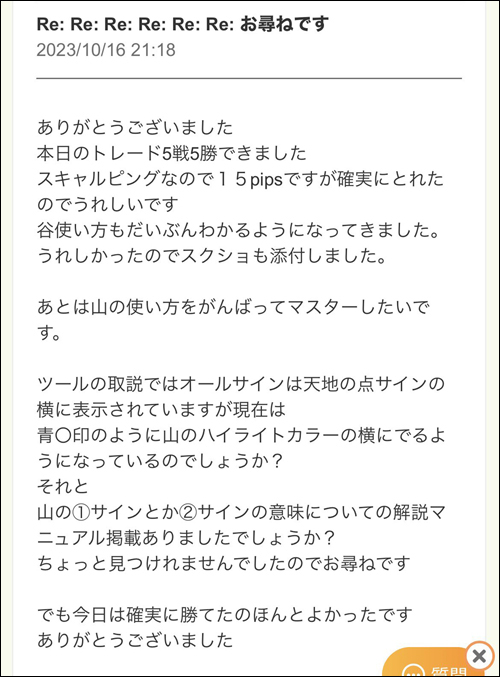
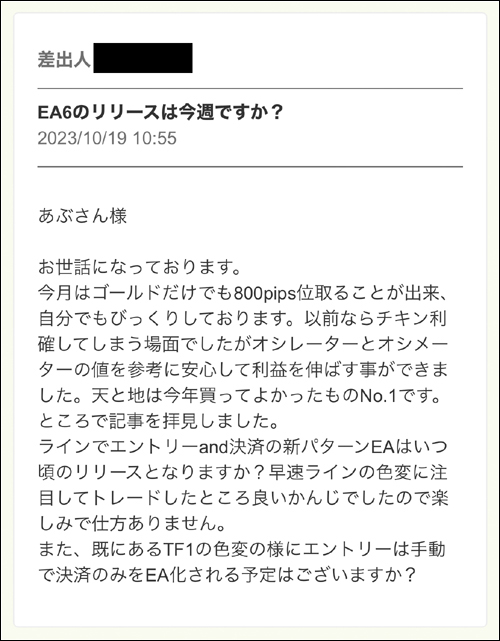
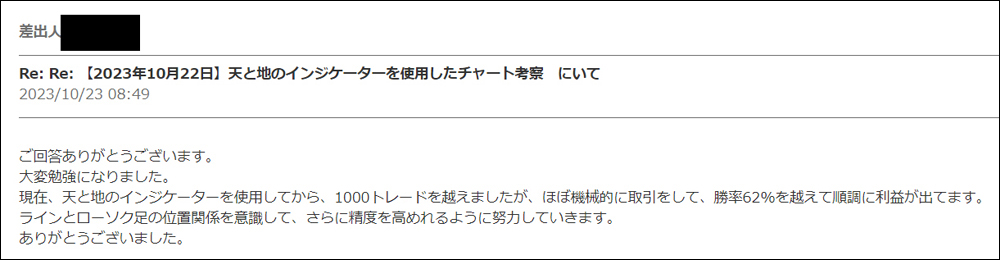
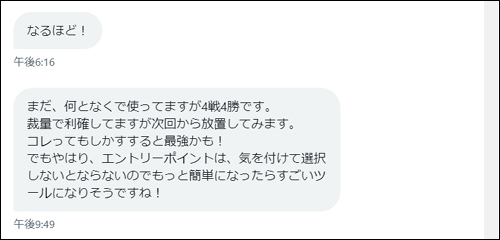


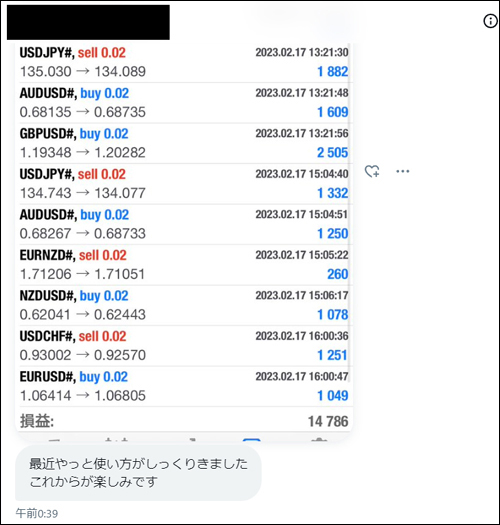
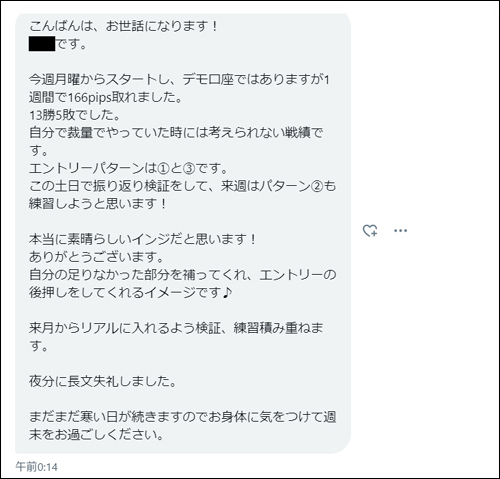
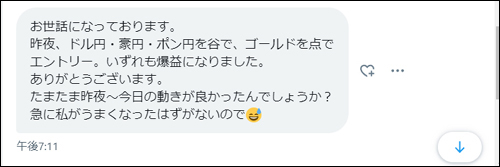
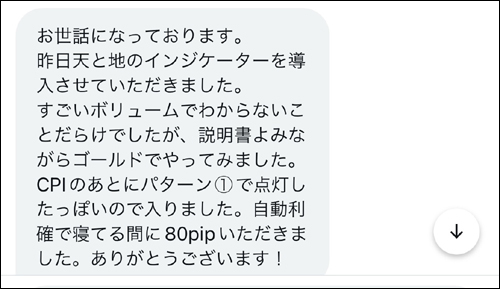
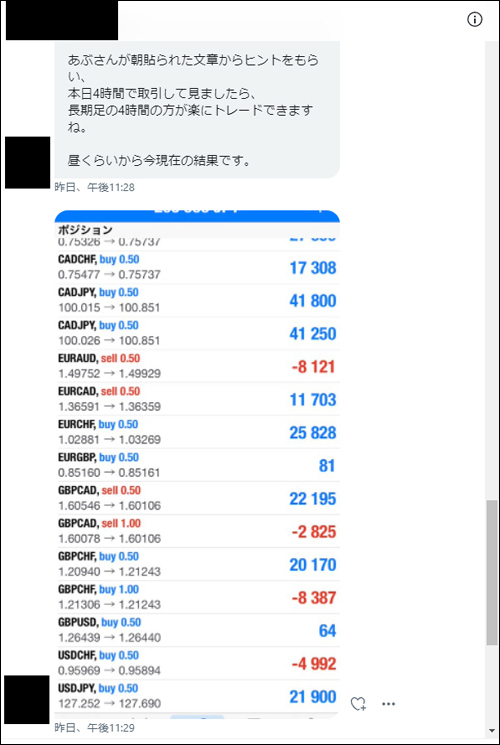
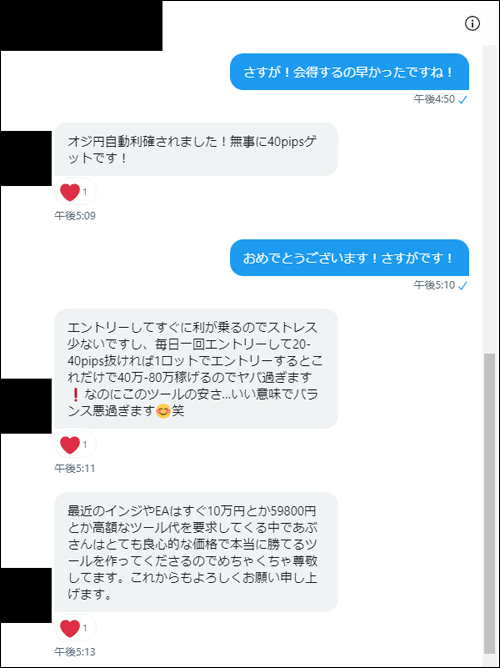
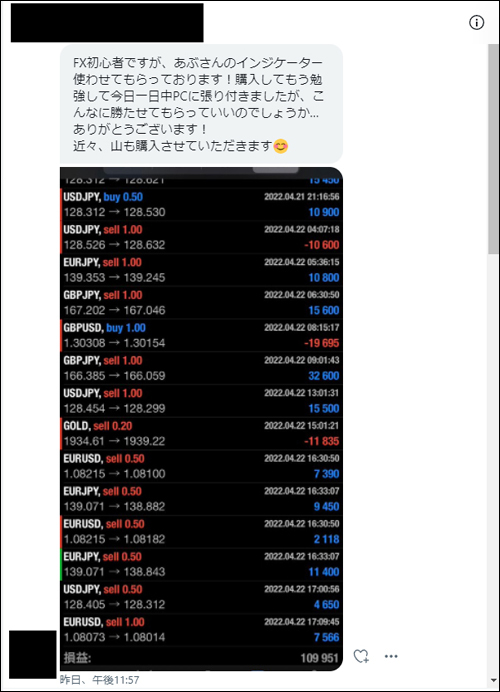
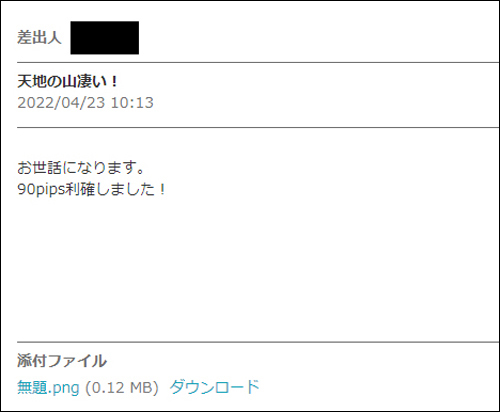
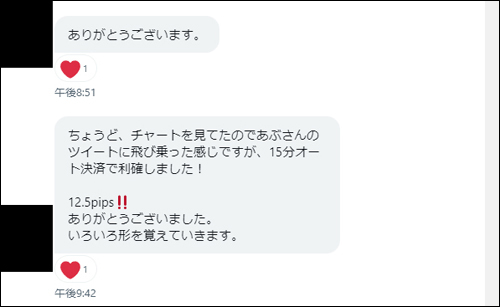
・In the articles linked below, we introduce valuable DMs, reviews, posts, etc. from users and monitors. Starting with winning reports, we curate useful content, so surely it will be参考 for everyone. It’s updated regularly, so please read whenever you have time.
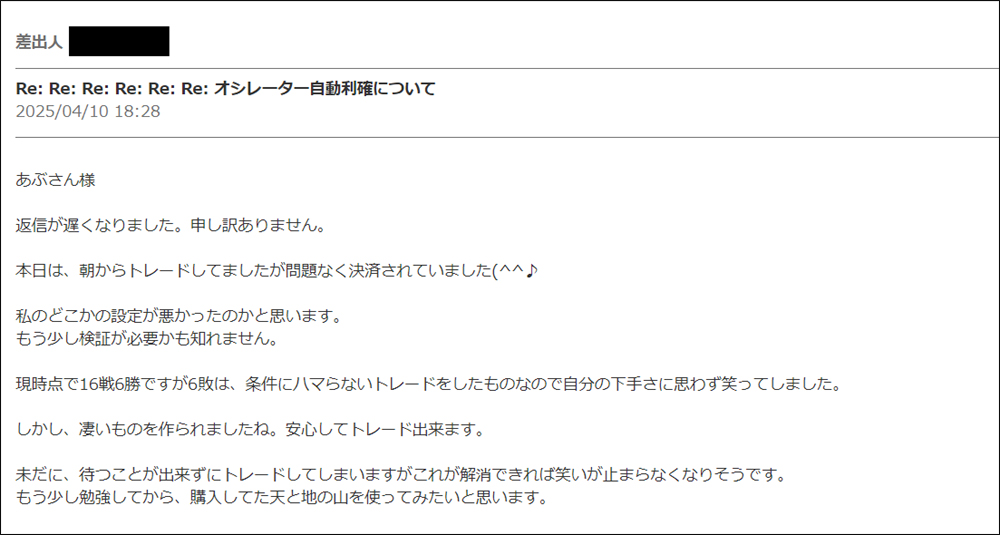
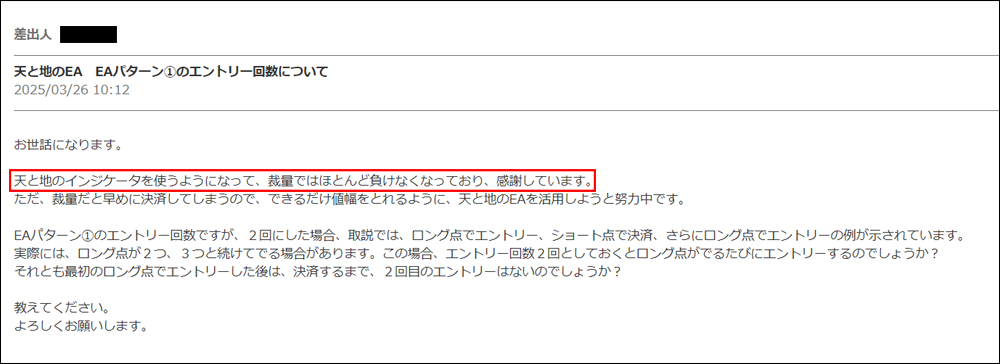
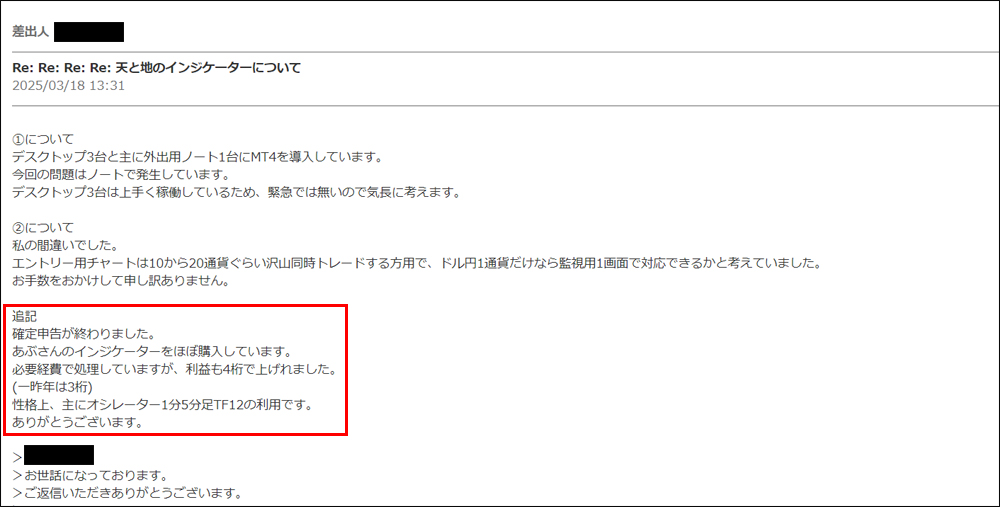
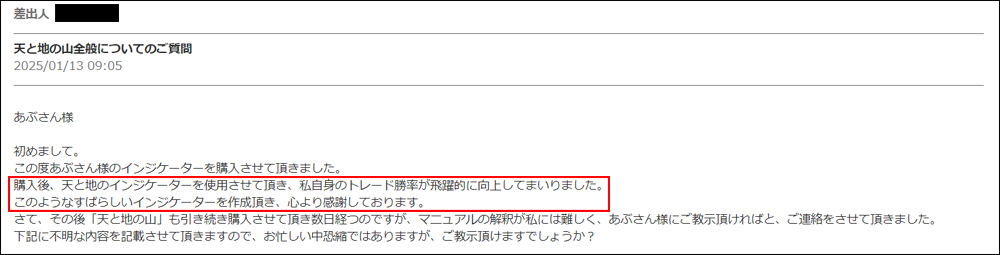
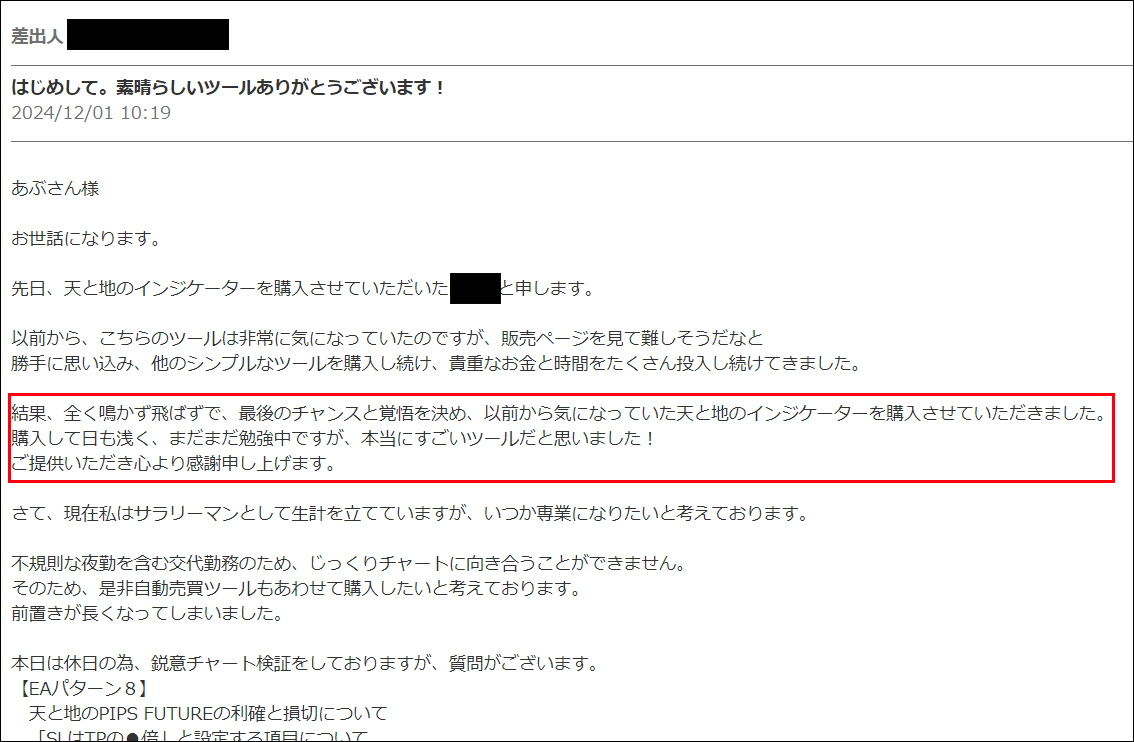
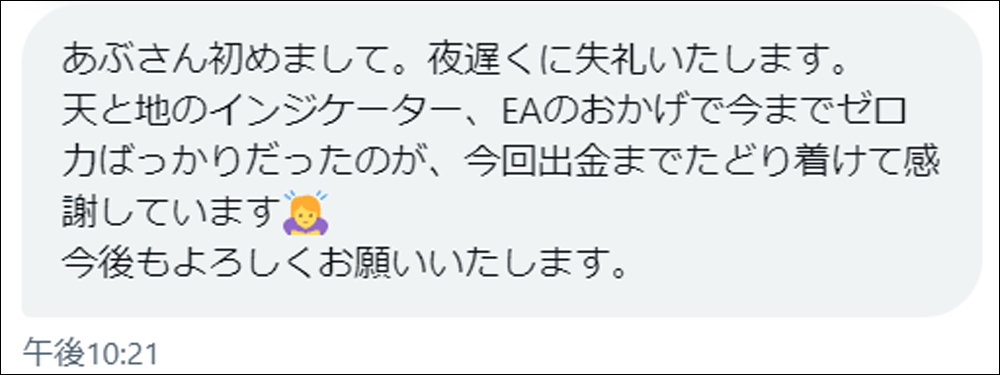
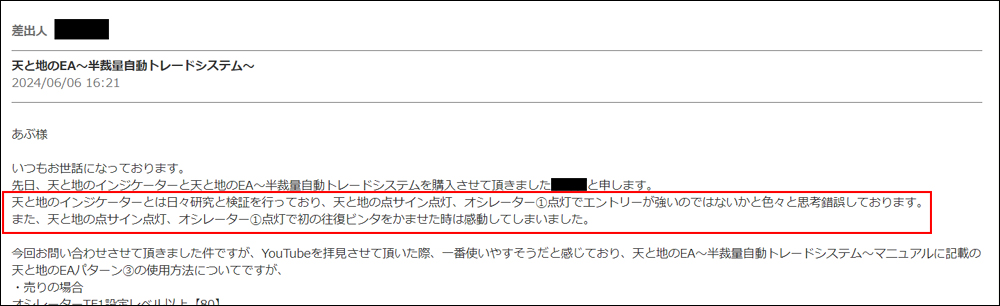
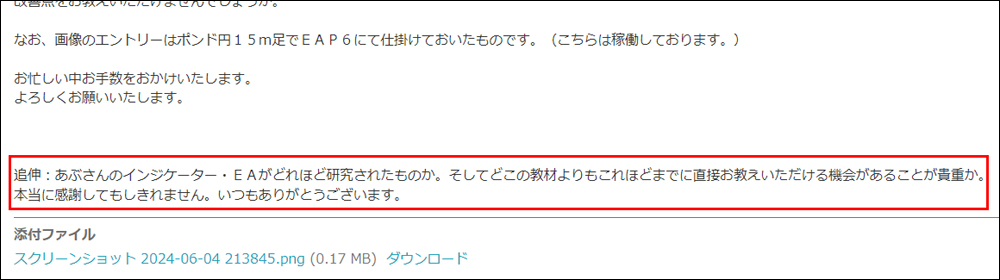
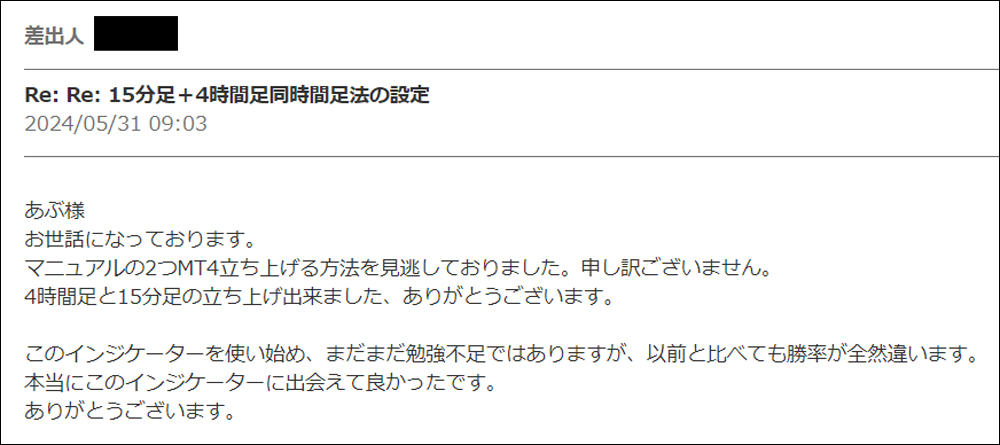
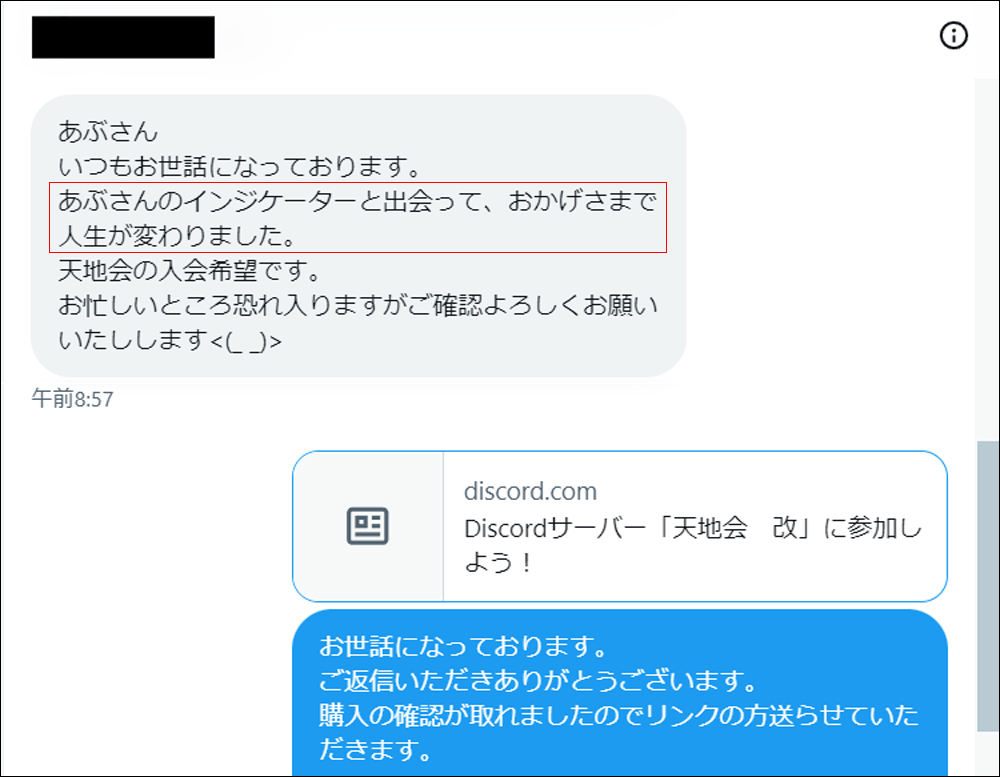
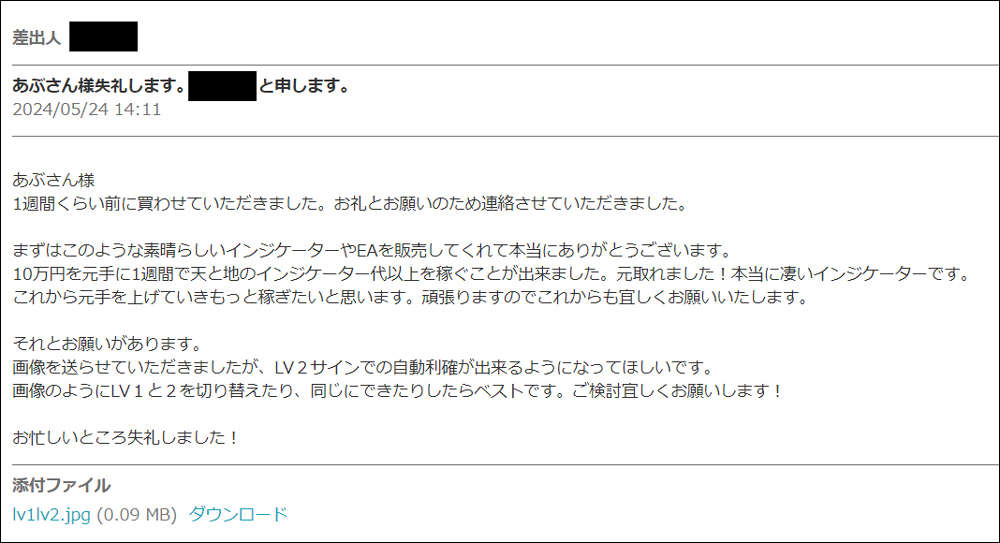
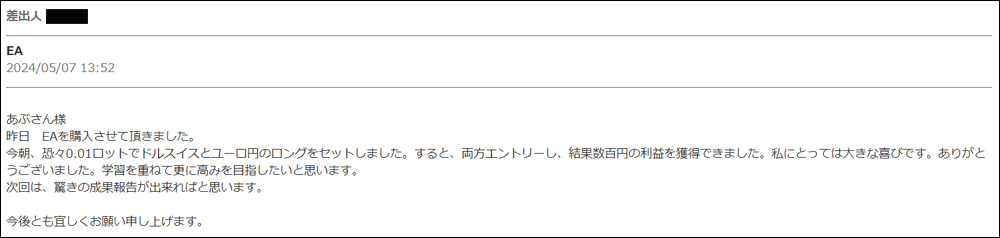
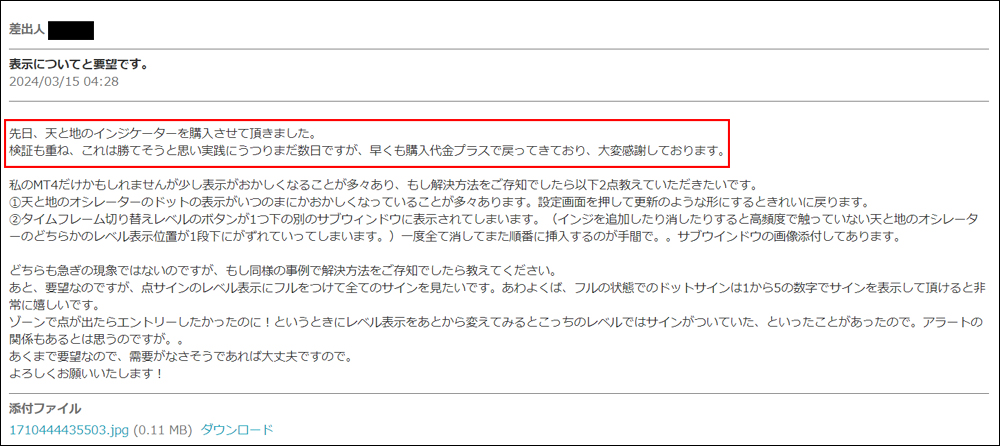
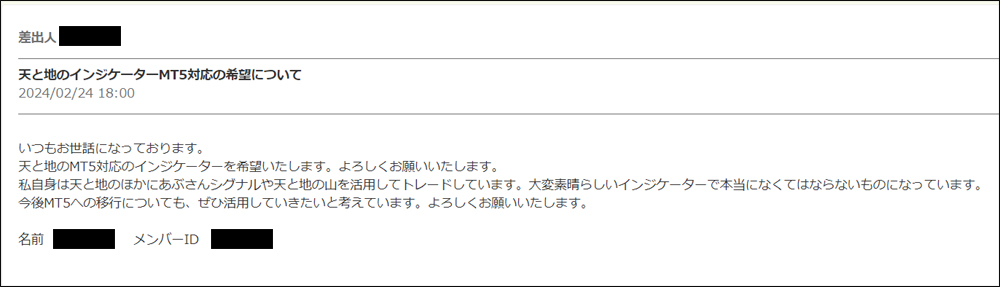
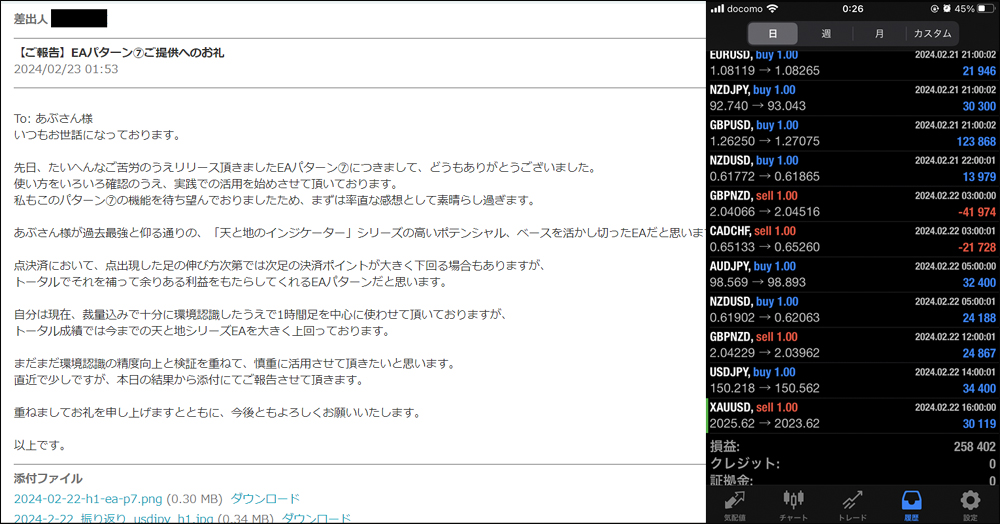
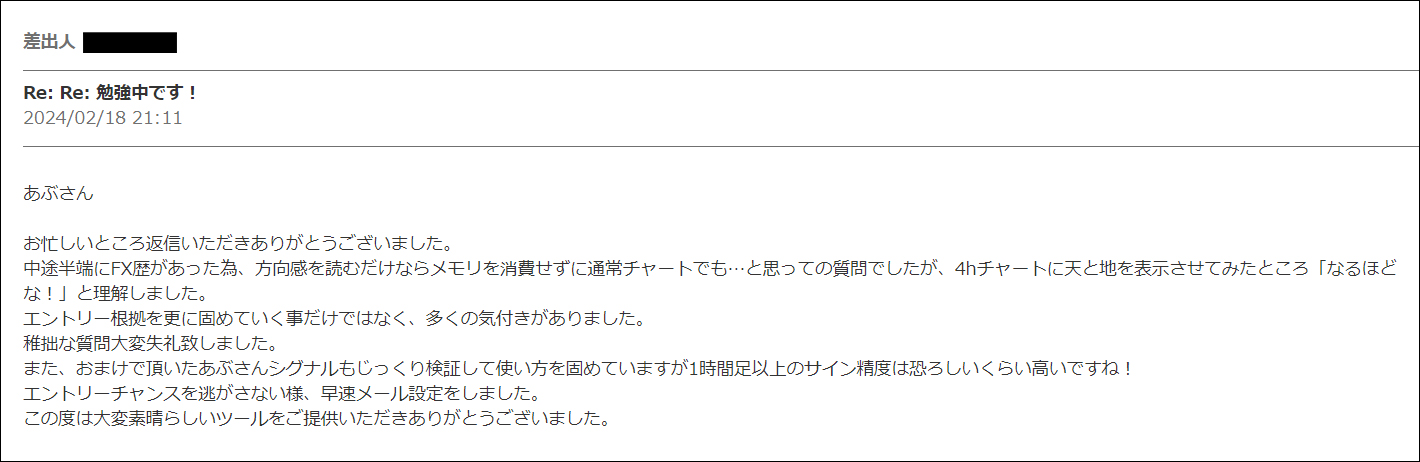
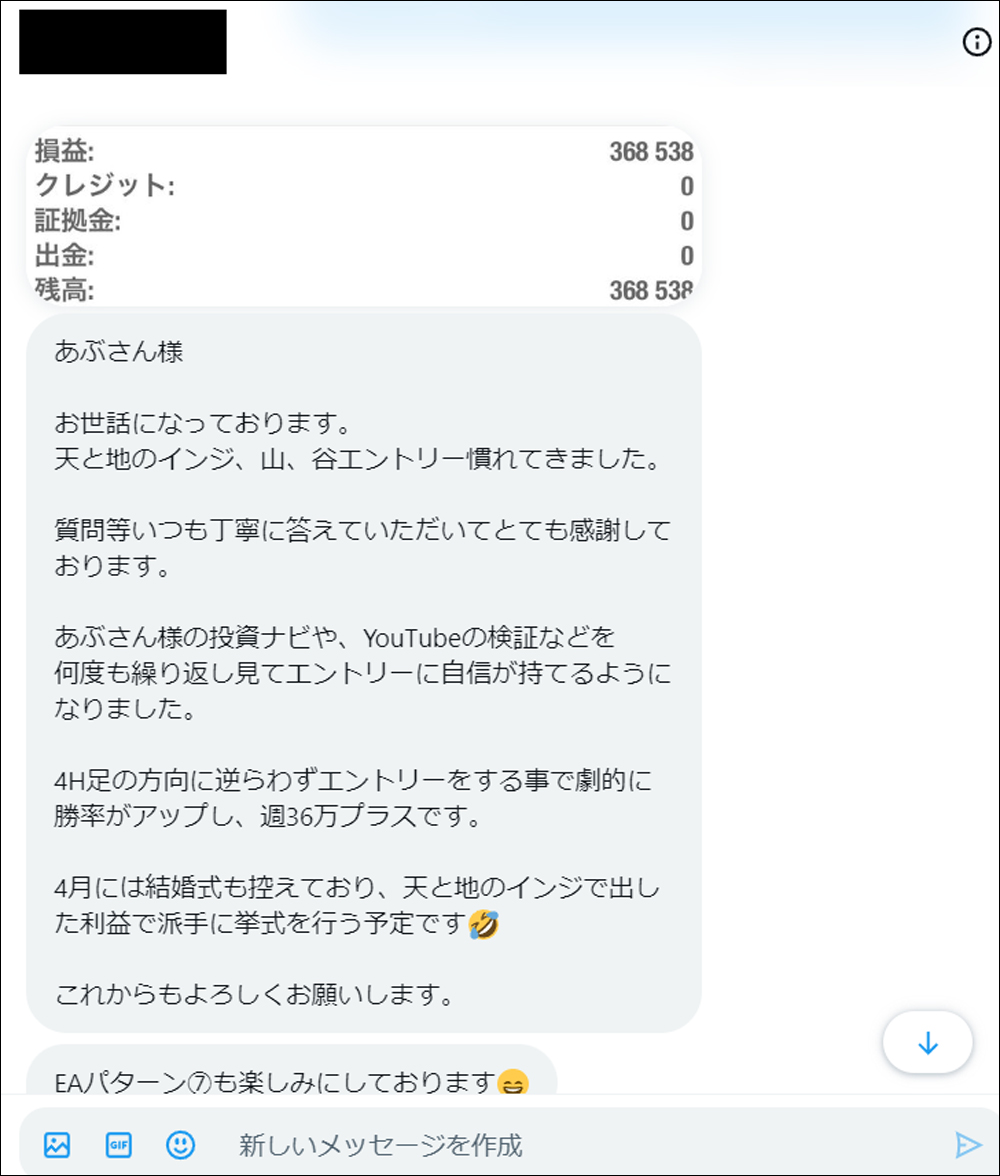
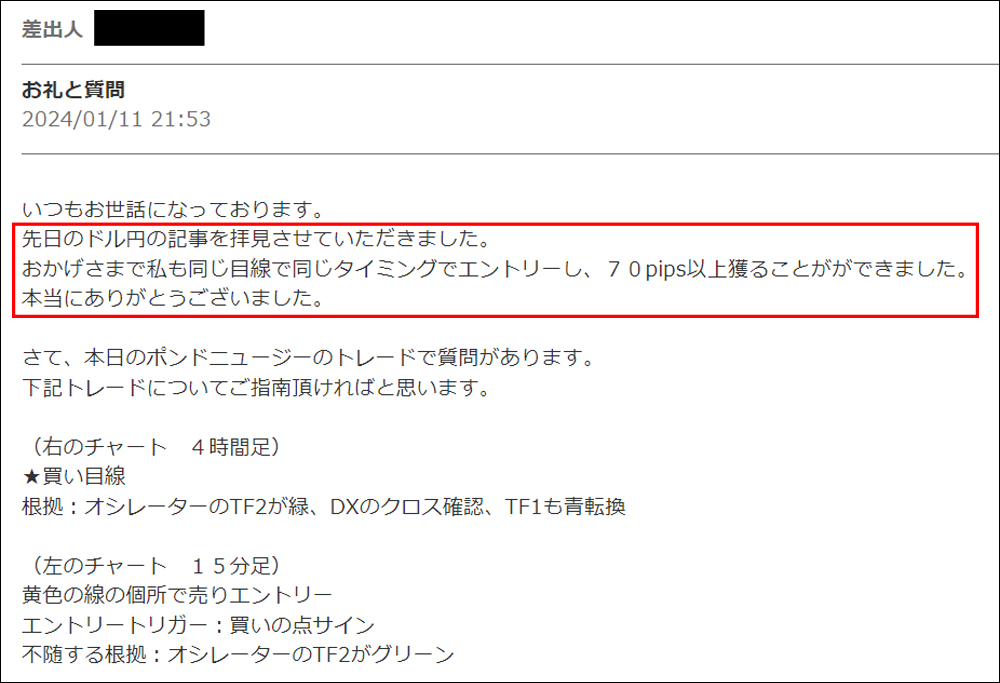
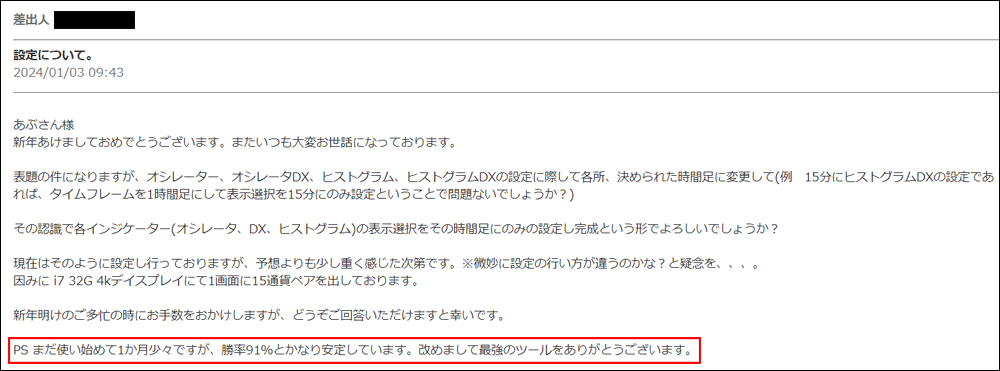
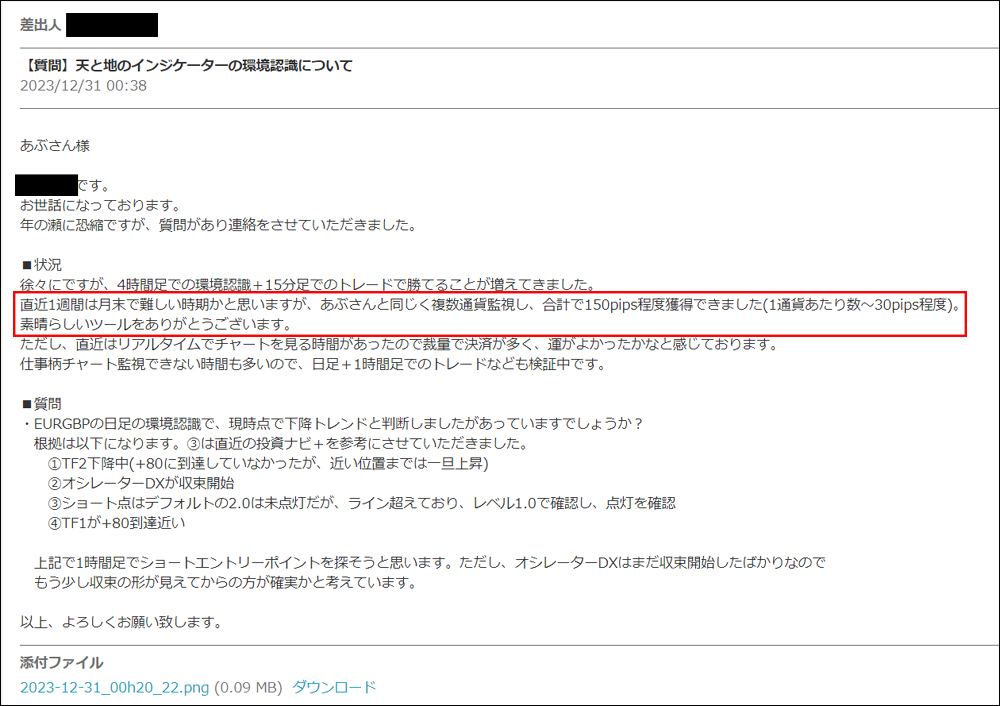
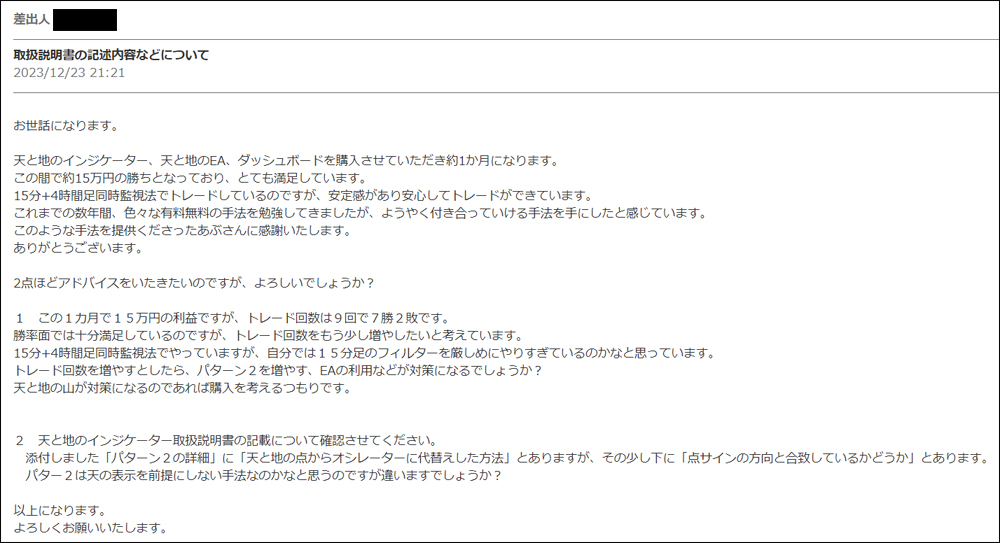
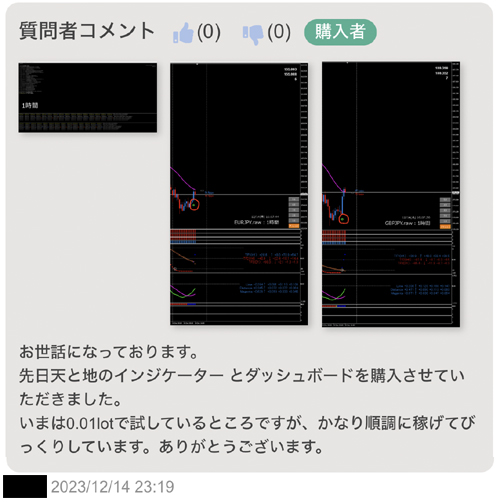
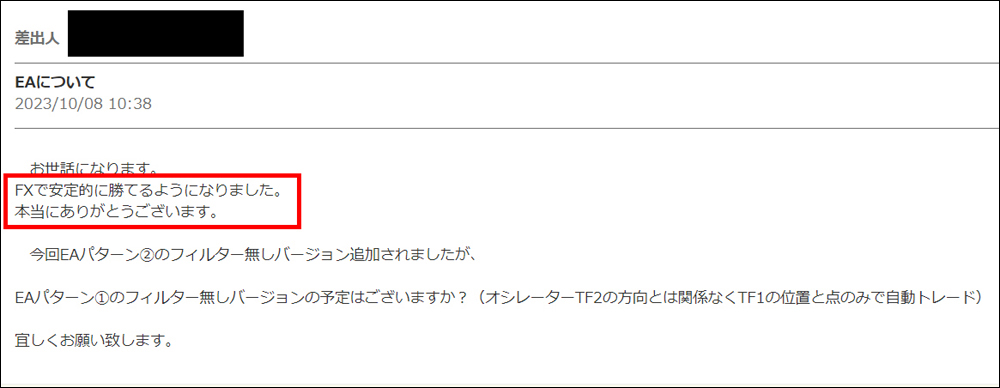
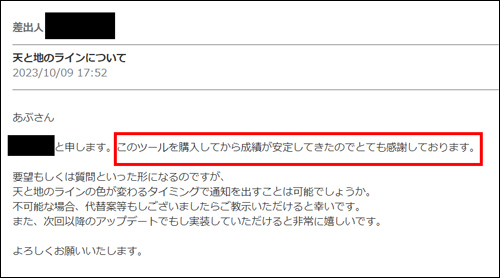
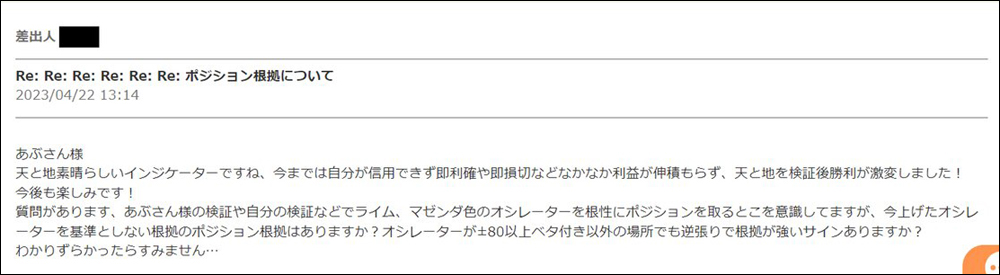
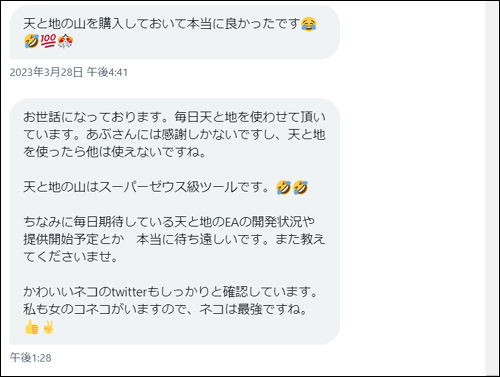
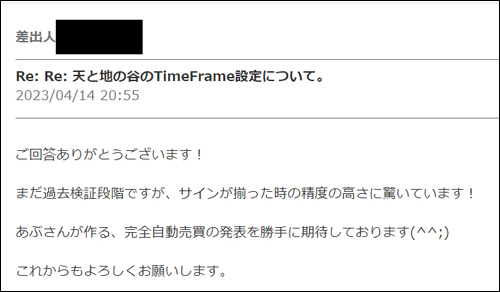
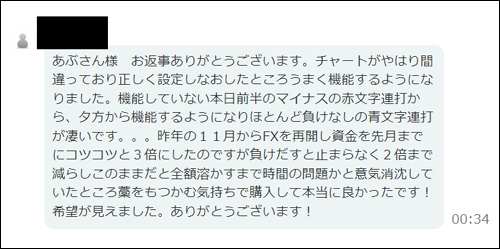
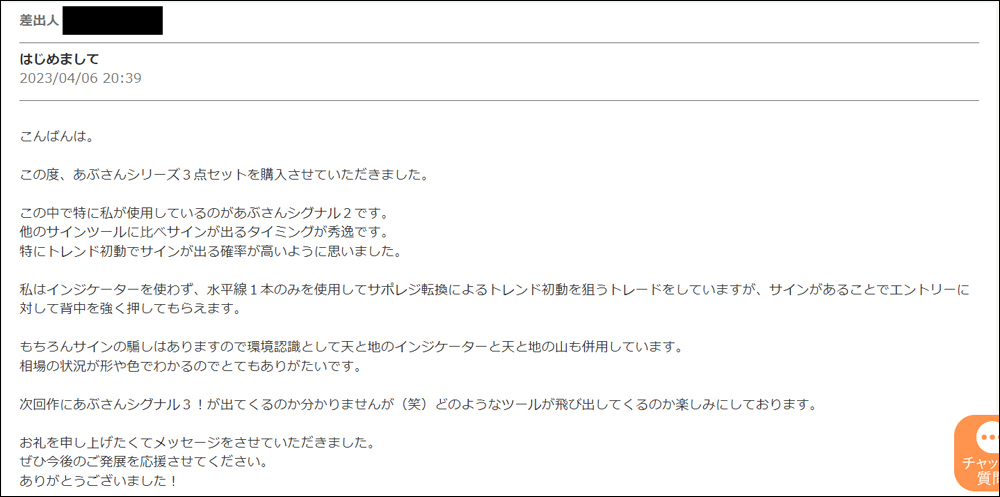
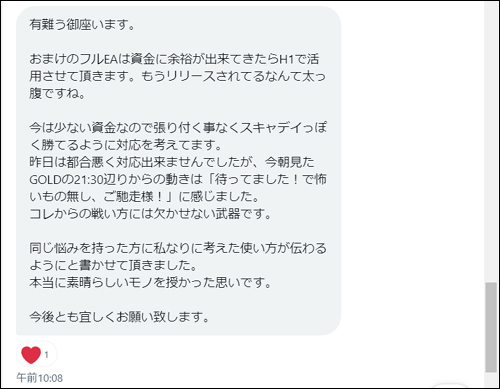
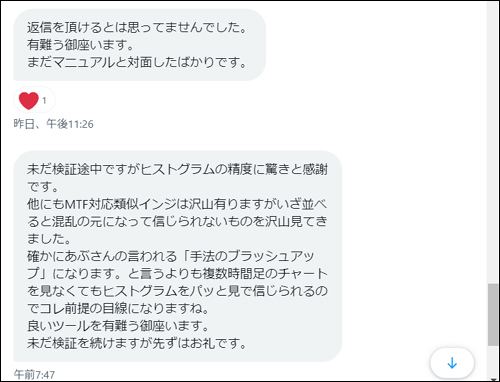
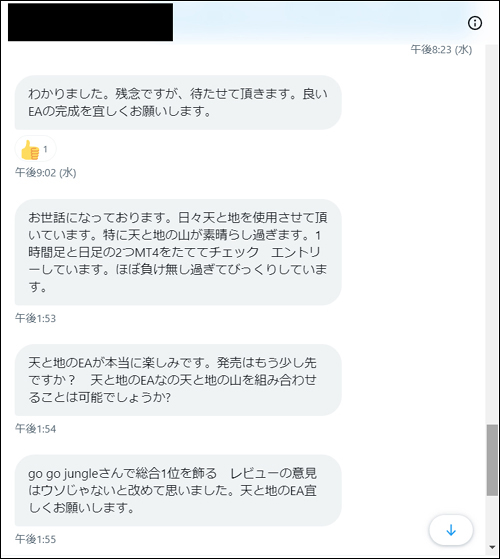
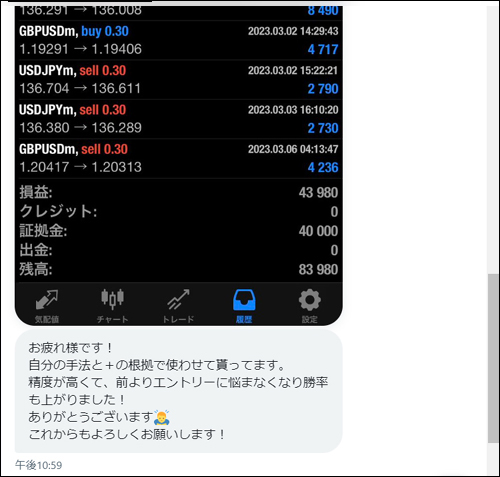
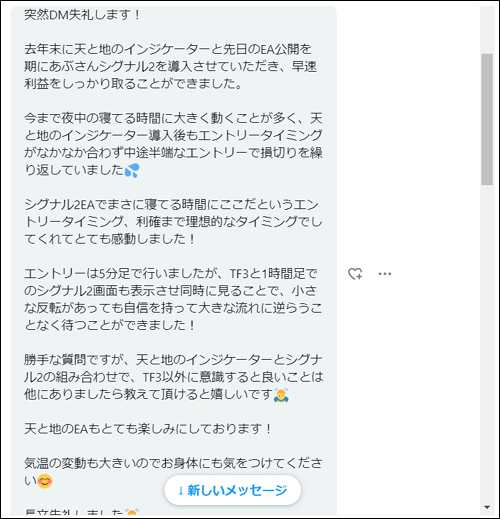
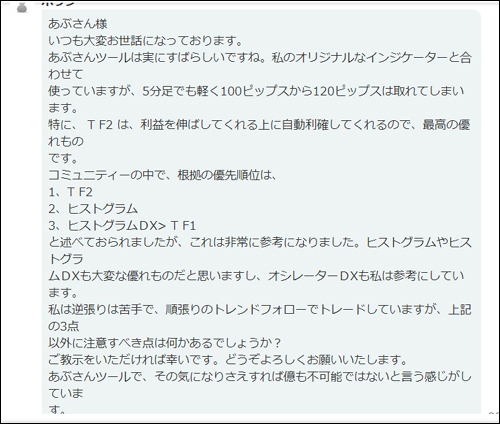
・Impressions from users who actually used the Heaven and Earth Indicator (Review Version)
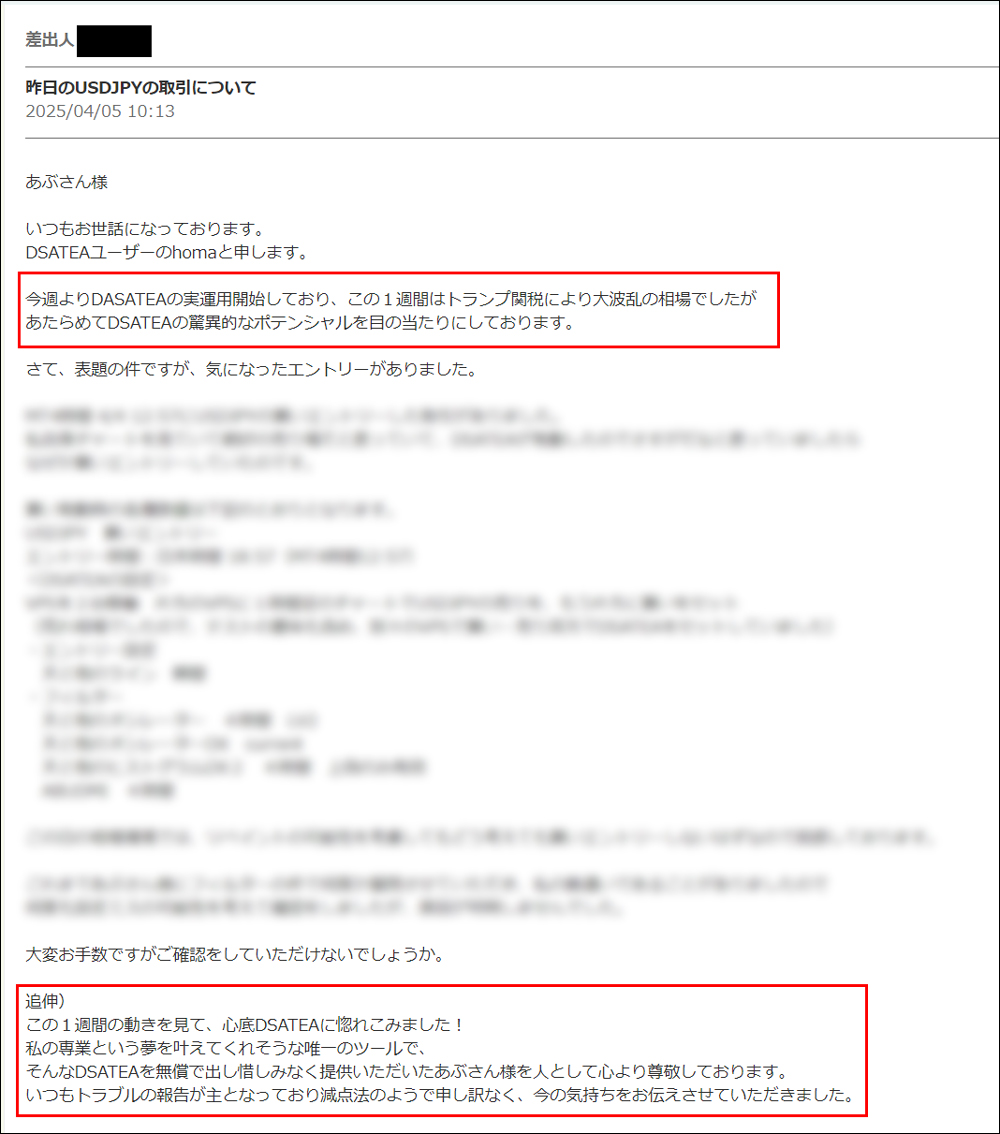
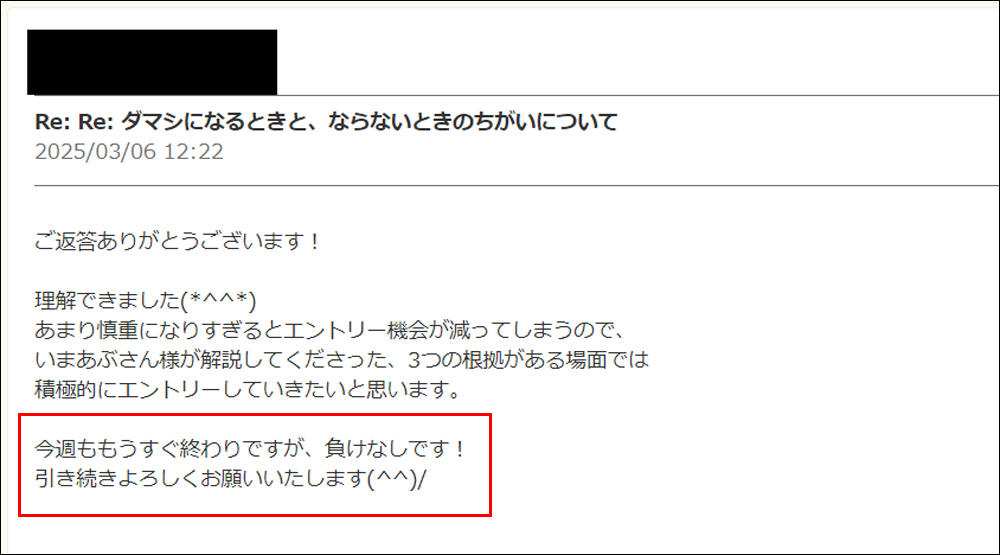
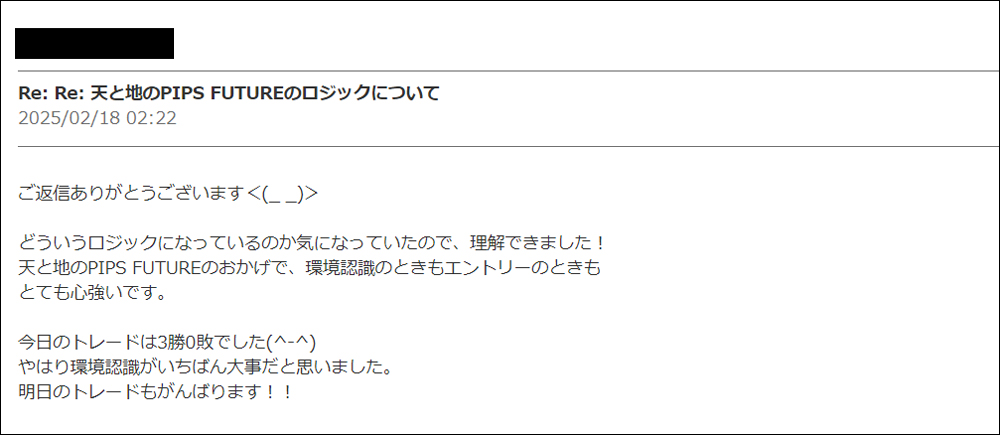
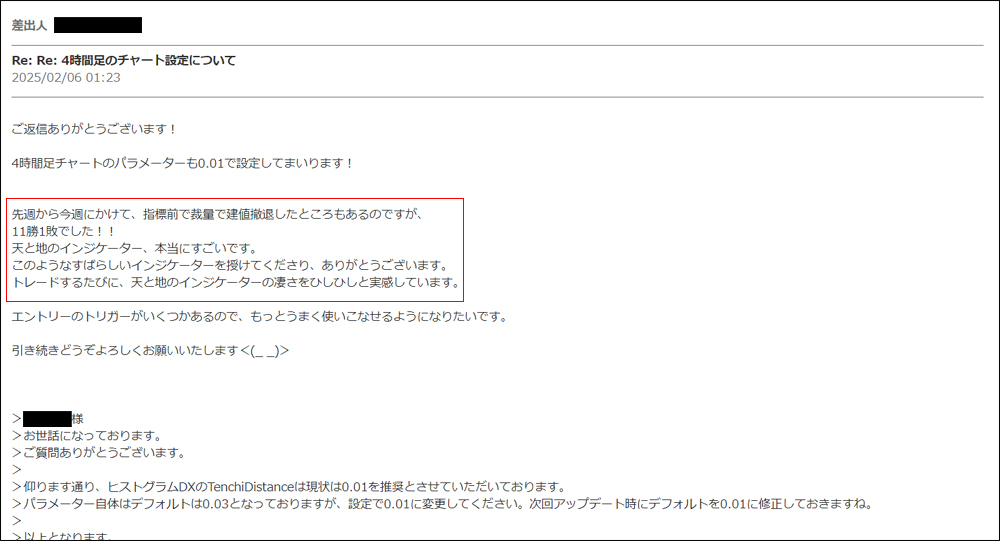
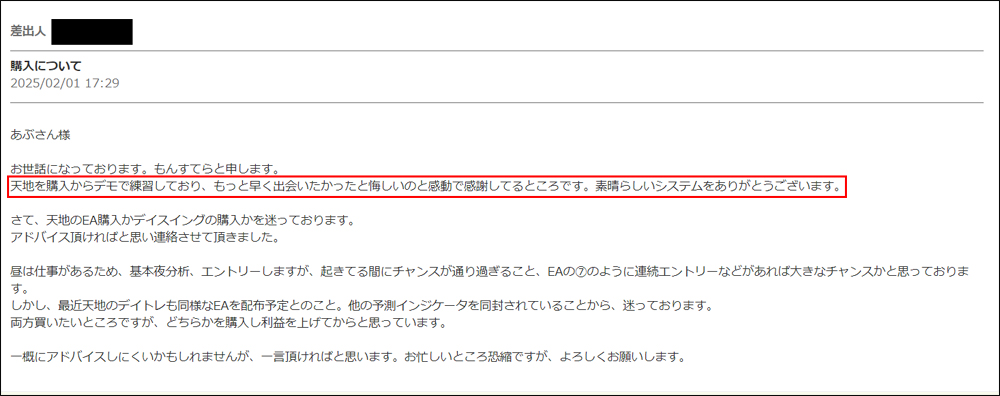
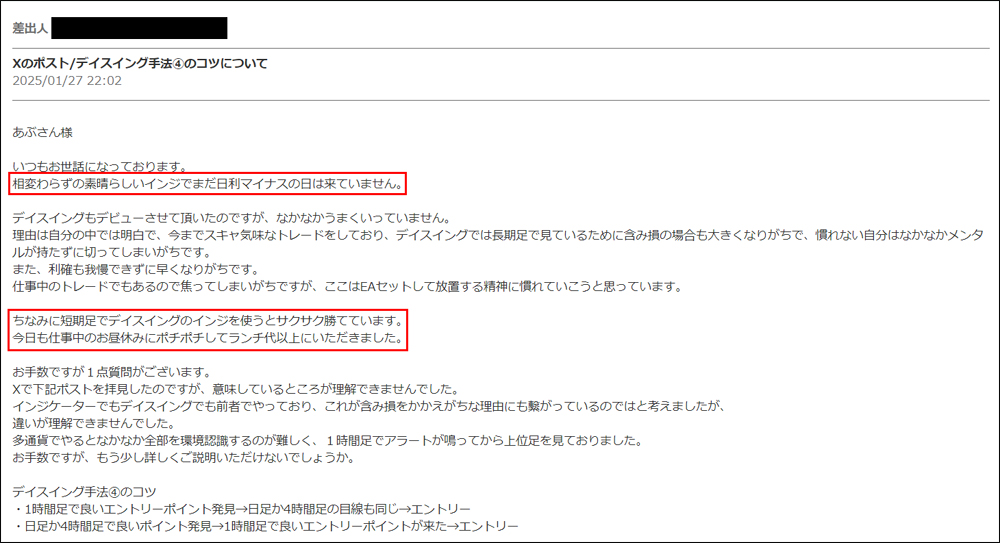
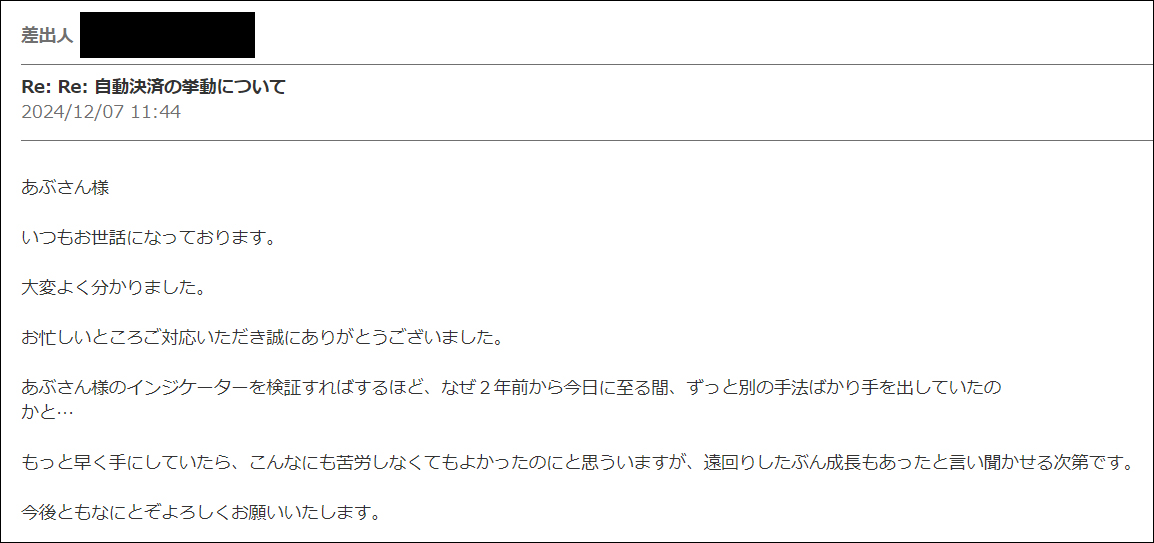
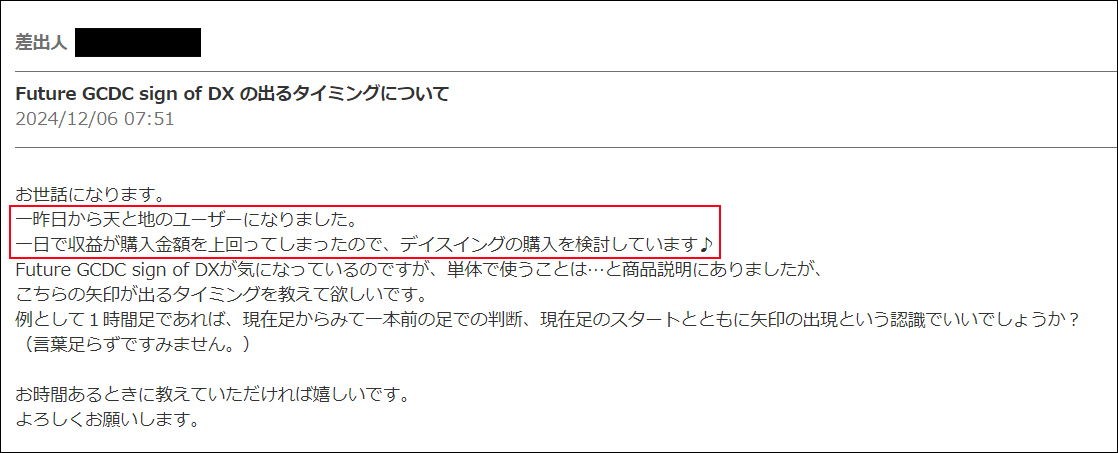
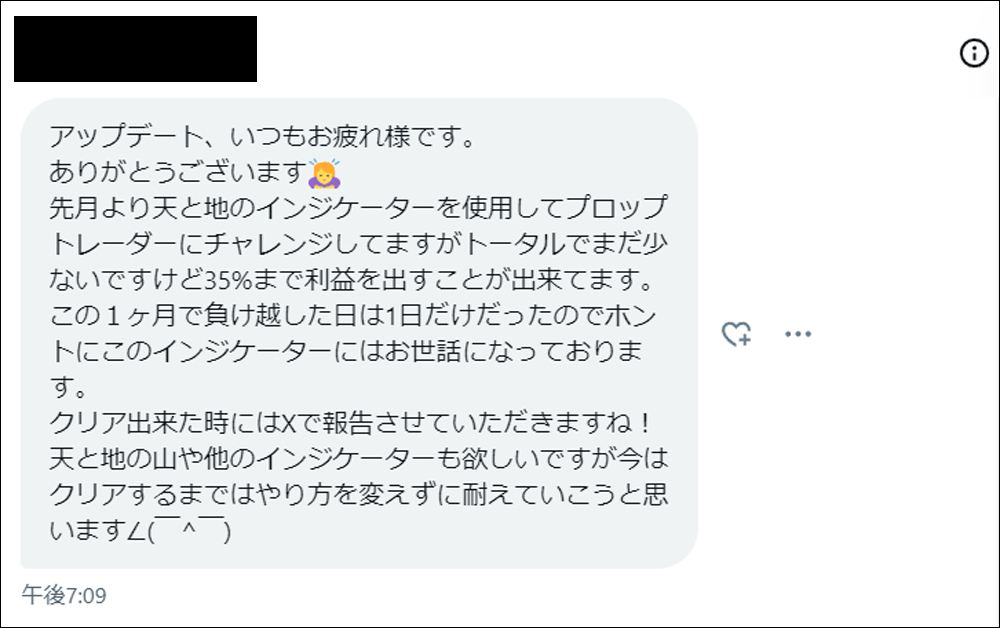
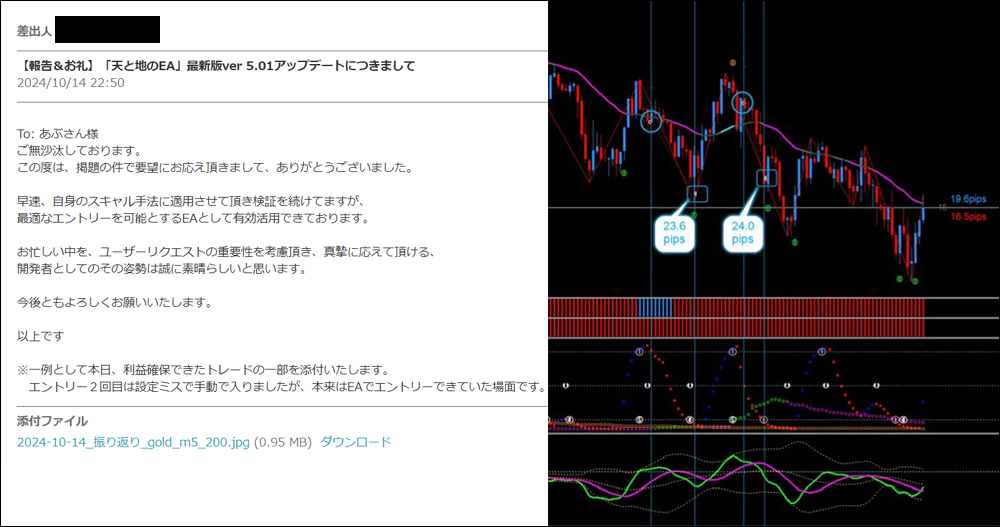
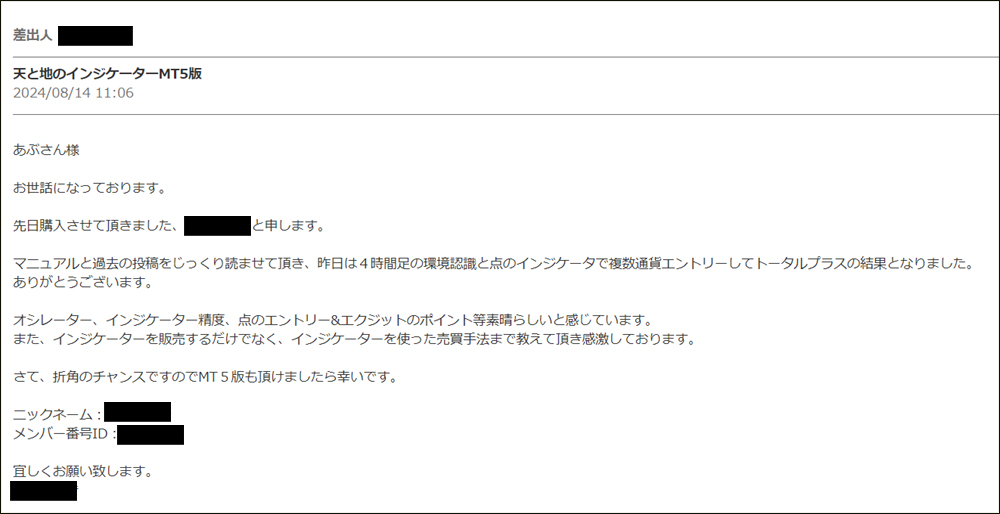
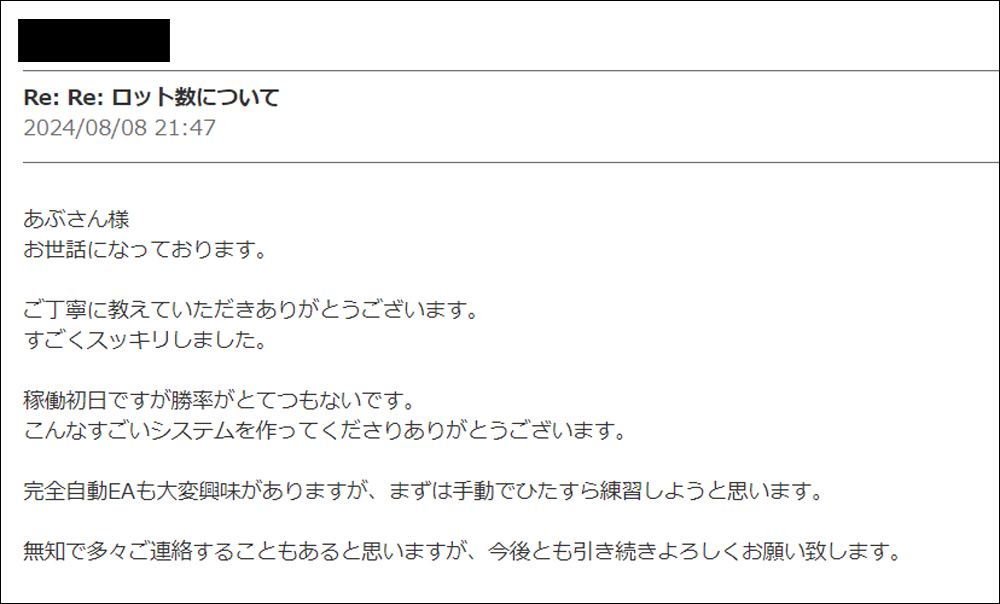
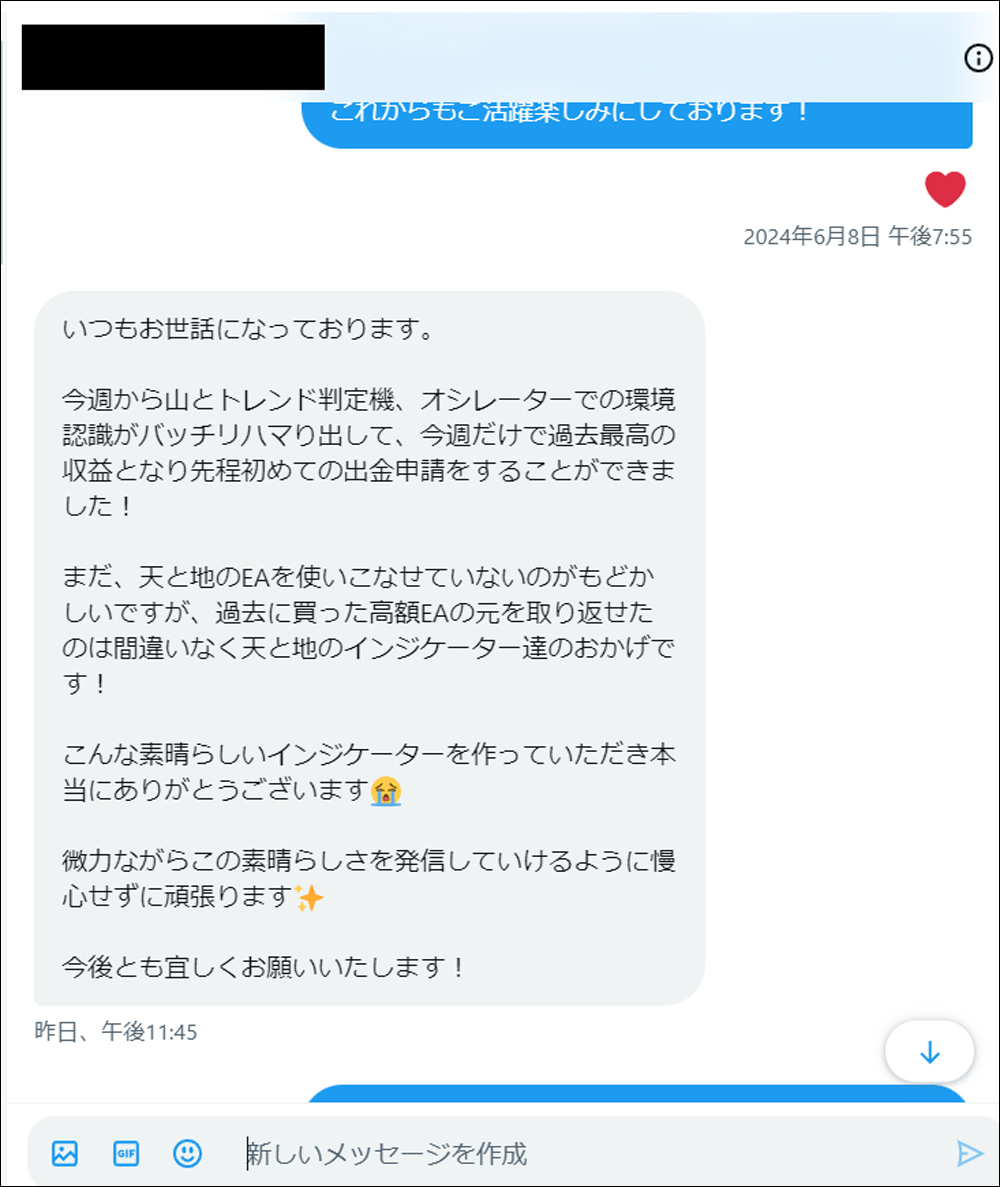
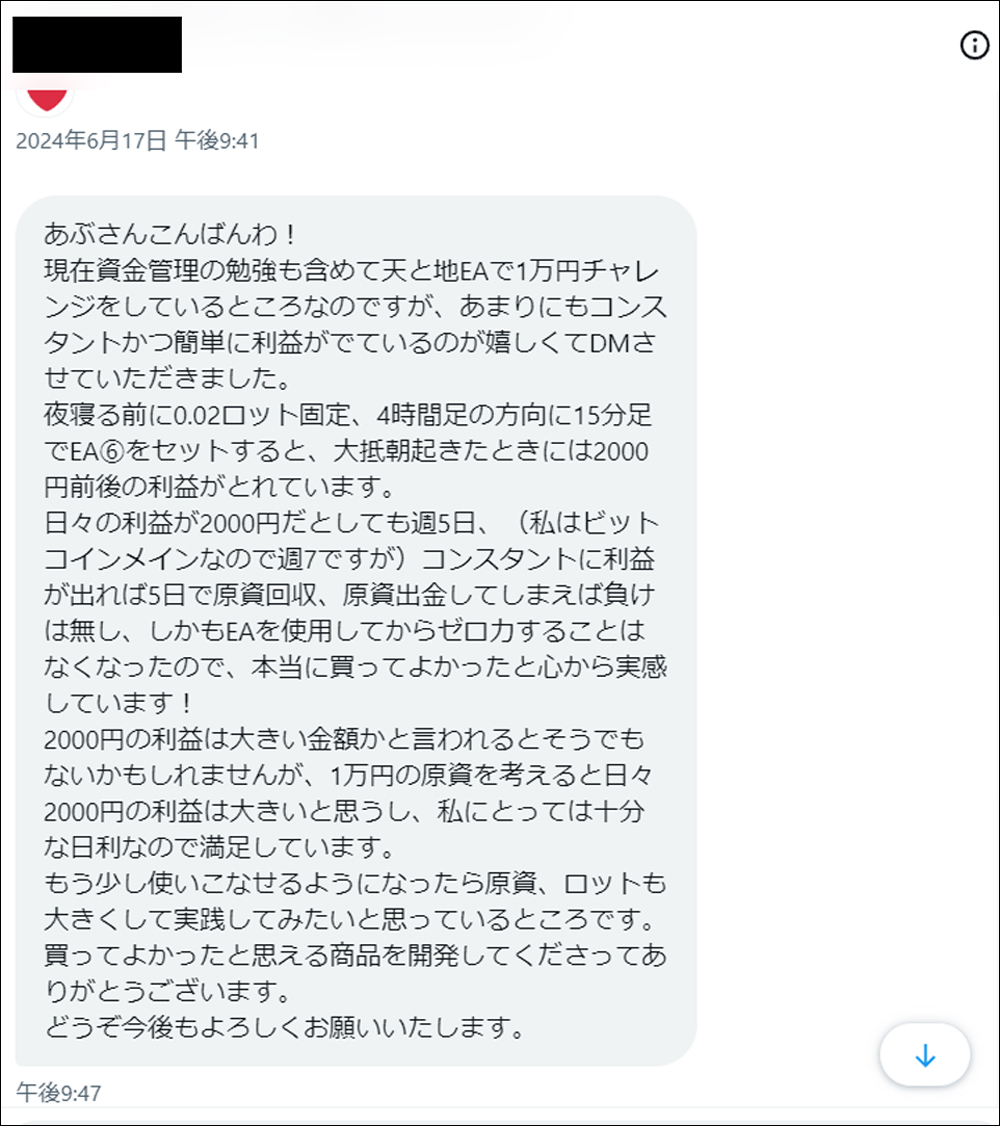
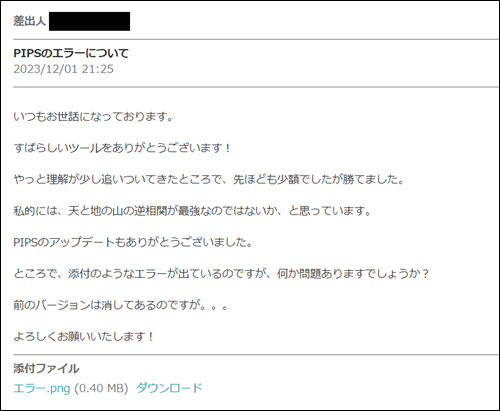
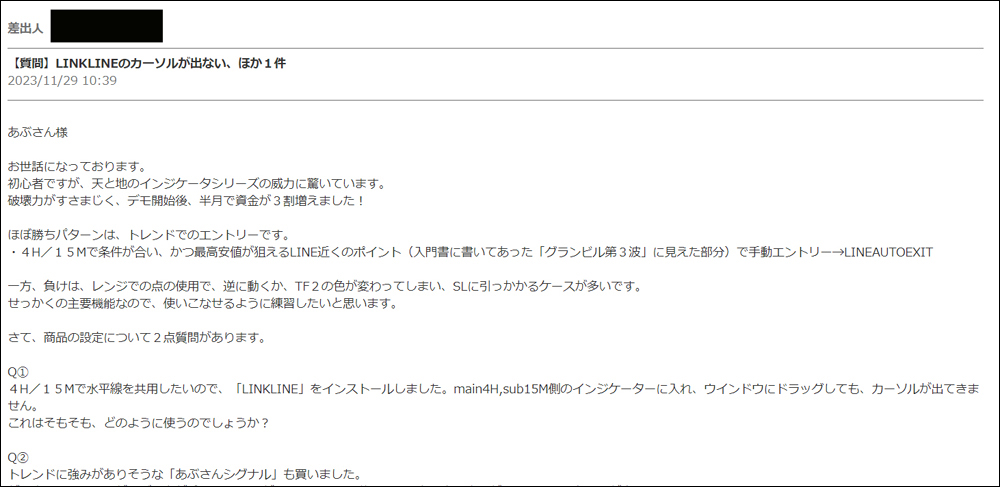
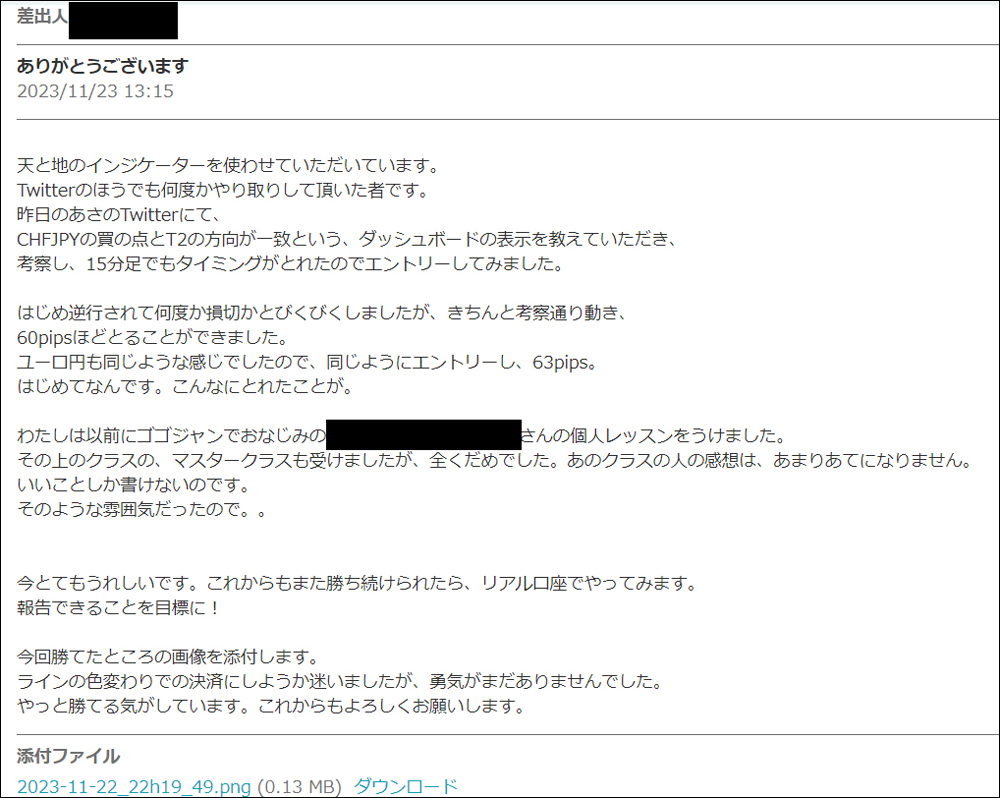
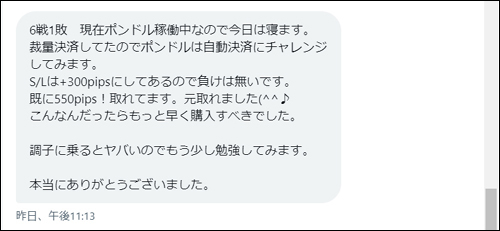
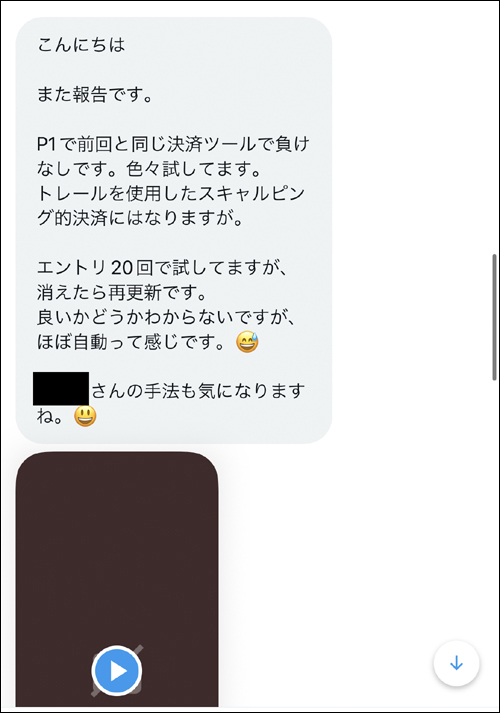
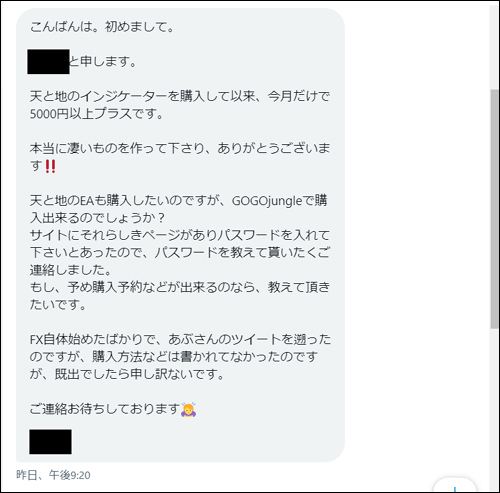
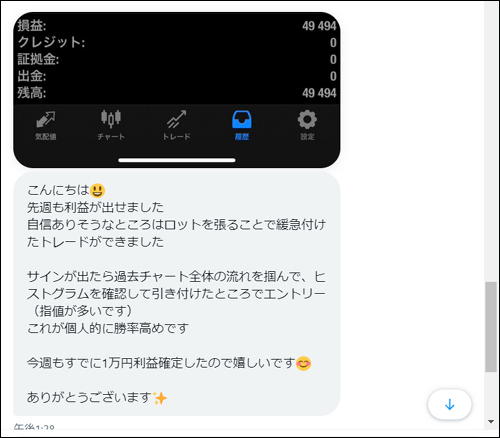
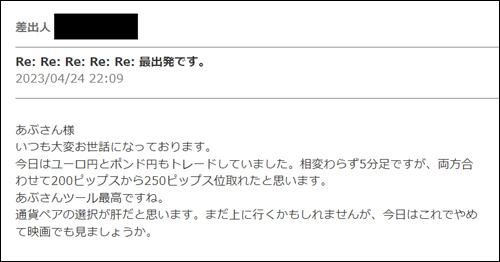
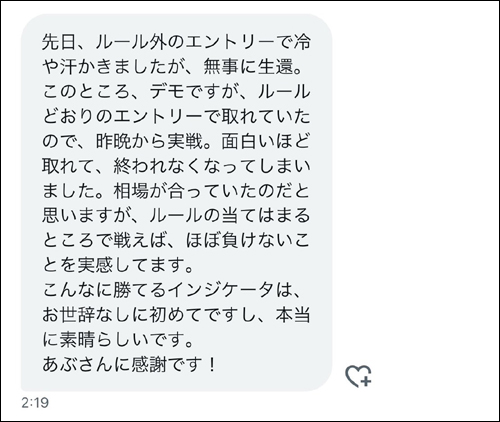
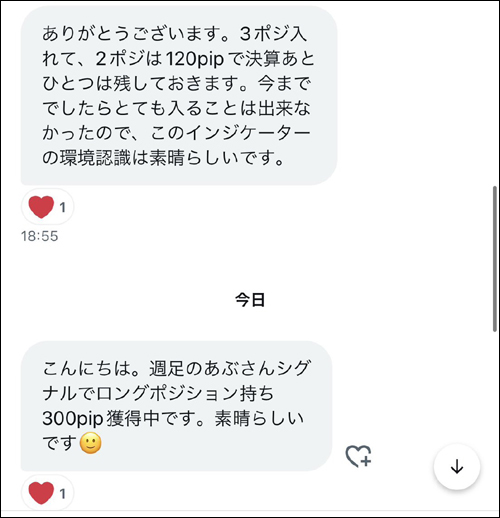
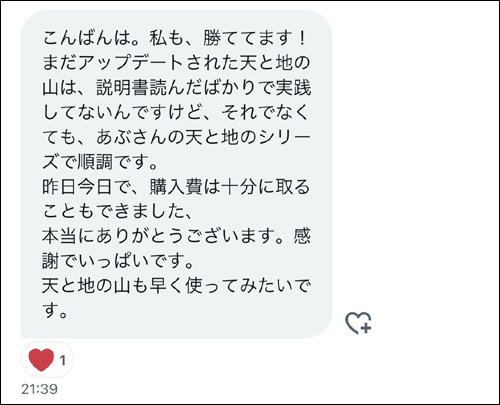
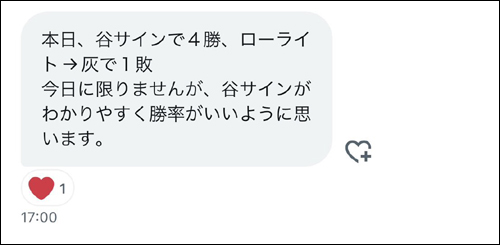
・Impressions from users who actually used the Heaven and Earth Indicator (DM Version)
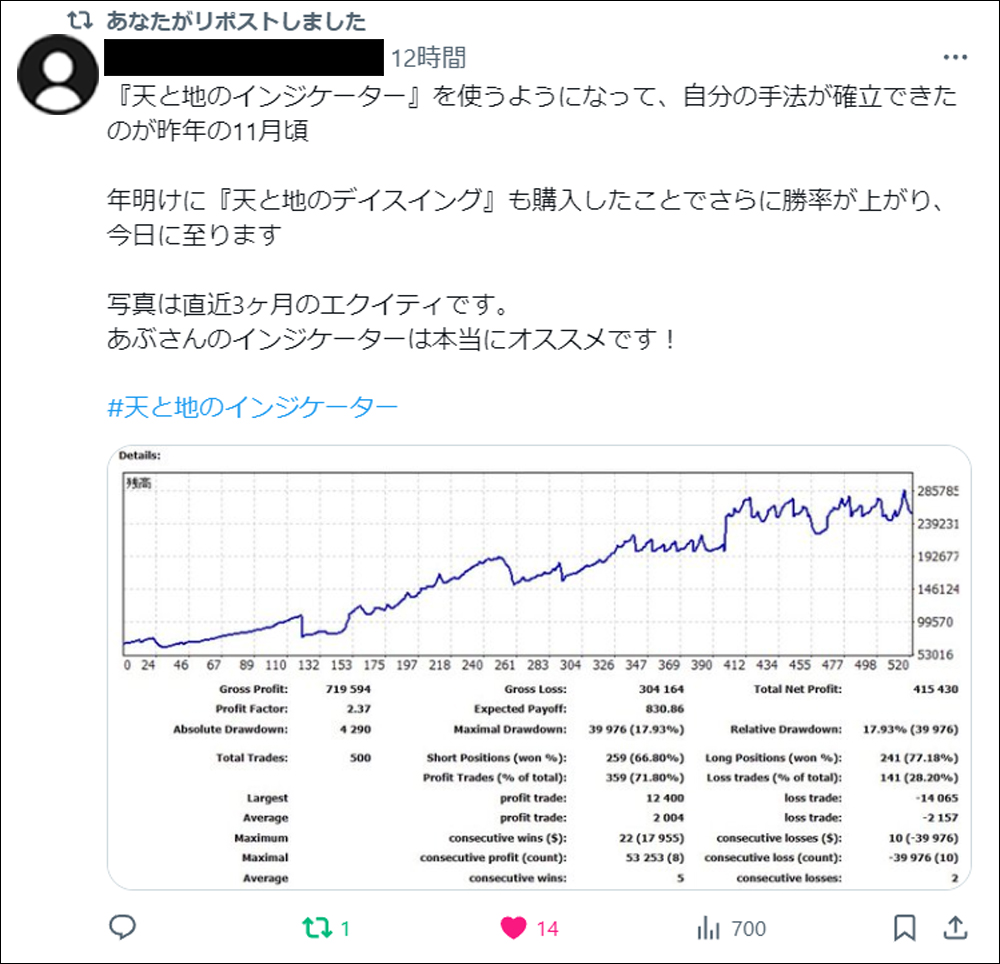
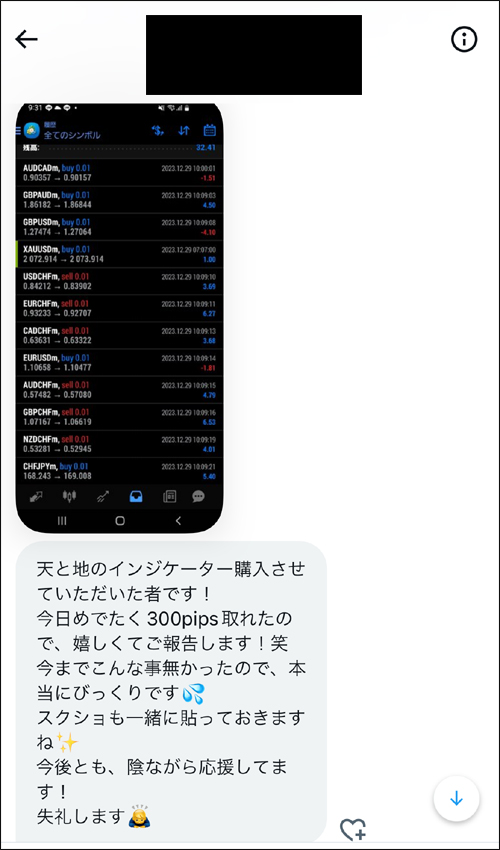
・I searched for “#Heaven and Earth Indicator”
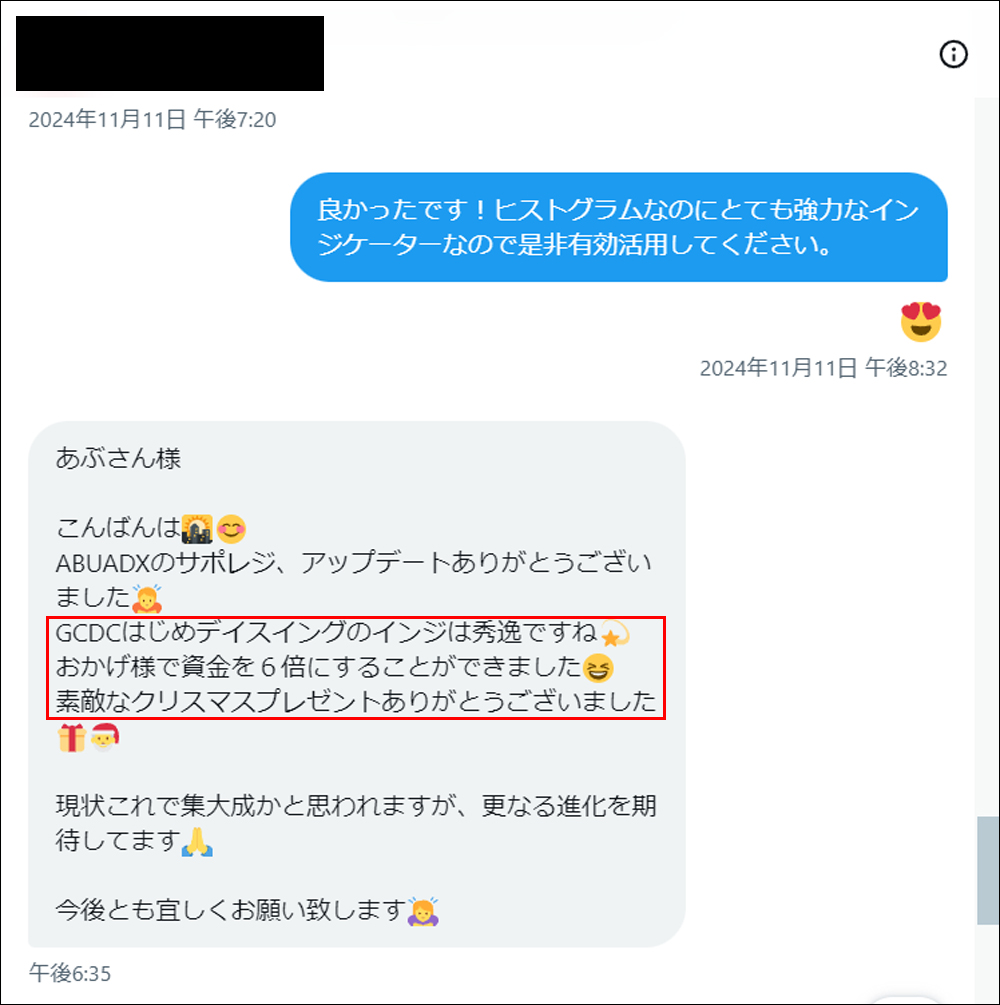
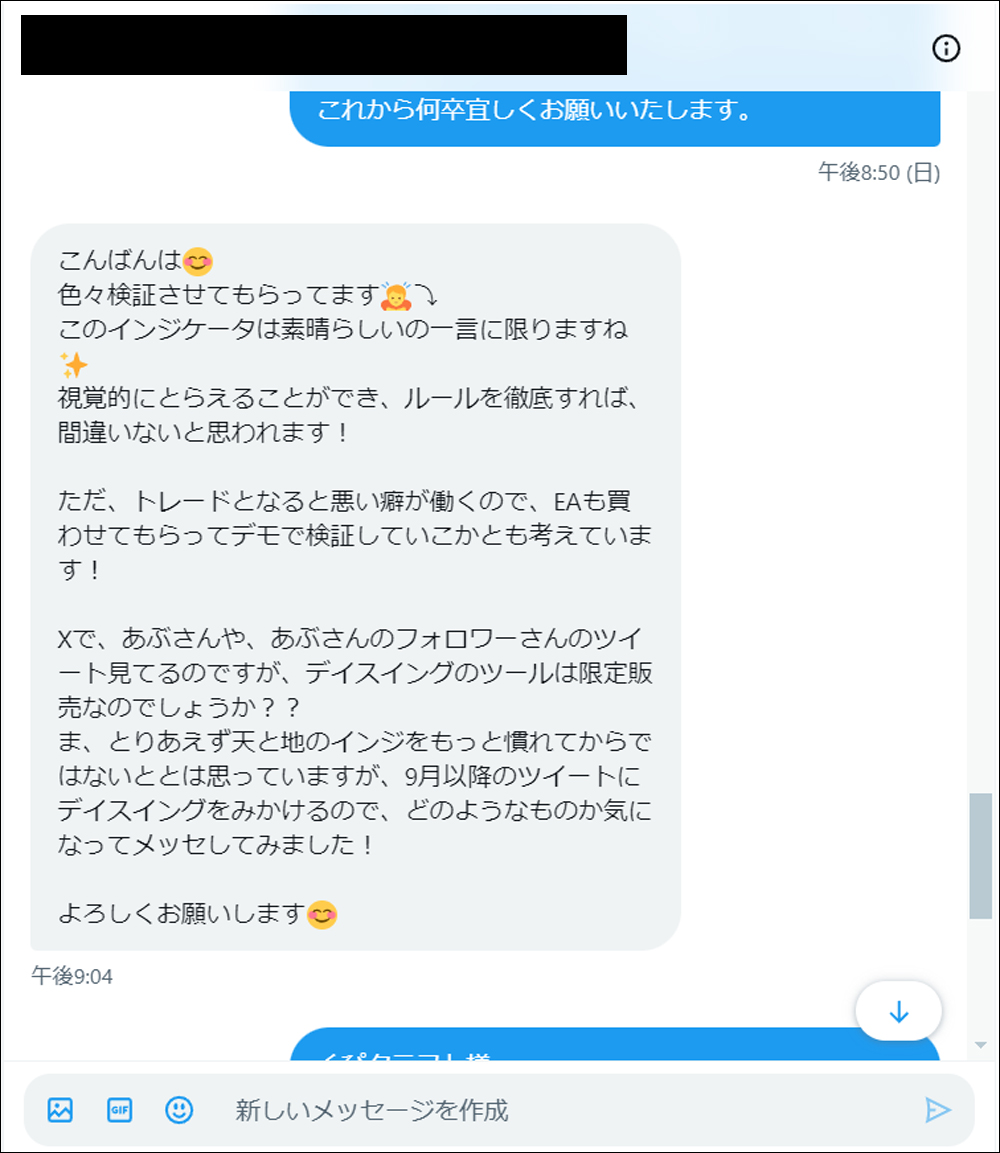
・Introducing posts from monitors who actually used the Heaven and Earth Day Swing
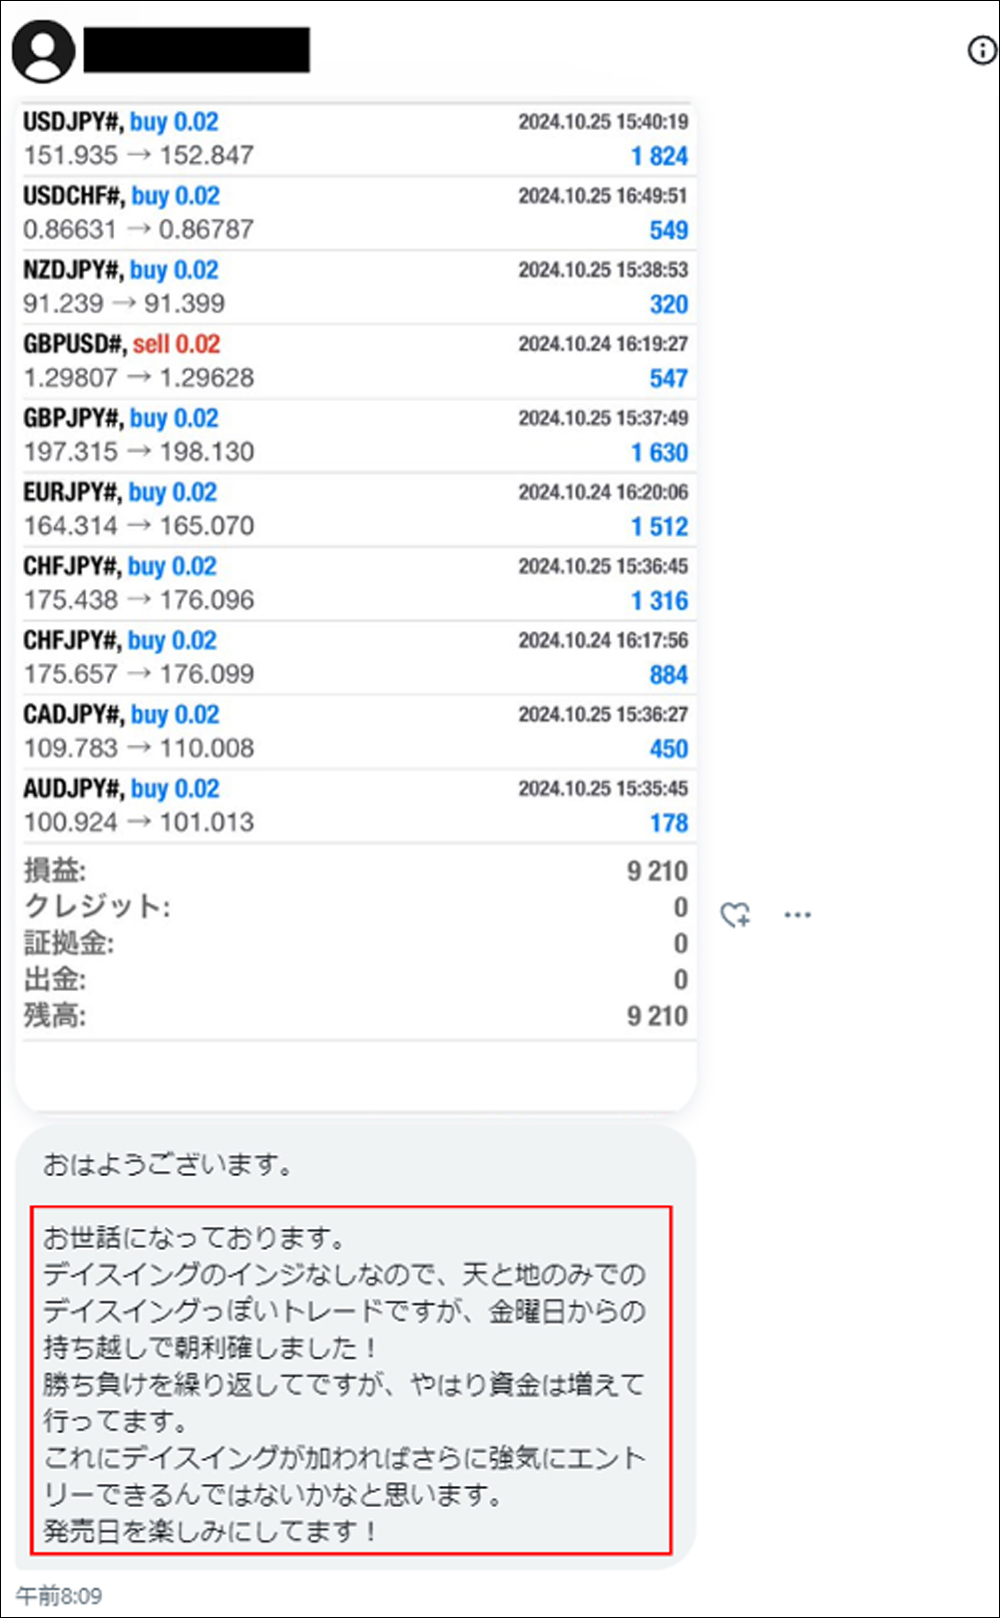
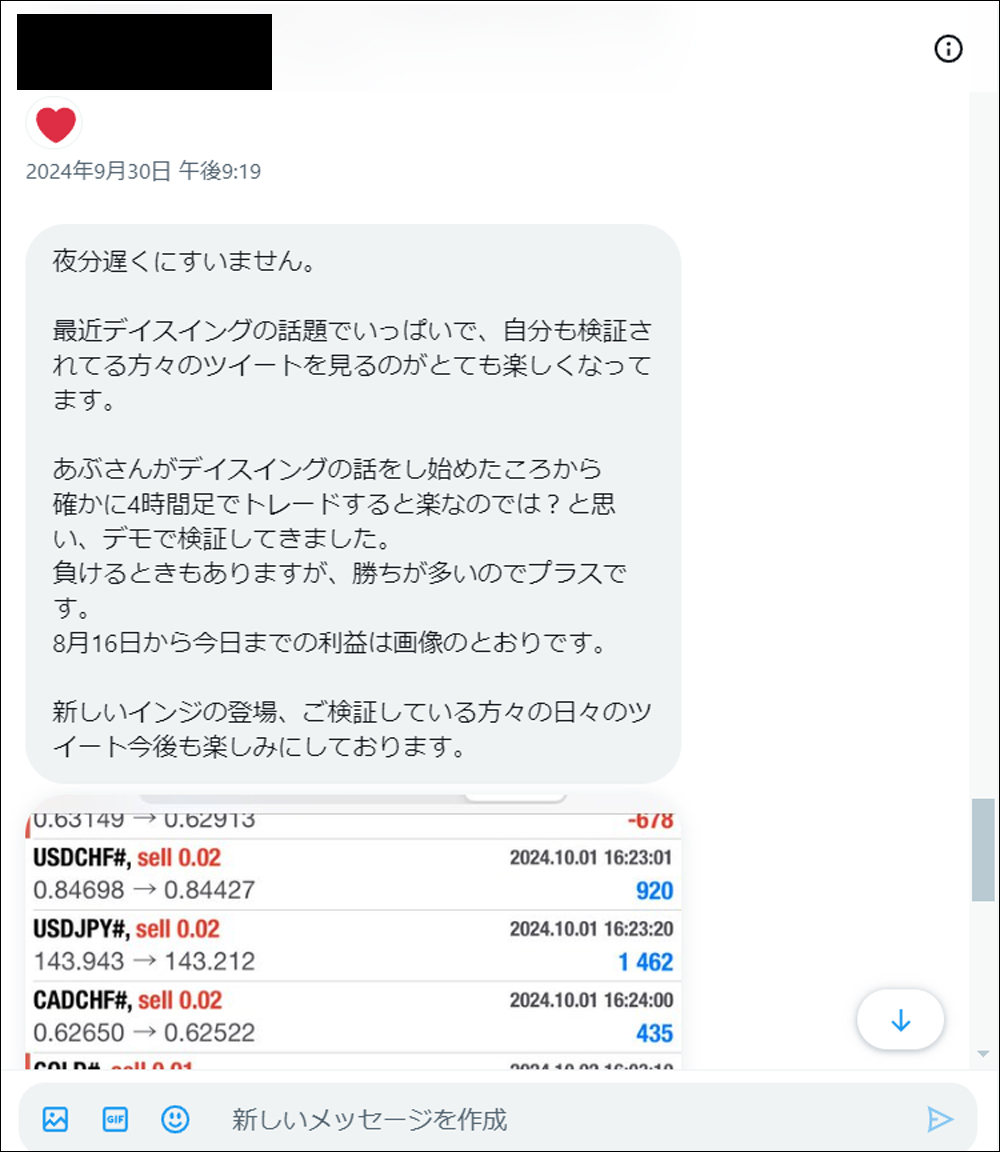
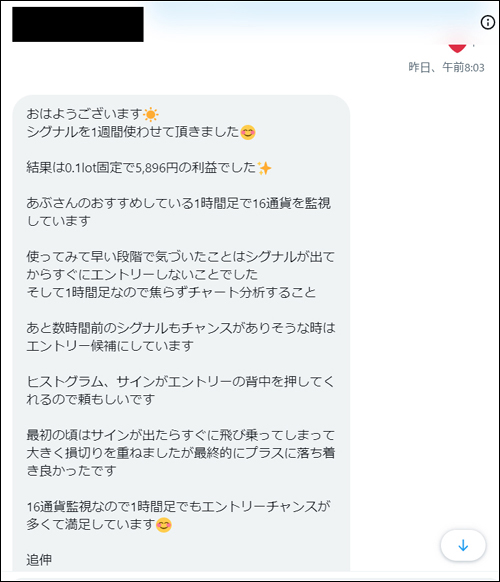
・Impressions from users who actually used the Heaven and Earth Day Swing

・Heaven and Earth Indicator is a trading method that uses my original indicator, released in February 2022.Thanks to everyone’s support“GogoJungle Award 2022, 2023, 2024, which I have won for three consecutive years.
・In this article,“Heaven and Earth Indicator” is used to test and discuss the“Heaven and Earth Day Swing”Heaven and Earth Day Swing as a method. For the basic trading method of the Heaven and Earth Indicator, please refer toarticles before August 2024.


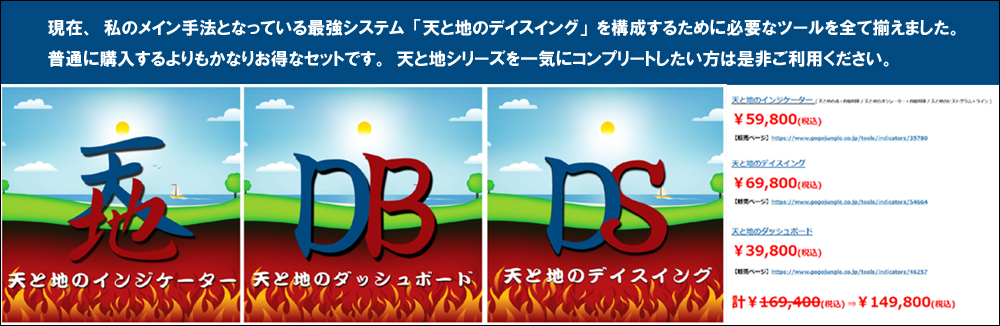
【Limited Edition】Full Set of Heaven and Earth
【Abusan / Special Video Vol.1】Users are over 3,200 and counting! Are you still trading FX without Heaven and Earth? Would you like to relax while earning?

【Abusan / Special Video Vol.2】Ability gap? No, equipment gap. Those who don’t use this will be split by a huge margin.


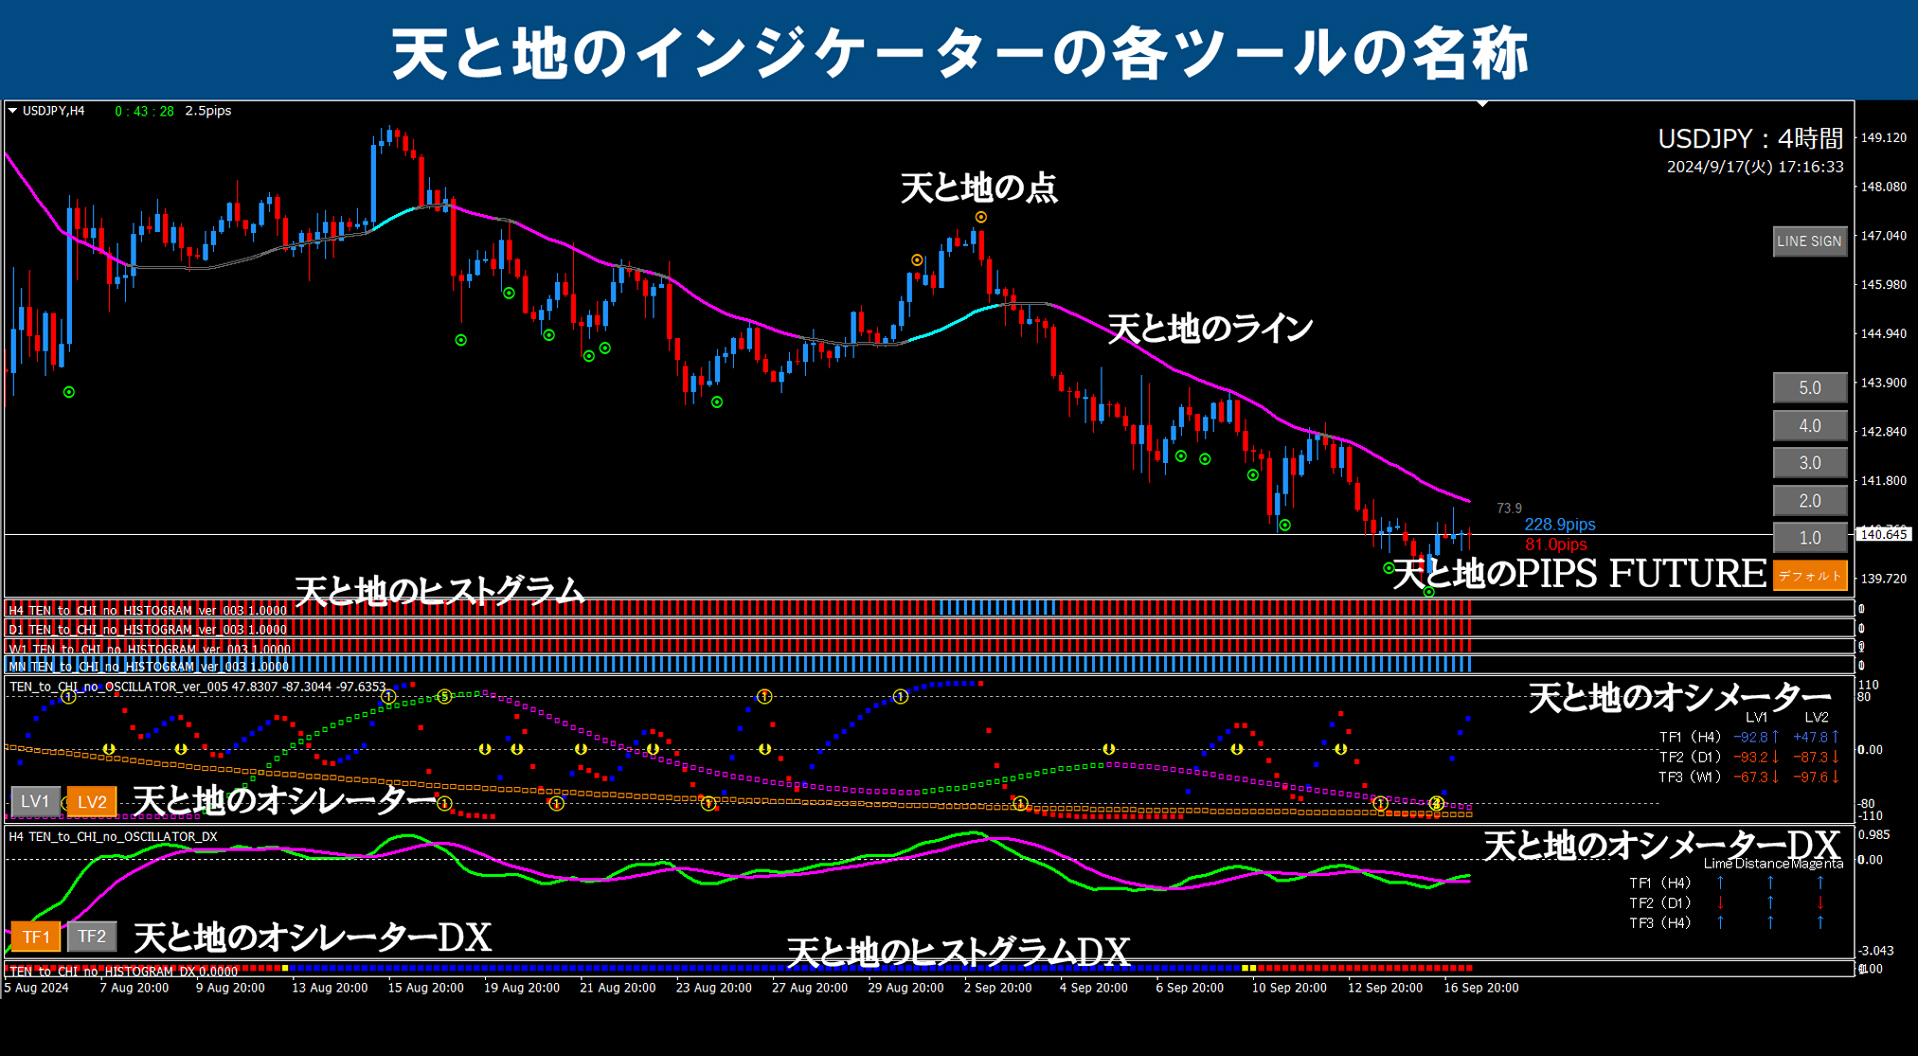
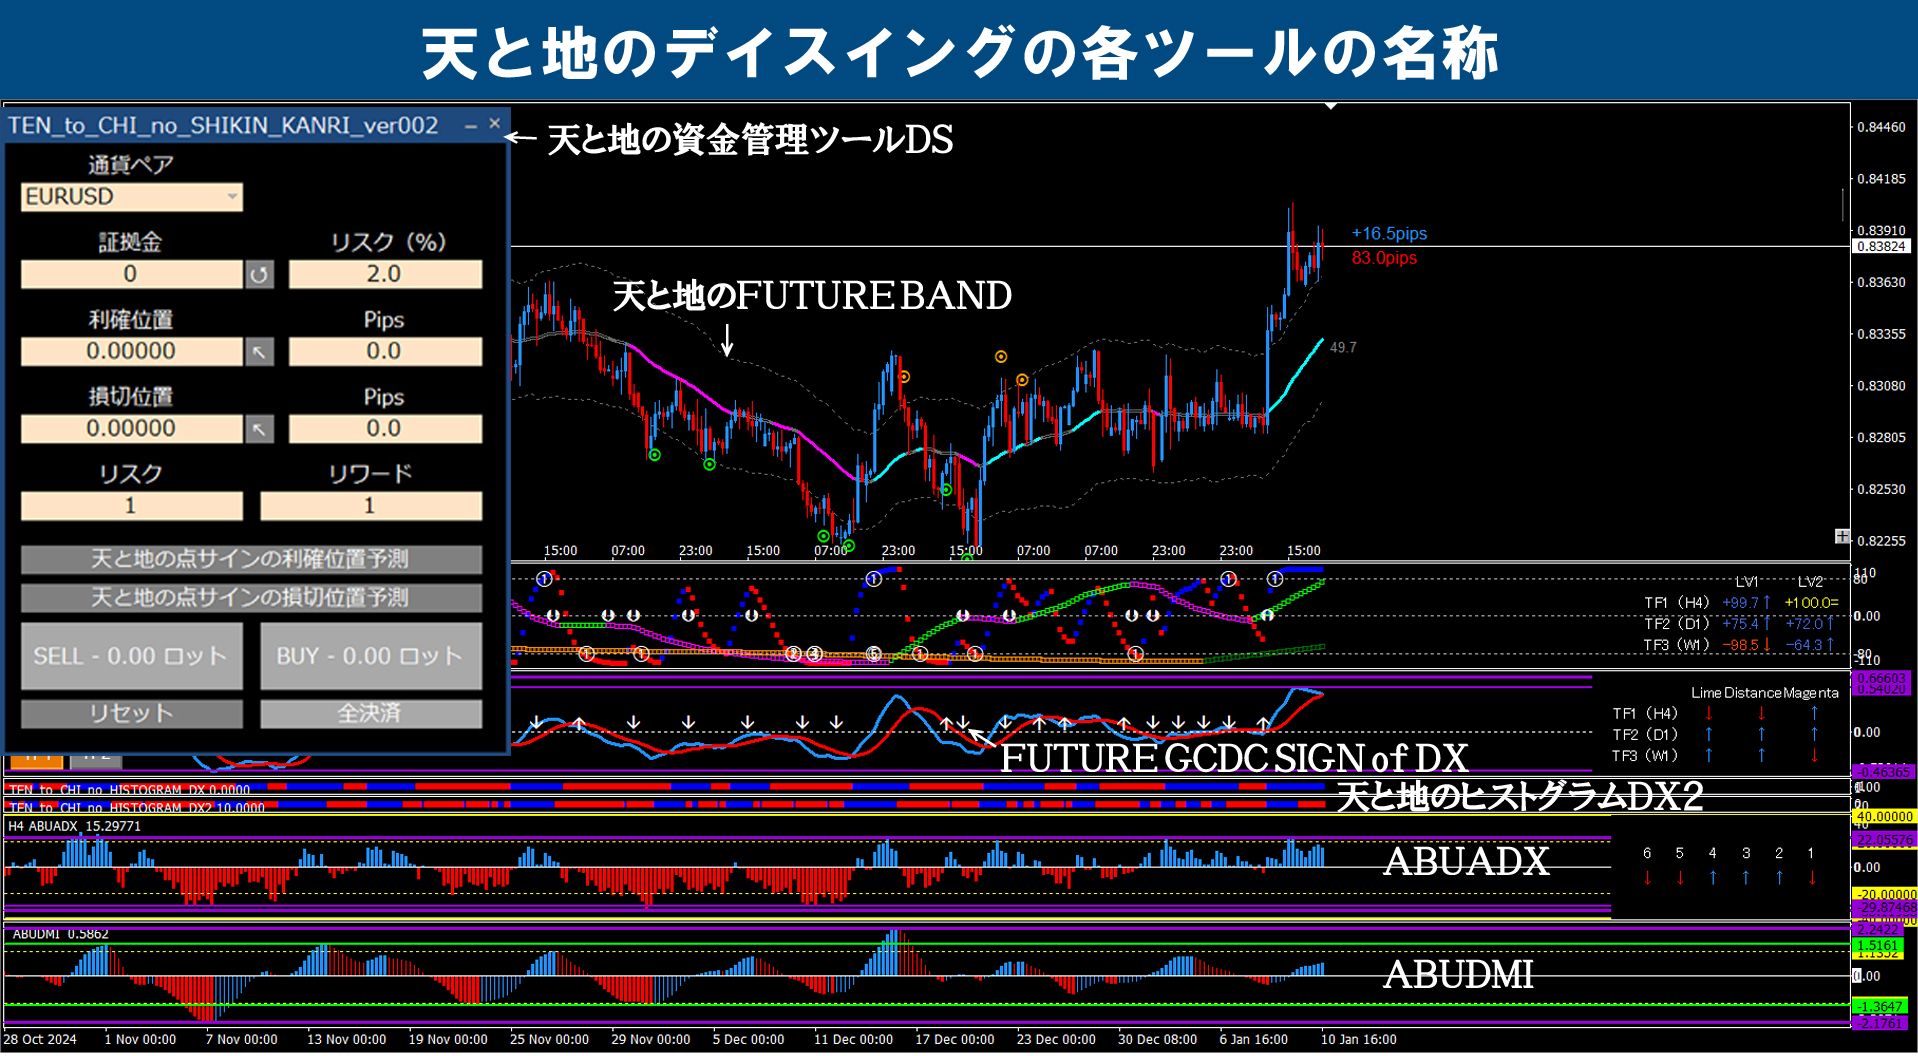
※ For terms used on this blog,please refer to the image below.(All images can be enlarged by clicking)


Bitcoin (BTC) / 1-hour chart + 4-hour chart + daily past verification
※ The yellow dotted line is drawn at all timeframes in the same location.
※ The yellow circles mark important points.
※ Clicking the chart will enlarge it.
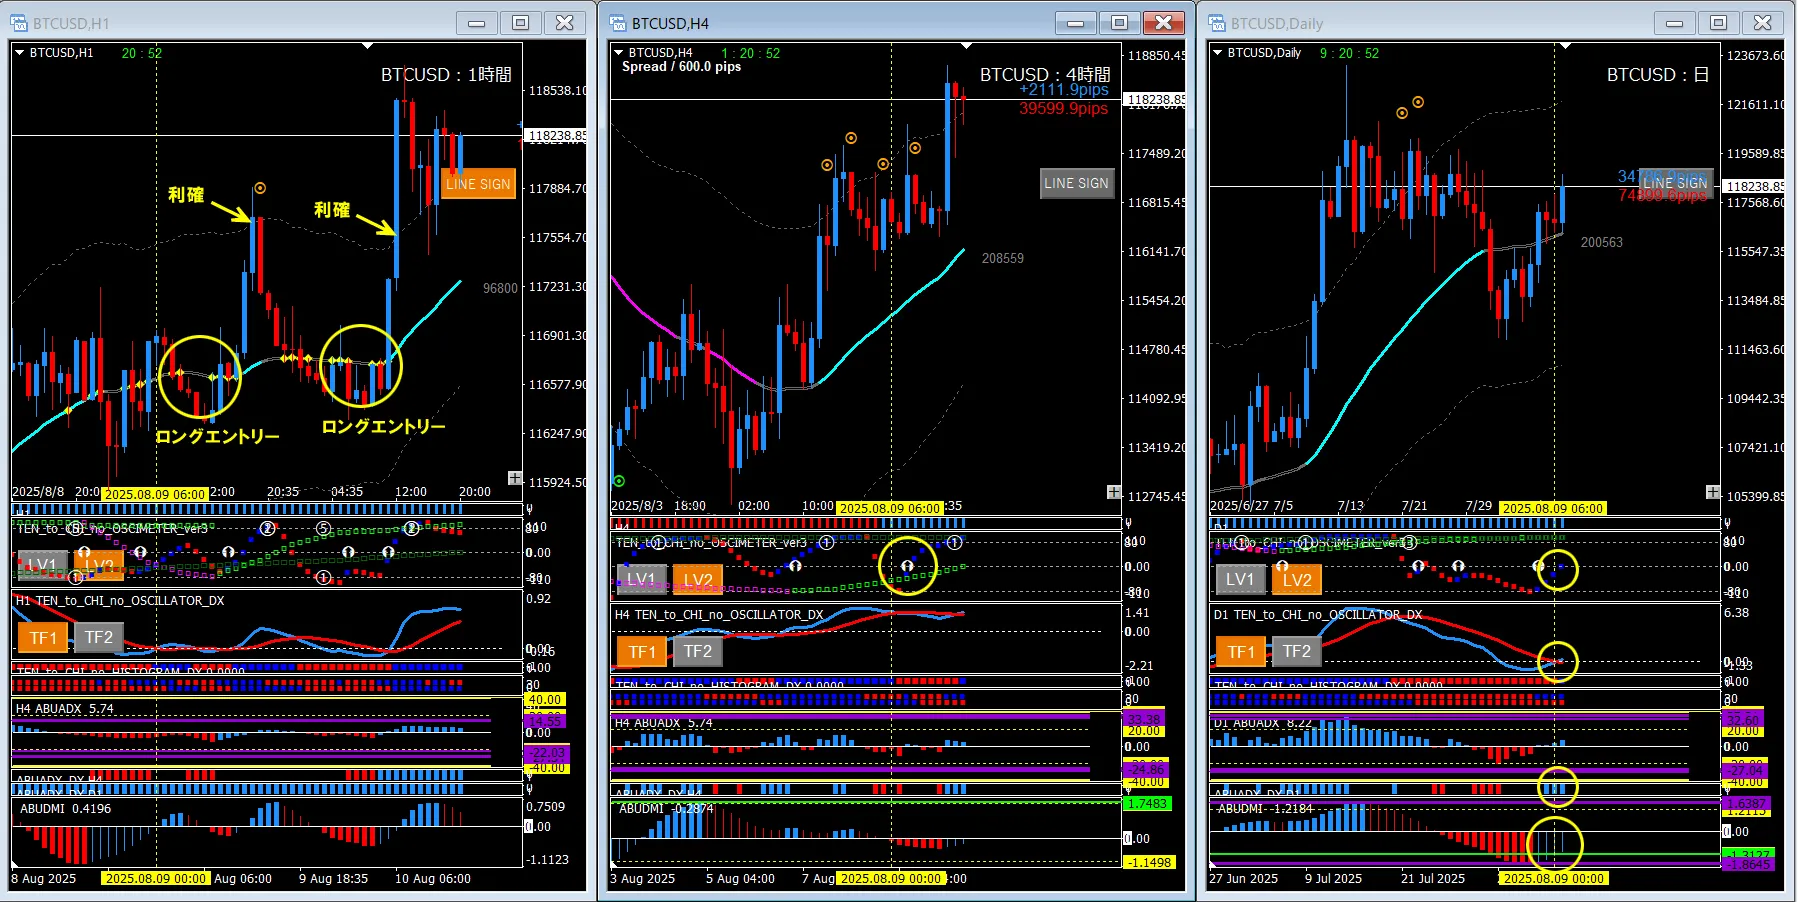
■ 1-Hour Chart (Left: Entry Point)
・Line Touch Entry
■ 4-Hour Chart (Center: Market Context)
・Oscillator TF1 (Upward Reversal)
■ Daily Chart (Right: Market Context)
・Oscillator TF1 (Bullish Flag/Buy the Dip pattern)
・Oscillator DX (Upward Cross)
・ABUADX_DX (Blue)
・ABUDMI (Blue)
■ Summary
On the daily chart, multiple good patterns can be confirmed. The 4-hour oscillator also looks good. Based on these, I will search for a long entry point on the 1-hour chart. By the way, the ABUADX_DX on the 1-hour chart is shown for both 4 hours and 1 day.
■ If you use DSATEA
Since I judged the outlook as bullish at the yellow dotted area, I will set DSATEA to long-only on the 1-hour chart. It also works to set the ABUADX_DX filter to (1 day). It may take 24 bars to confirm, so we cannot do precise backtesting, but since we use real-time movement, it can have a significant effect depending on the market.

I hope this is a little helpful to everyone.
If you could press the GOOD mark, it would give me motivation for the future. I would appreciate your continued support for even greater enthusiasm.
