2025-8-9 This Week's Dollar/Yen Next Week's Dollar/Yen
【This Week's USD/JPY and Next Week's USD/JPY】
The image below displays 『Trend Line Pro 2』 and 『Next-generation Zigzag from the World's Smallest Start』 overlapped.
USD/JPY chart image【This Week】
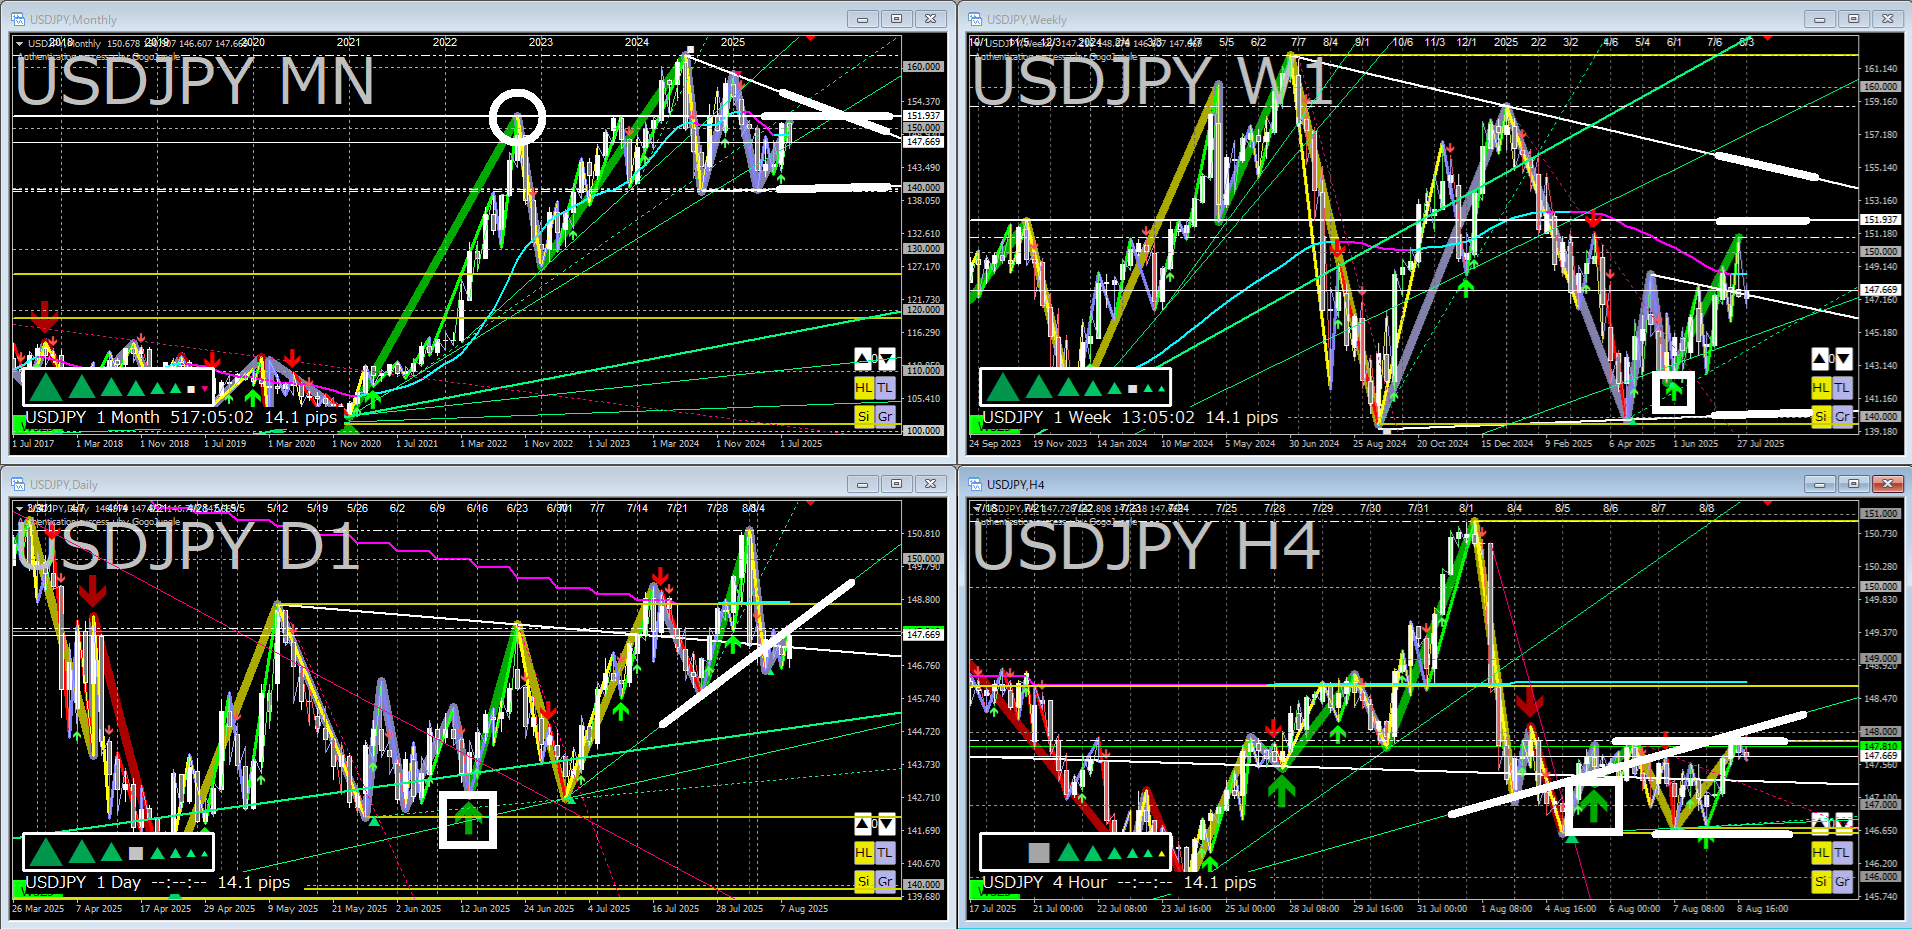
【Long-term View】
From the monthly chart's bearish triangle (descending triangle), a break below 140 yen is a realistic consideration.
However, looking at the 140 yen touch intervals on the monthly chart, it seems a bit more time for correction is required before the downside break.
After a brief rise, it’s natural to test lower levels again.
If, after the time correction, a break below 140 yen cannot be achieved, there is also a non-zero possibility of a sharp move toward a stronger yen depreciation.
As a premise, at the monthly level we are still in the middle of an uptrend.
【Weekly View】
*Continuation is displayed by pressing the button below.