

Use of the "Visualization Indicator" (Part 211)
“Visualization Indicator” usage (part211)”
1. Further evolve the “28 Currency Pairs List Indicator” into an indicator
“8CP Visualization Indicator”to drawCADJPY.
The “8CP Visualization Indicator” includesOceania版 (version),LondonNewYorkAnyCP版. This time, I used theNewYork版.
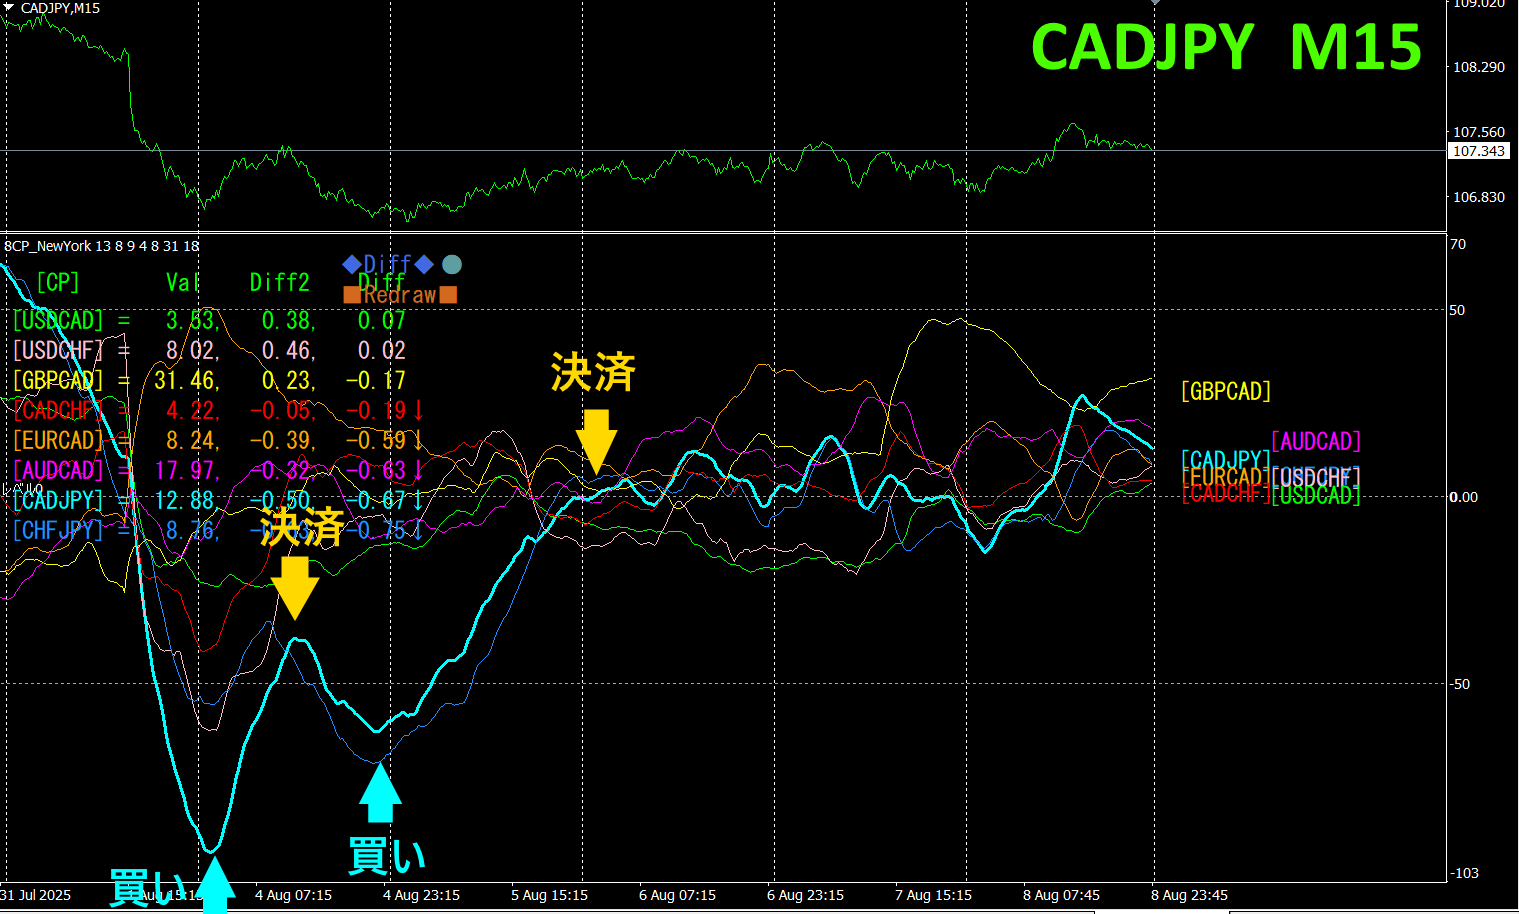
The upper half is a 15-minute chart ofCADJPY. The lower half is from the “8CP Visualization Indicator”; the light blue thick line graph corresponds toCADJPY.
This time, I targeted the rebound from the bottom ofCADJPY. On Monday and Tuesday, theCADJPY chart showed a strong rebound, so I traded only in this part. Each about60pips and about50pips, totaling about110pips profit.
Currency Strength/Weakness Graph
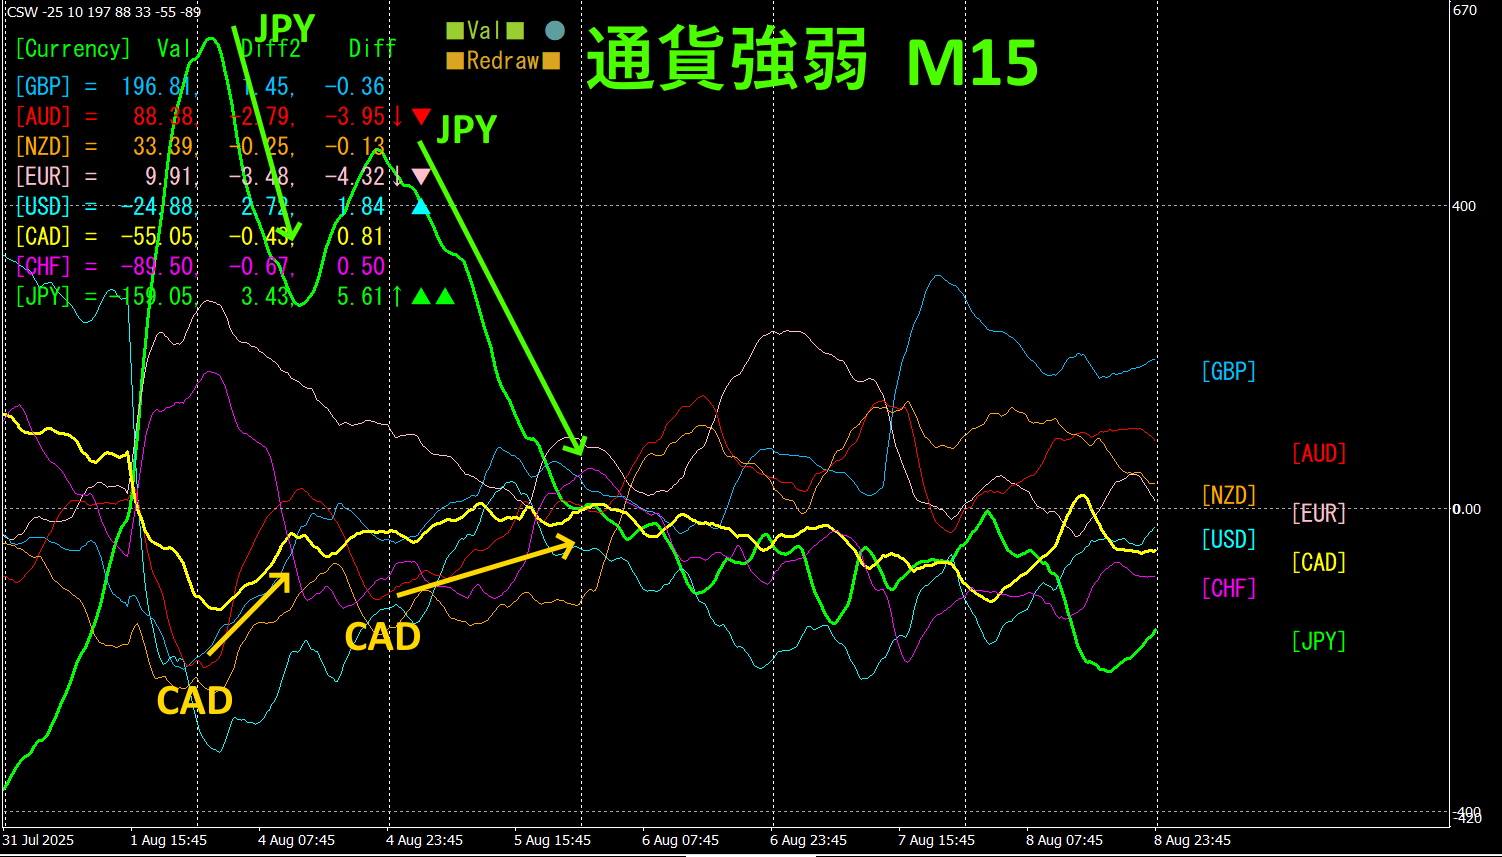
Looking at the 15-minute currency strength/weakness graph,CAD andJPY show a remarkable inverse correlation.CAD andJPY move from dispersion to convergence, creating ideal conditions to buy
“Aim for Inverse Correlation of Currency Strength!”isFX’s iron rule.
If you are using the “TrendLine-EX, you can automate entries and exits when a trendline is breached. You can leave it as is, enabling easy trading. “TrendLine-EX is a semi-automatic EA that sells on trendline breaches and automatically closes on trendline breaches above.
2. Best SelectTry the indicator
The following figure is a screenshot taken on2025 year8 month7 day21:23 (JST).
[Total]Numbers are arranged in descending order. At the very topGBPCHF shows blue coloring on all timeframes.Total value is +3605.57, a large positive number.GBPCHF indicates a pronounced uptrend.
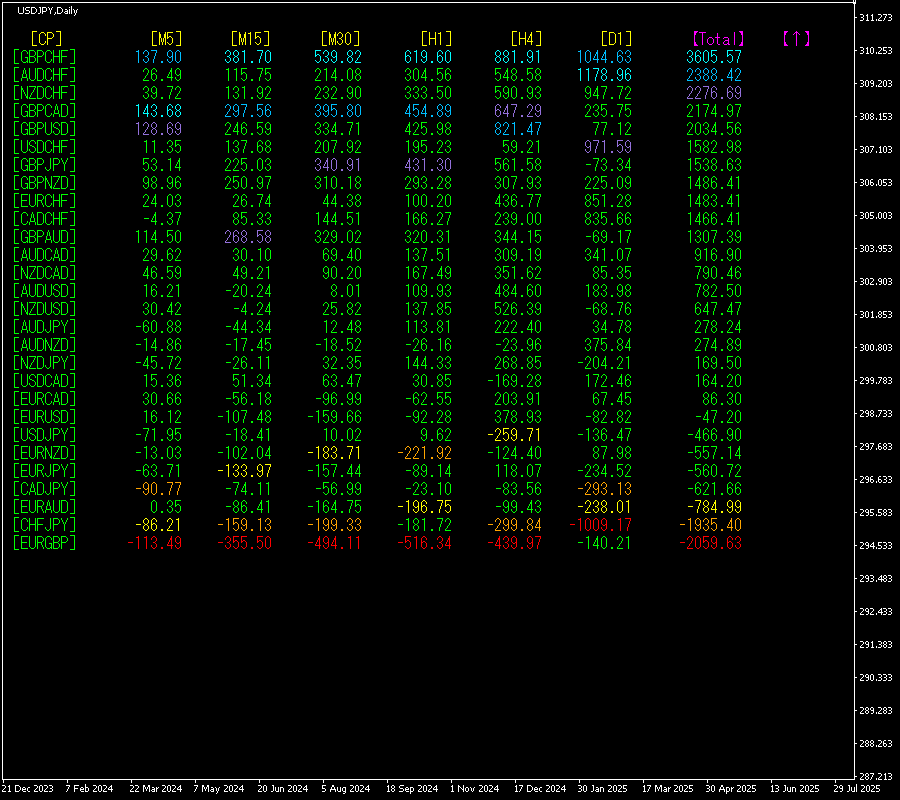
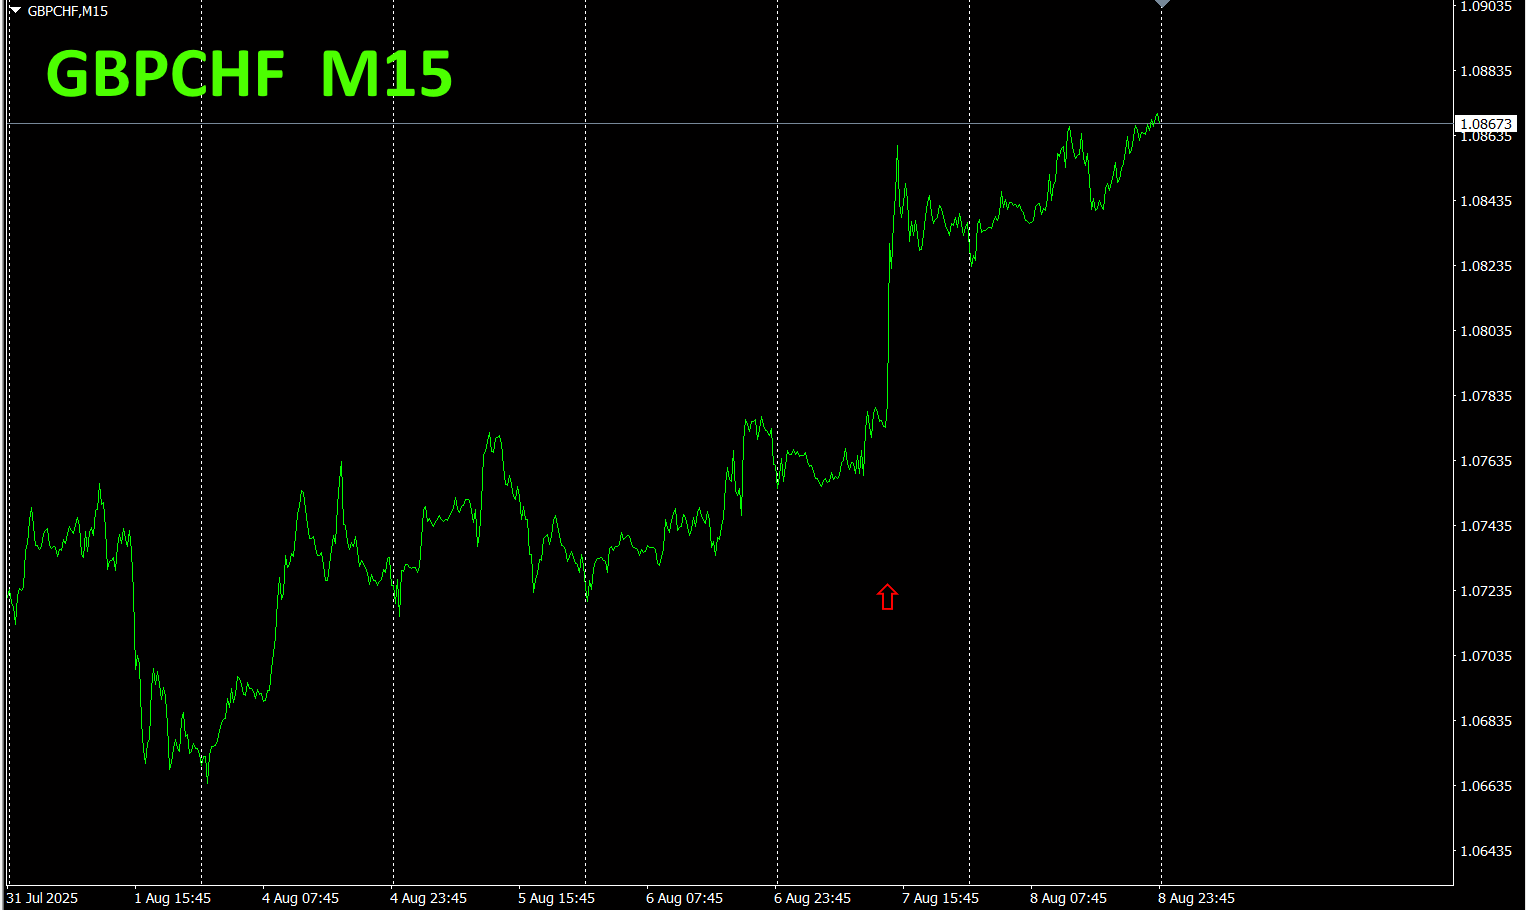
Now, let’s look at the chart forGBPCHF.
The red arrows indicate the point where the screenshot was taken. It corresponds to a steep rise during the uptrend.
The “28 Currency Pairs Best Select Indicator” can easily identify which currency among the 28 pairs is showing the strongest trend. It also tells you whether you should trade now with numeric values and colors. It provides an overview of all currency pairs at a glance.
“28 Currency Pairs Best Select Indicator”
https://www.gogojungle.co.jp/tools/indicators/35128

3. 2021Year5monthto followthe movement of EURJPY
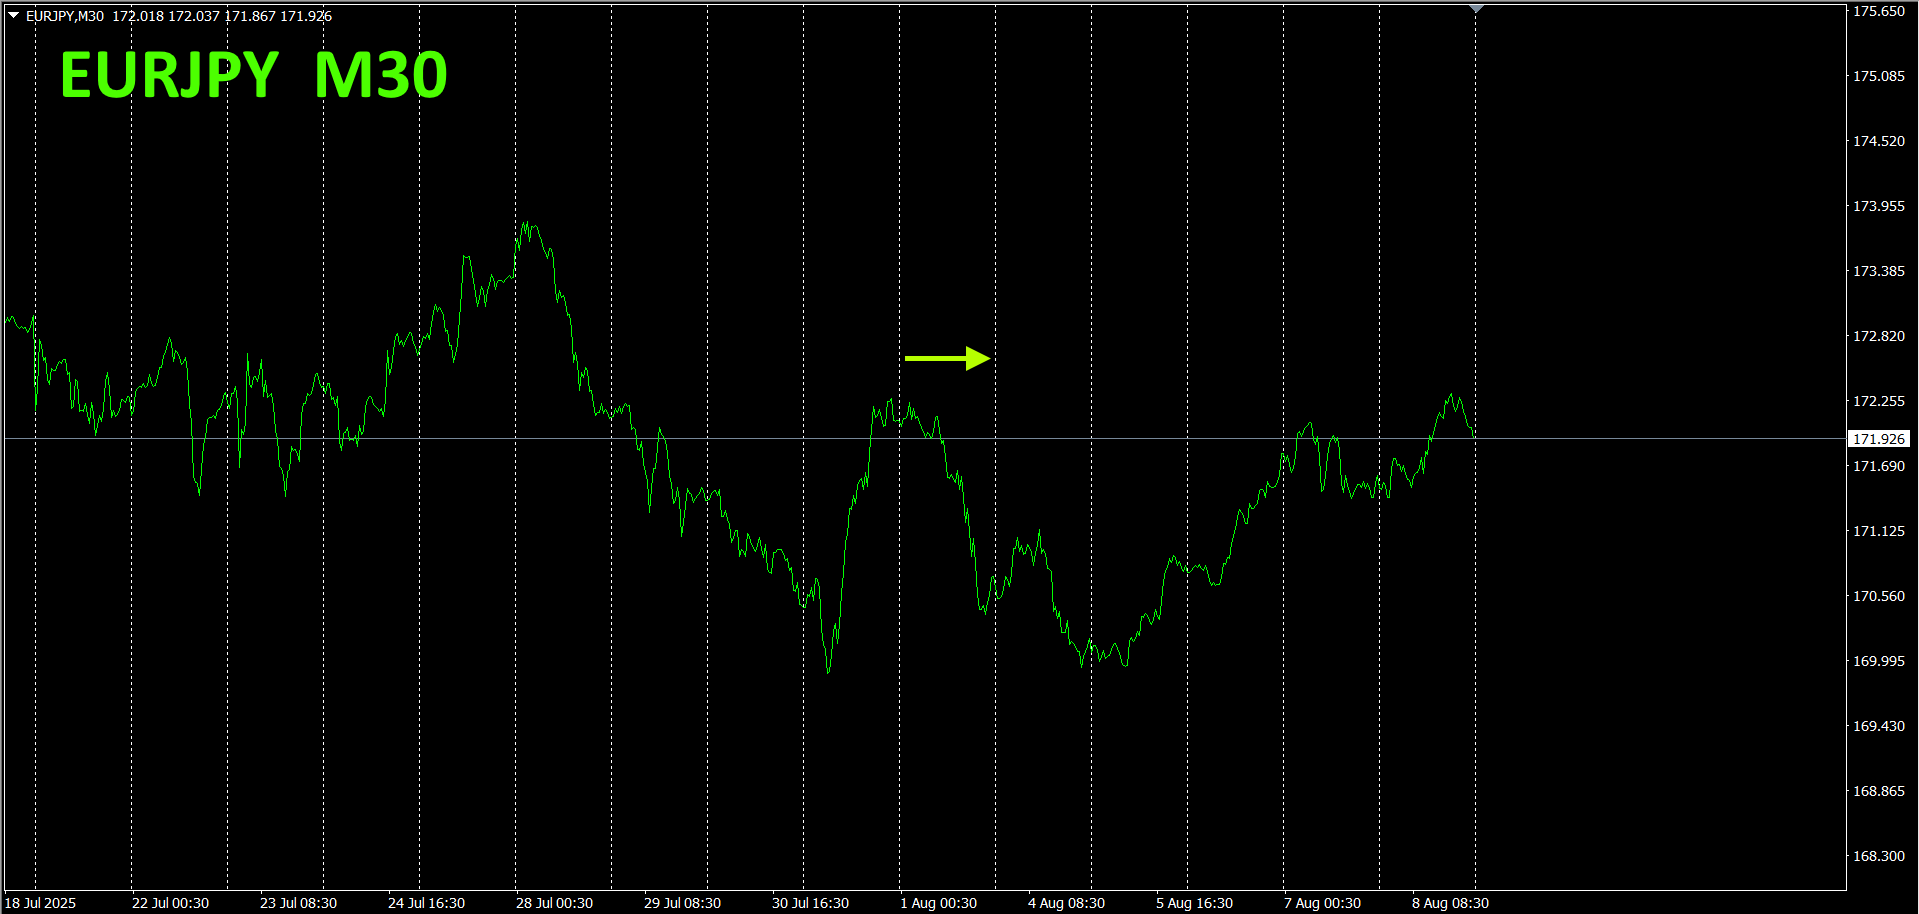
Yearmonththe move of EURJPY
To view the overall trend, a30minute chart covering the most recent approximately3 weeks is drawn.
Last time I wrote as follows.
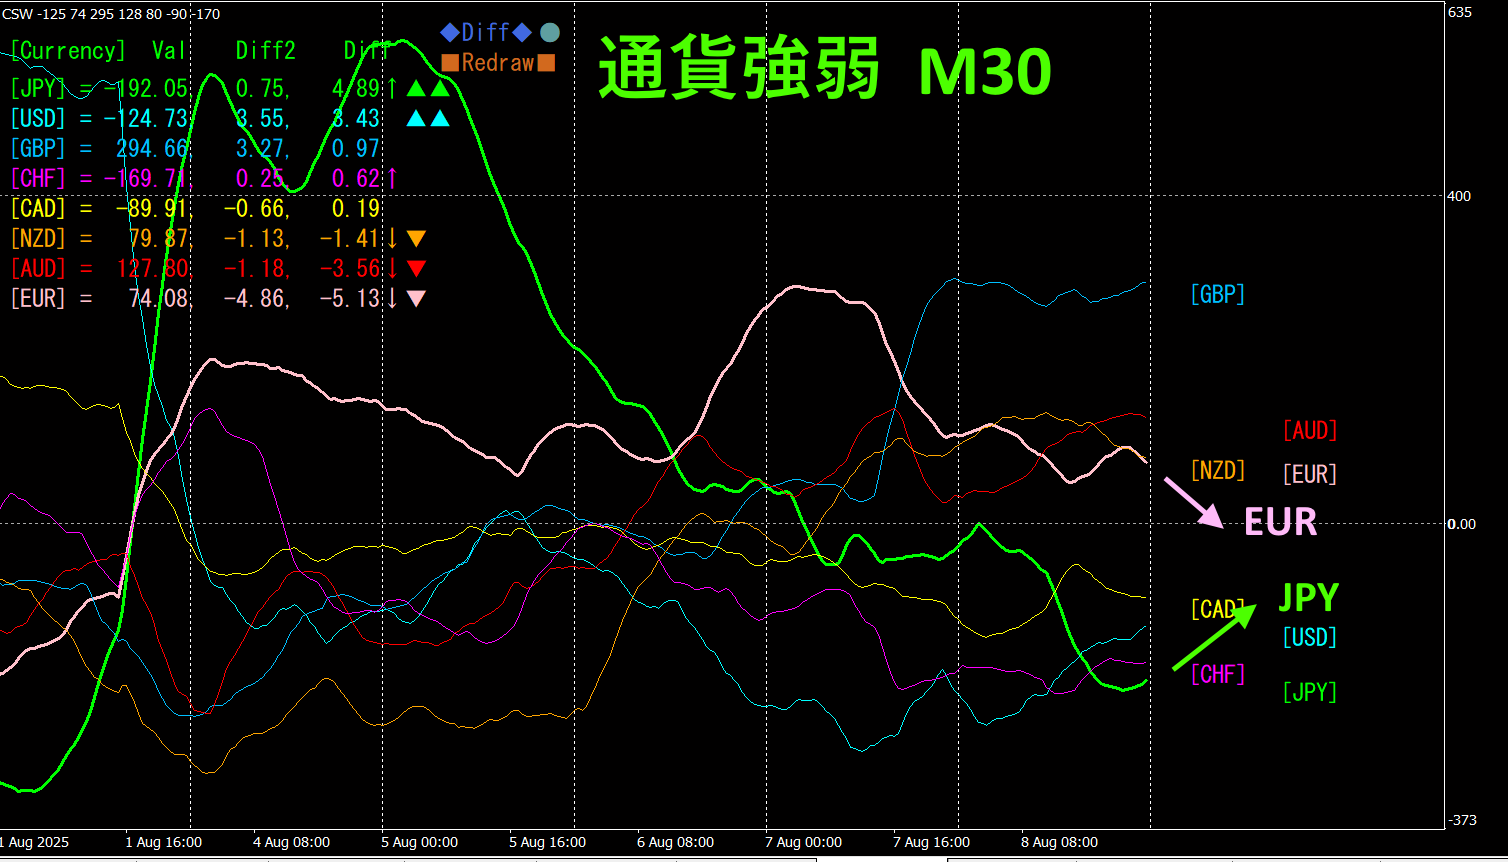
Pink isEUR, green isJPY. On the chart, bothJPY are starting with a sharp move., so EURJPY is expected to move downward, but this weekend’s movement is too sharp to read ahead. I will assume a downward direction for now.
It seems like a range.
30 minute currency strength chart.
Pink isEUR, green isEURJPYEURJPY
4.
New indicator “Dual_MACD_Trend_Indicator” is as follows.
MT4 version:https://www.gogojungle.co.jp/tools/indicators/62199
MT5https://www.gogojungle.co.jp/tools/indicators/62202
This indicator clearly shows the direction of the trend with color. If the color bar is Lime, it’s a buy; if Red, it’s a sell. It is beginner-friendly and easy to use. If the bar color is green, it is an uptrend; if red, a downtrend; if no color, there is no trend. Since it’s color-visual, you can grasp the trend state at a glance.
I have implemented this indicator on the EURJPY1
is currently in an uptrend, but it seems it will soon break the upward trendline. In the earlier currency strength chart, suggested a downward direction, but with the use of the, the market situation becomes clearer. Next, when this indicator’s color turns red, enter a sell; when green, close the position.
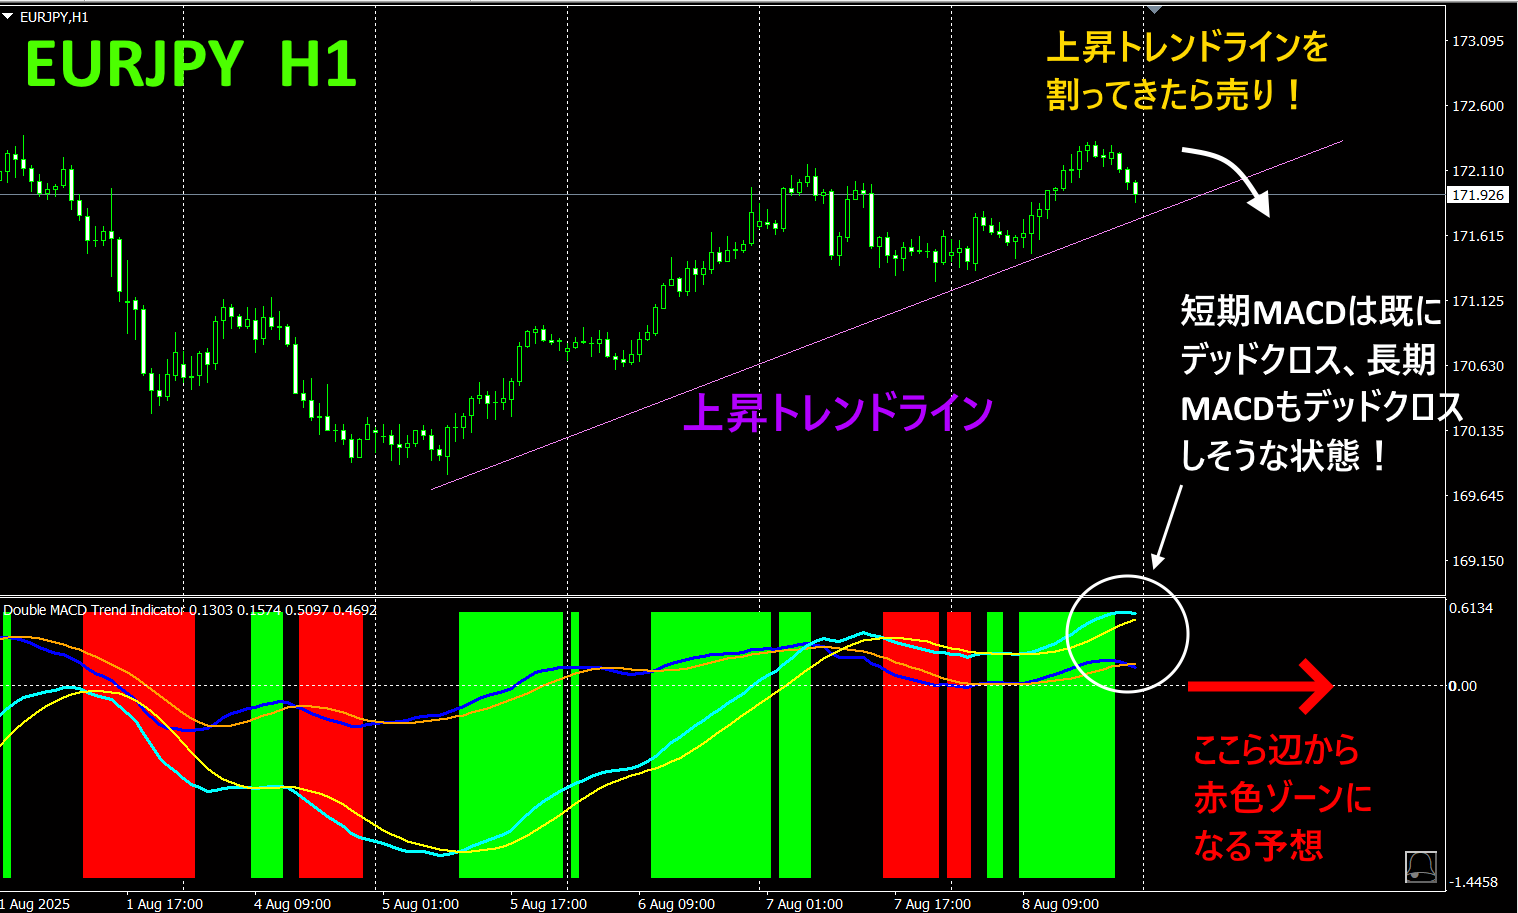
With “”, follow the simple rule: buy in green zones, sell in red zones, and do not trade otherwise.
By using “Dual_MACD_Trend_Indicator”, you will no longer have to worry about trade direction.
5.
“Hyper-CSW” has been released
“Hyper-CSW” is a high-performance indicator that visually displays the strength/weakness of the top 8 currencies at a glance. It records the strongest currency and score for the past 10 bars on the currently displayed timeframe, and accurately captures trend persistence and turning points. Furthermore, it supports multi-timeframe analysis showing currency strength rankings (top 4 currencies) across multiple timeframes such as M15, H1, H4, D1, and W1 with scores. Its high-visibility color lines and separate window display provide strong capability to gauge market direction.
For details, see the following link.
https://www.gogojungle.co.jp/tools/indicators/65082
※Recommended indicators
“Torito Indicator”
https://www.gogojungle.co.jp/tools/indicators/50115
“TrendLine-EX”

https://www.gogojungle.co.jp/tools/indicators/42257

“8C Currency Strength Visualization Indicator” is described on the following page.

version https://www.gogojungle.co.jp/tools/indicators/39150
version https://www.gogojungle.co.jp/tools/indicators/39159
【My listed items】


