

[August 8, 2025] Verification of the sky and earth indicators design (Gold)
This time, we would like to introduce the entry point for GOLD.
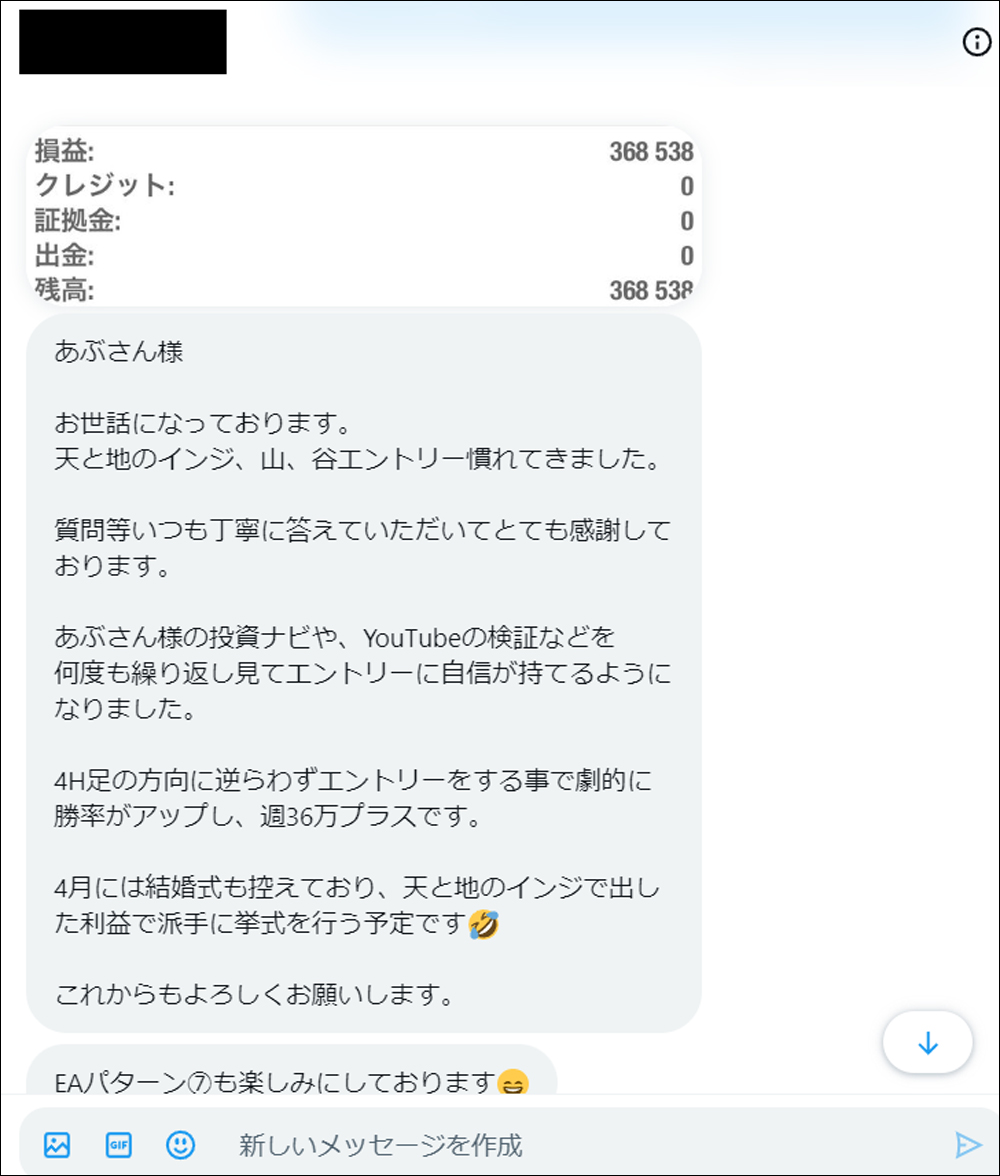

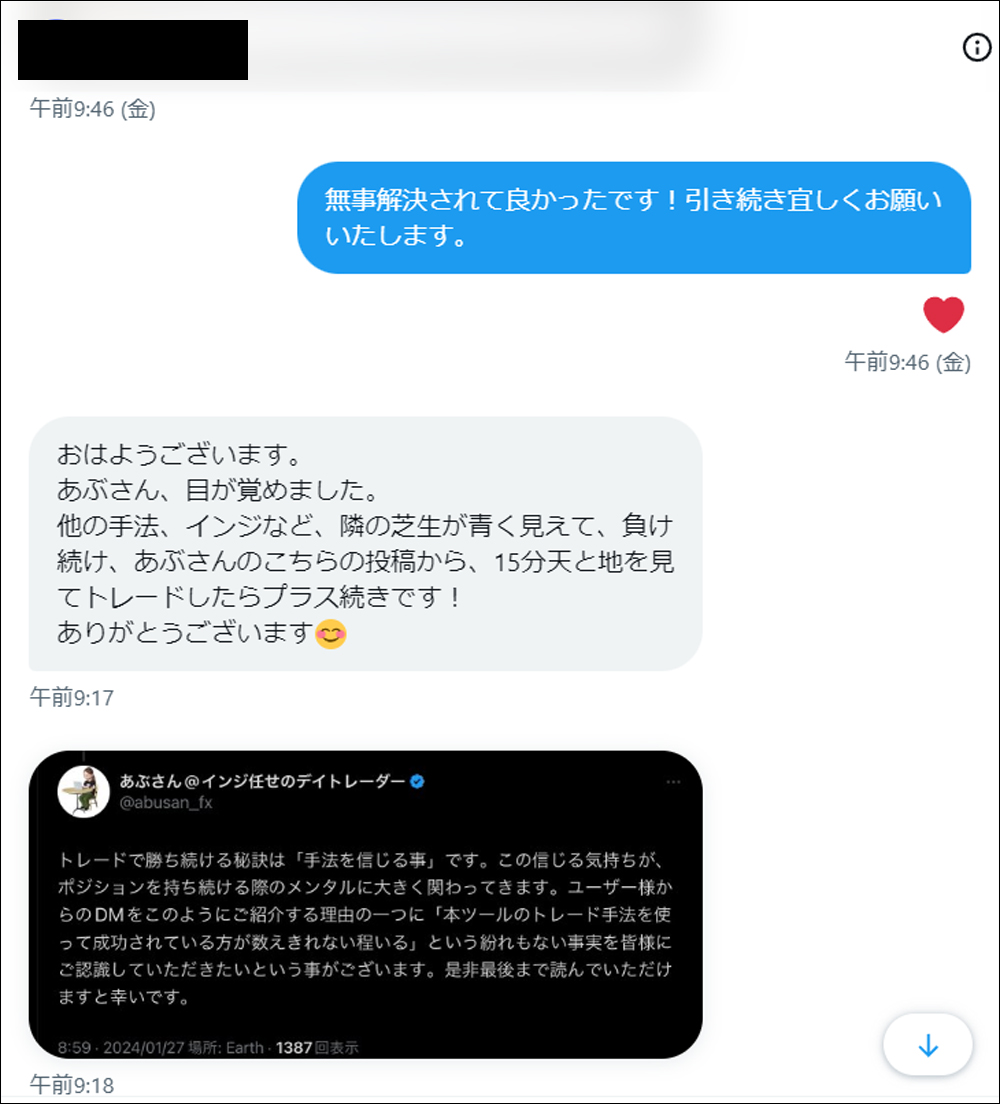
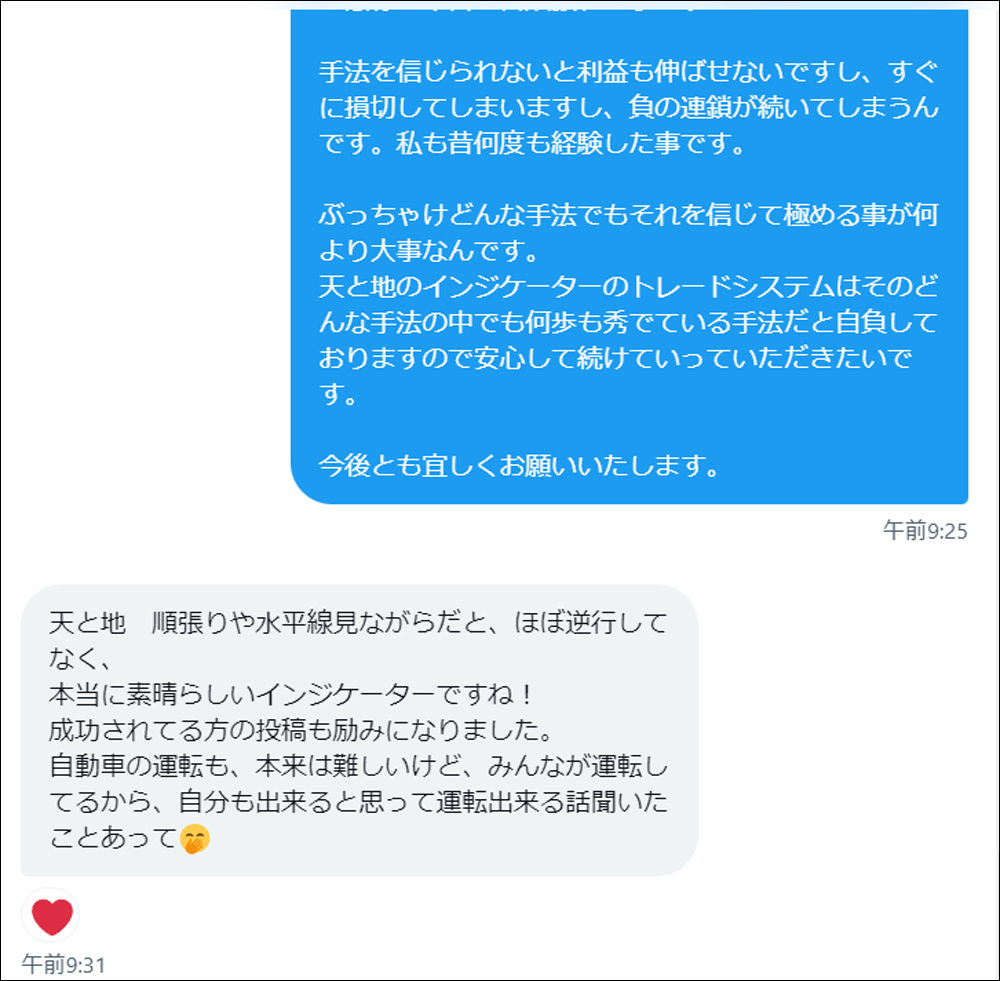
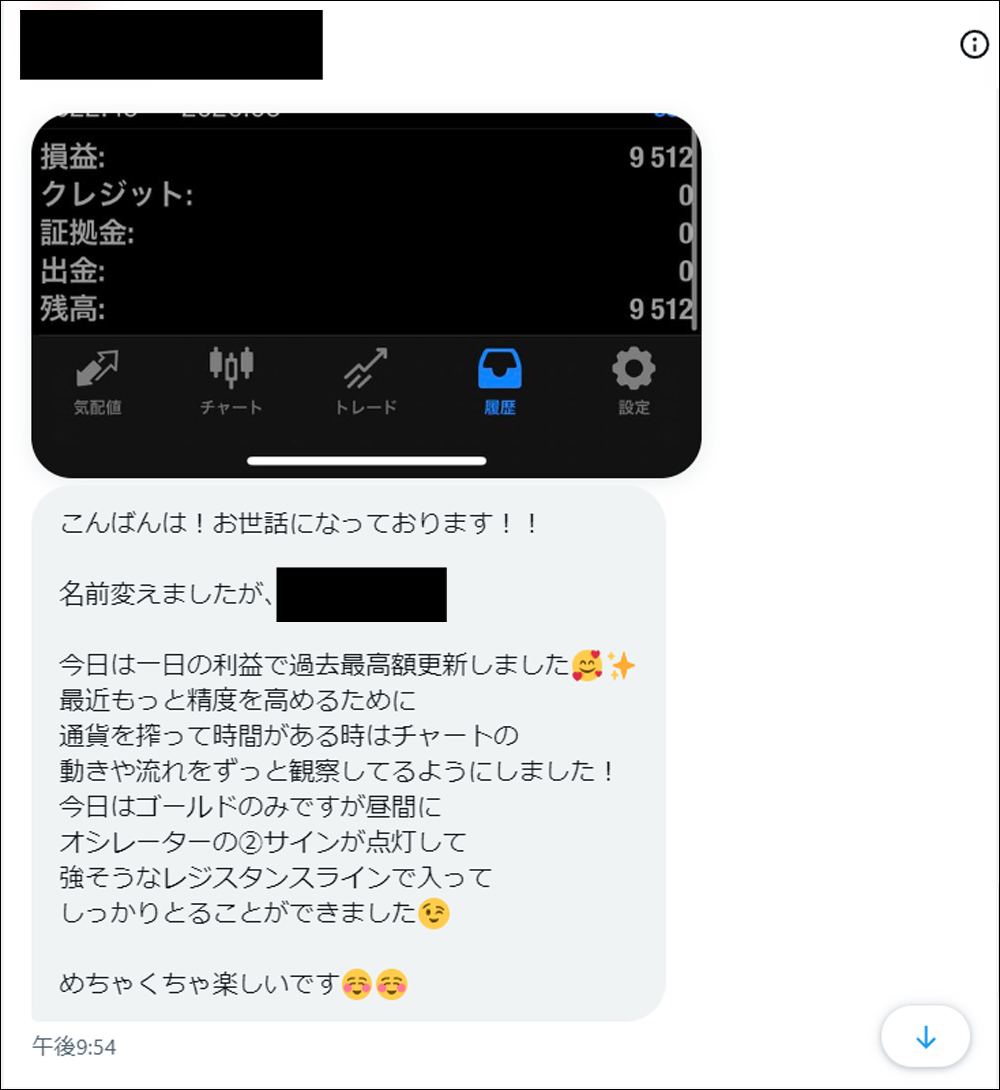
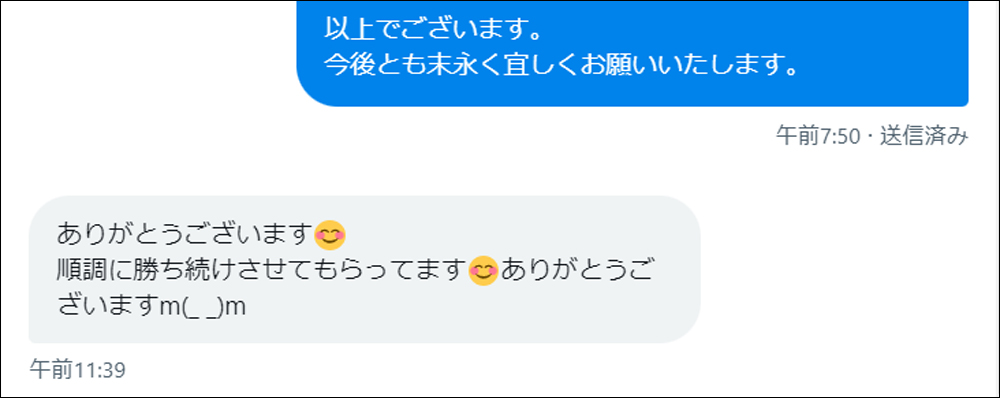
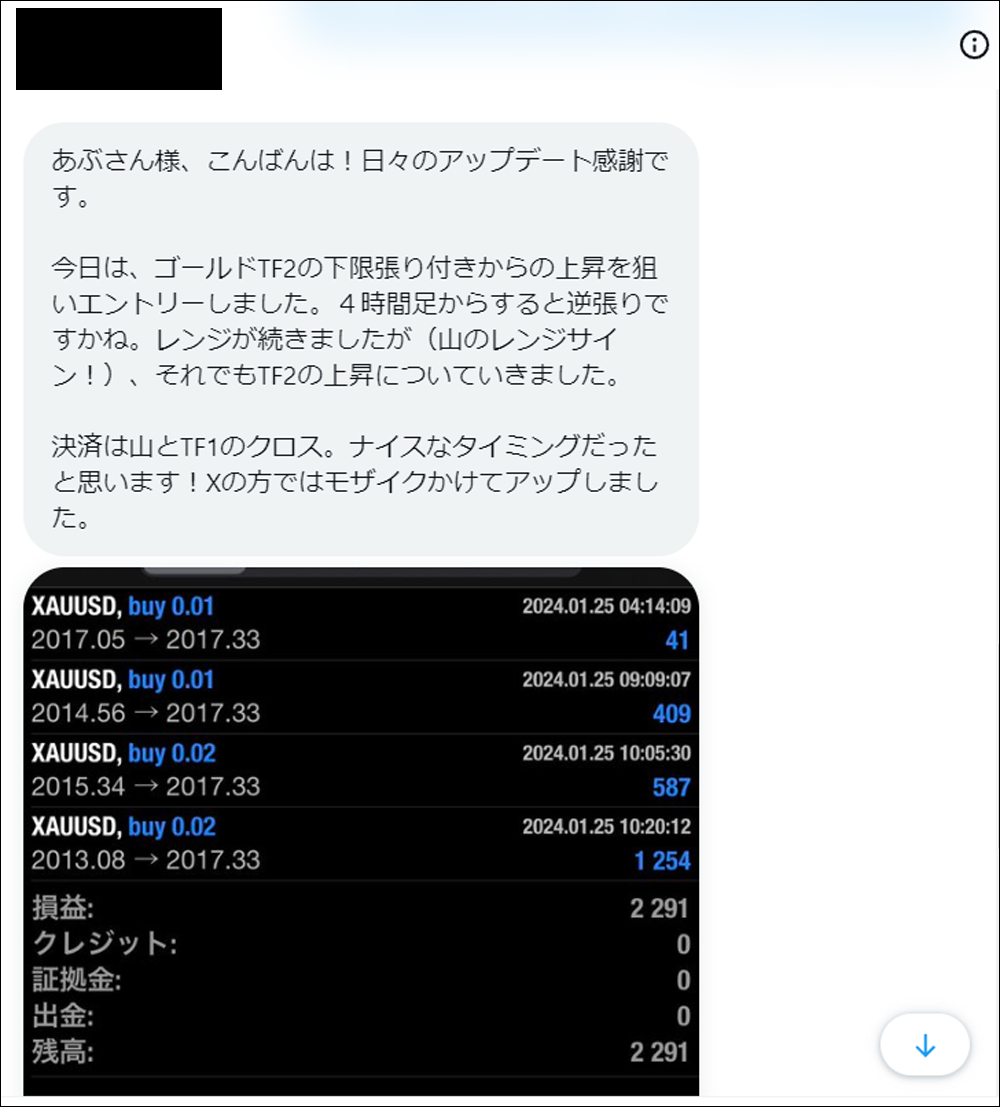
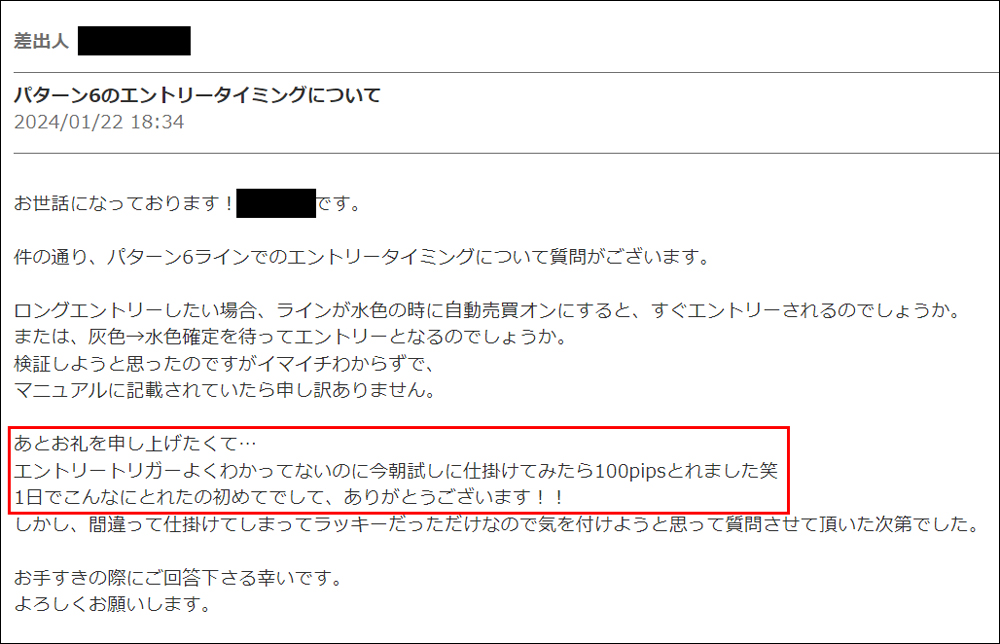
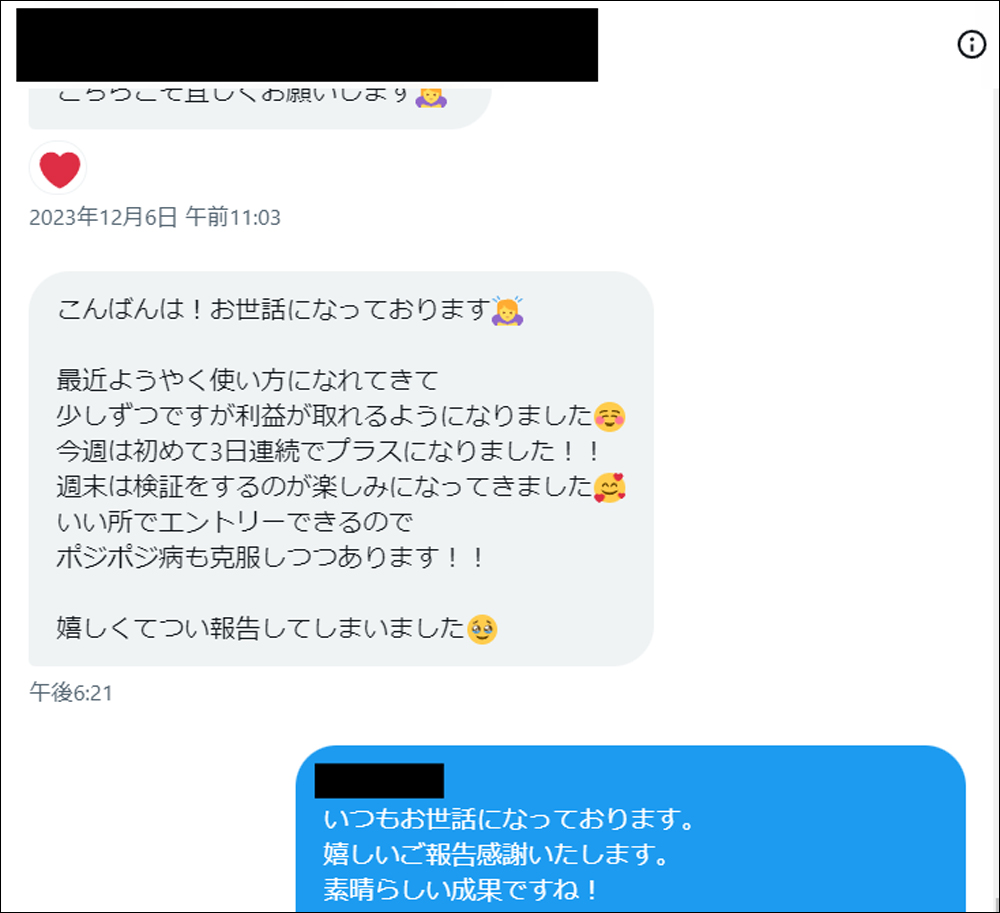


・The articles linked below introduce valuable DMs, reviews, posts, etc. from users and monitors. We are carefully selecting winning reports and other useful DMs, so we believe they will be helpful to everyone. We update these periodically, so please take a look when you have time.
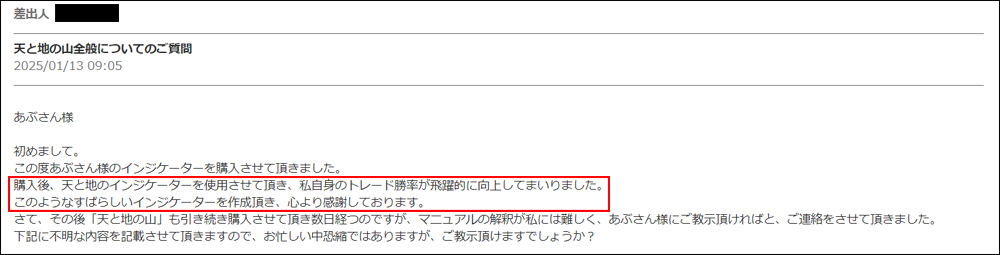
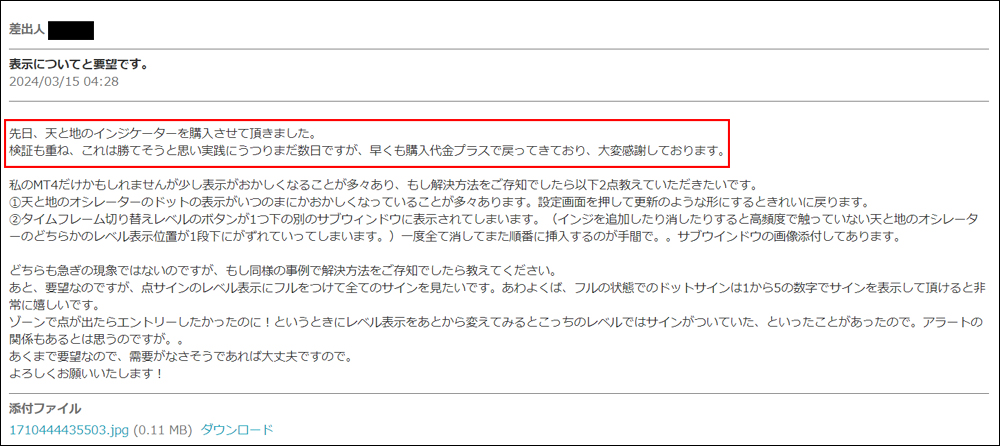
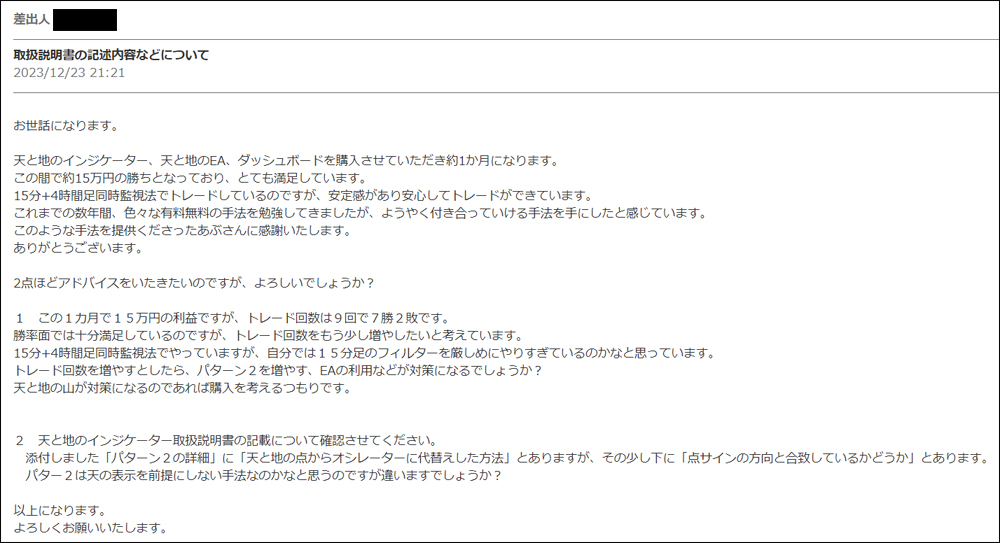
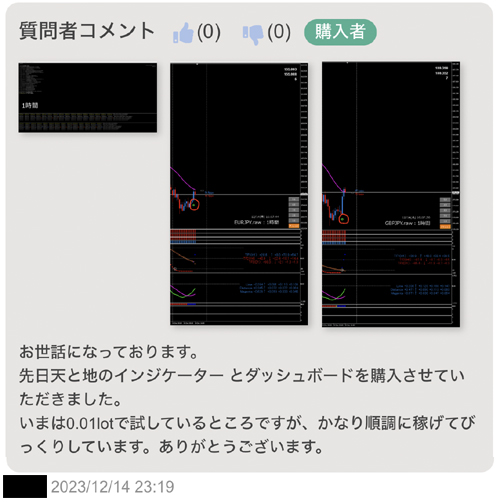
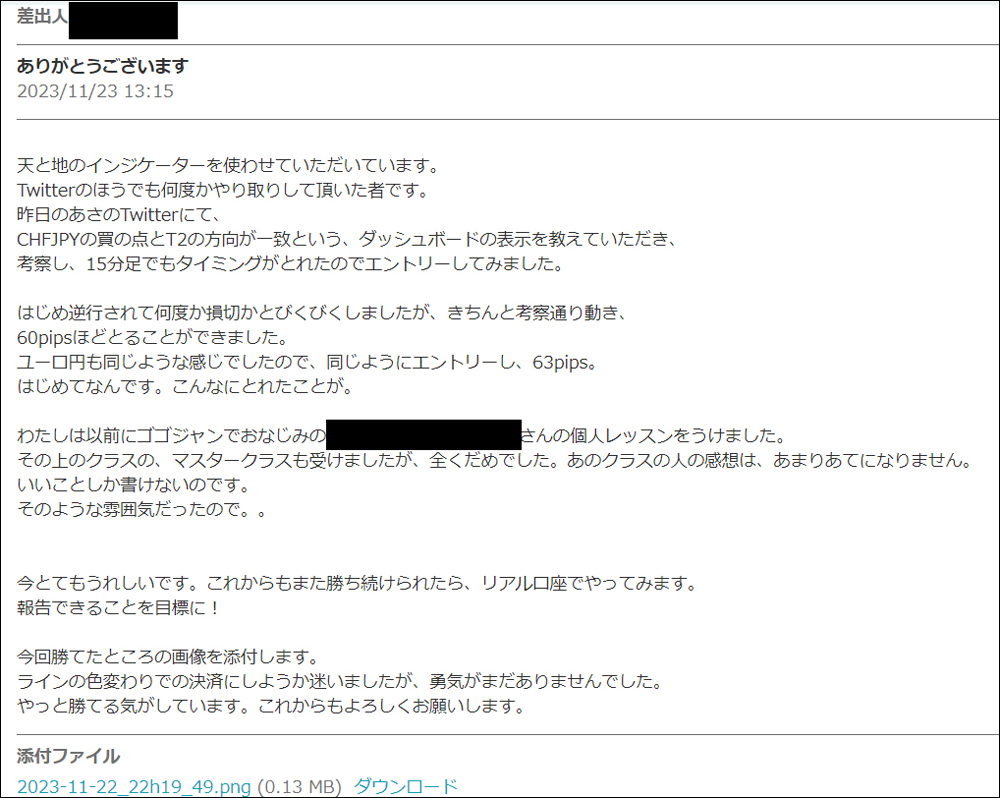
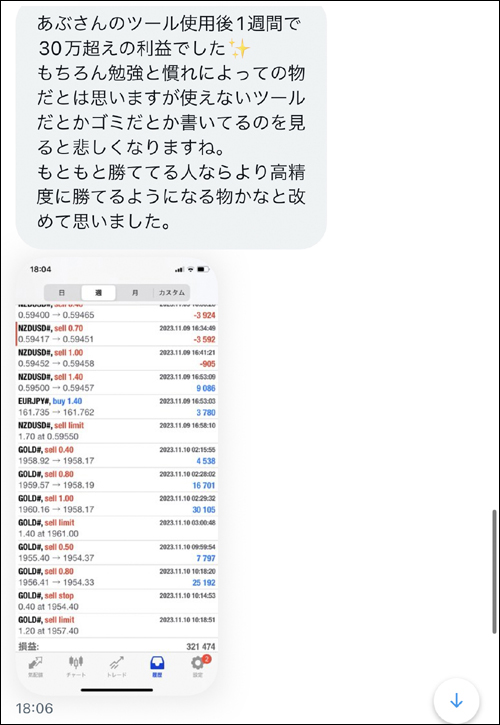
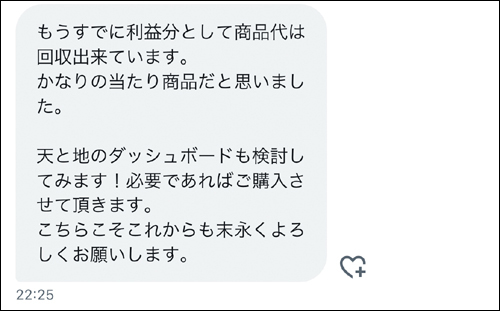
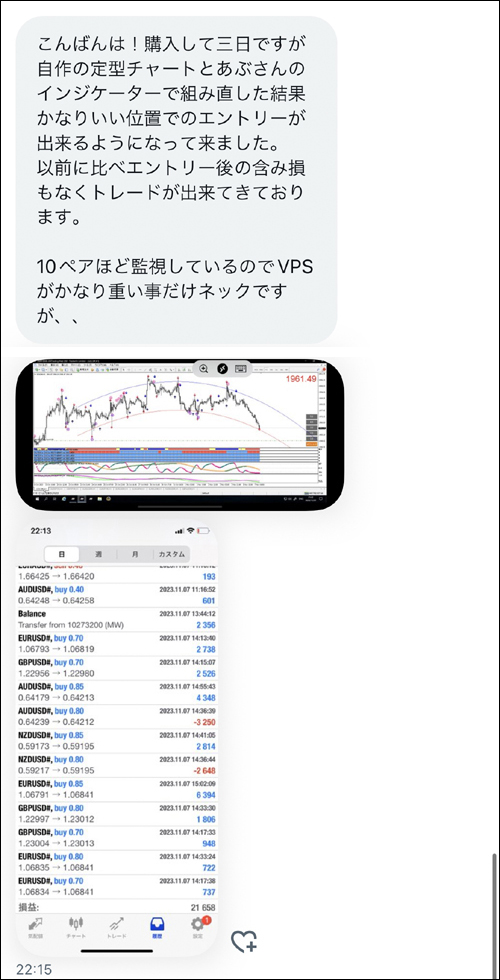
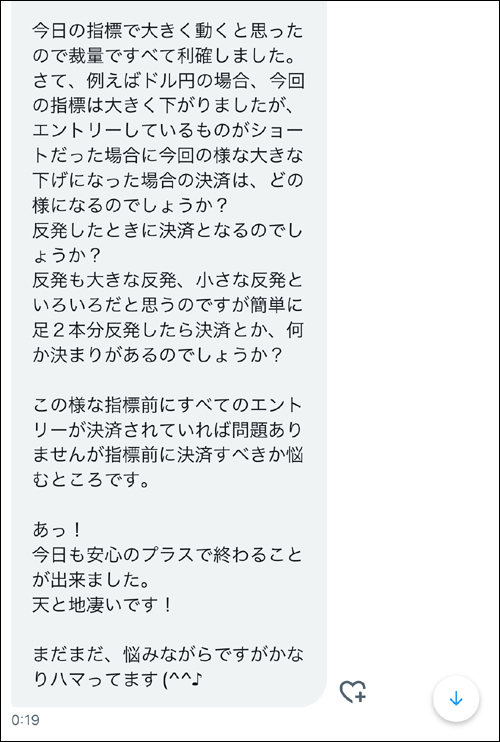
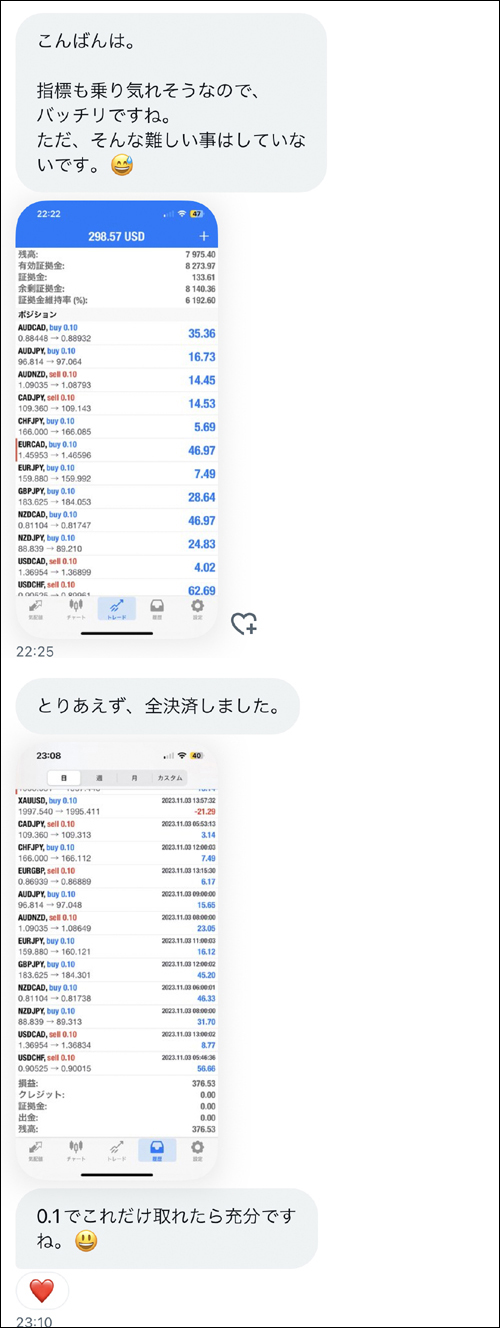
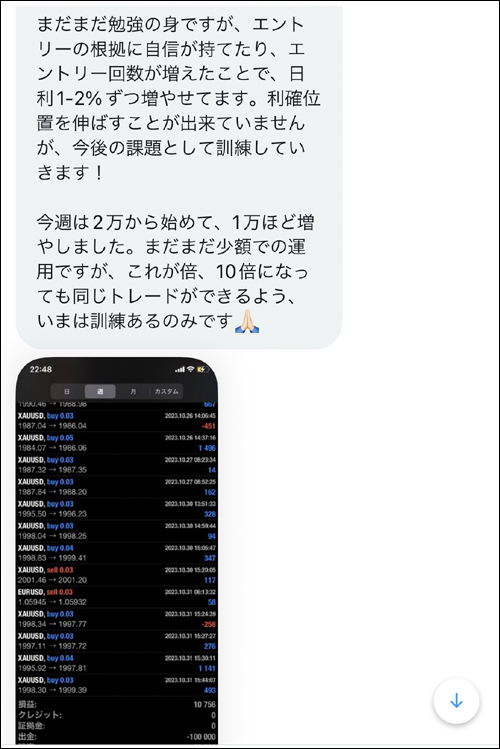
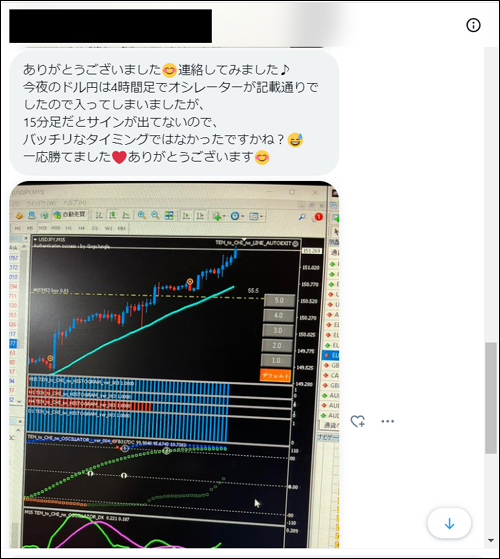
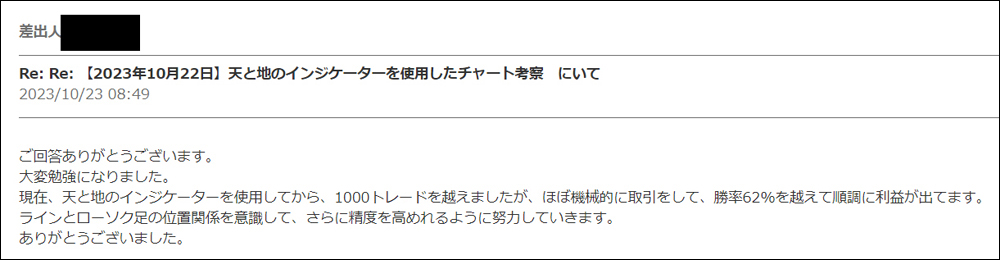
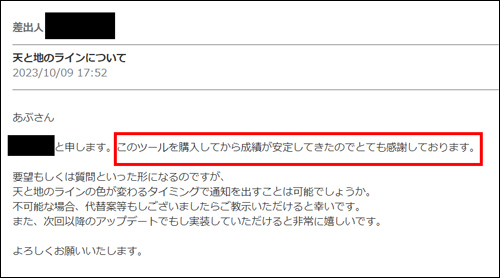
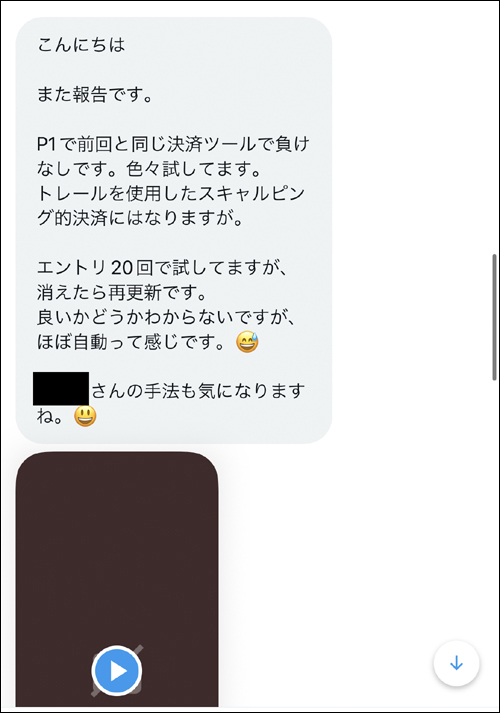
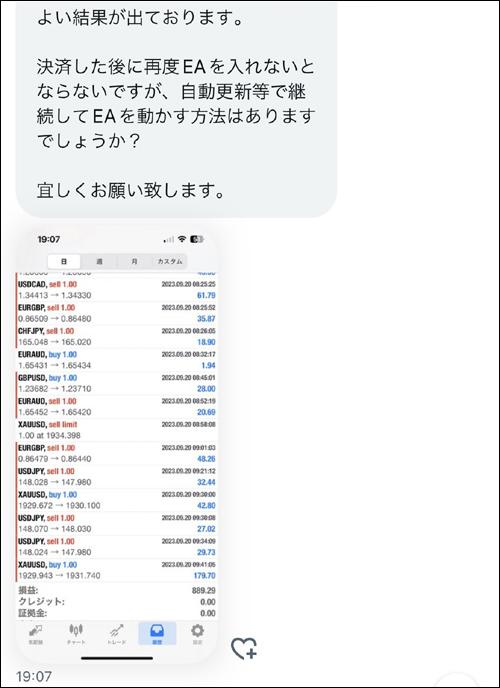
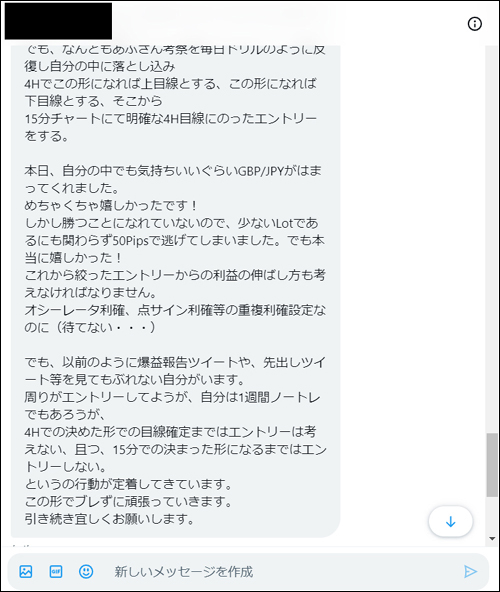
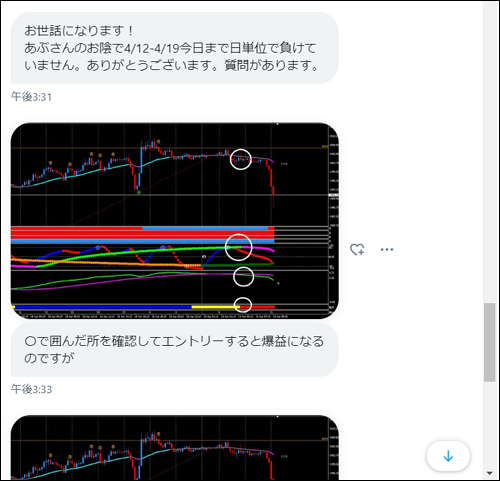
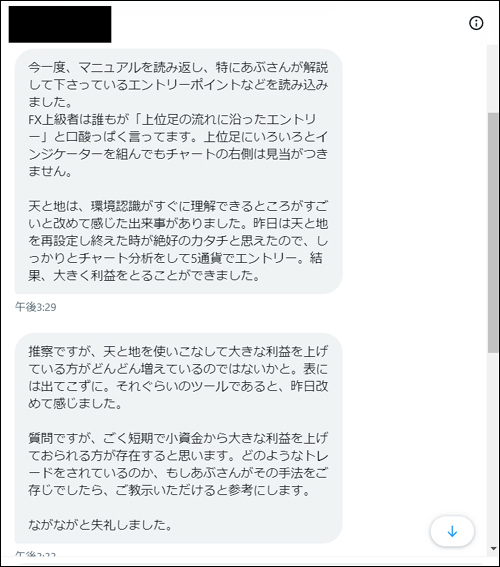
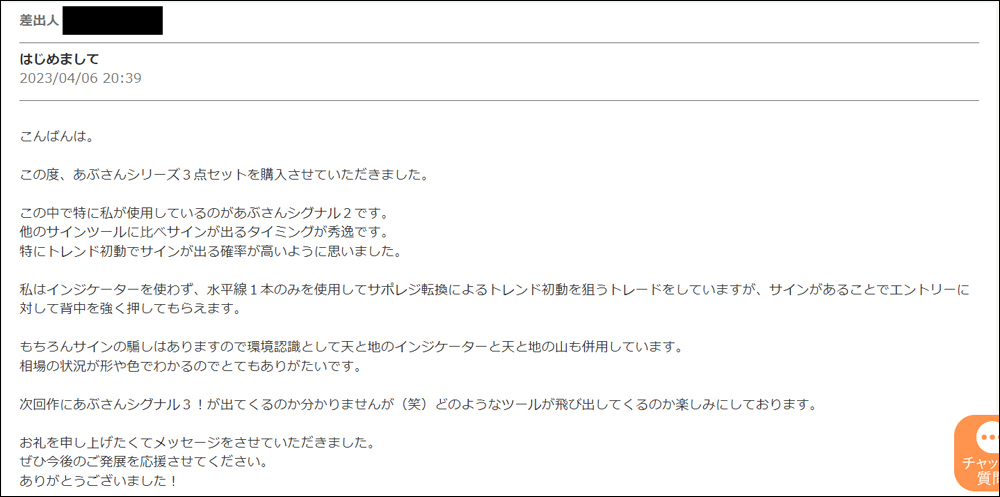
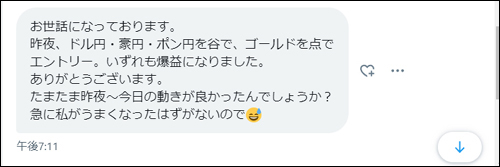
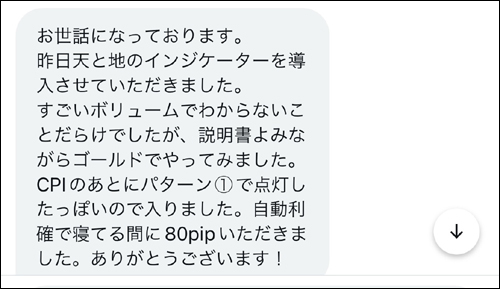
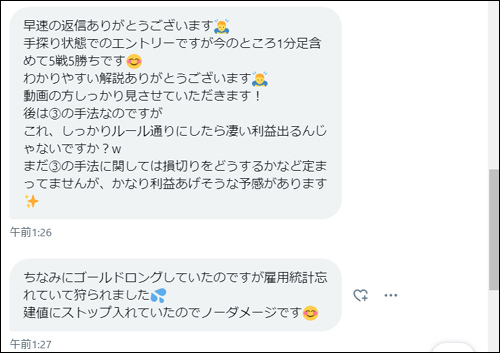
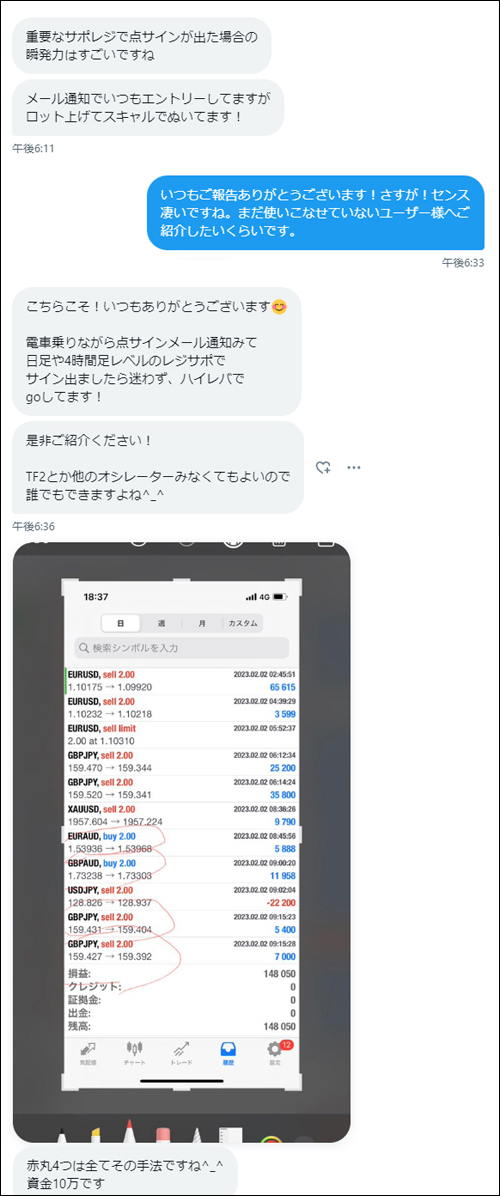
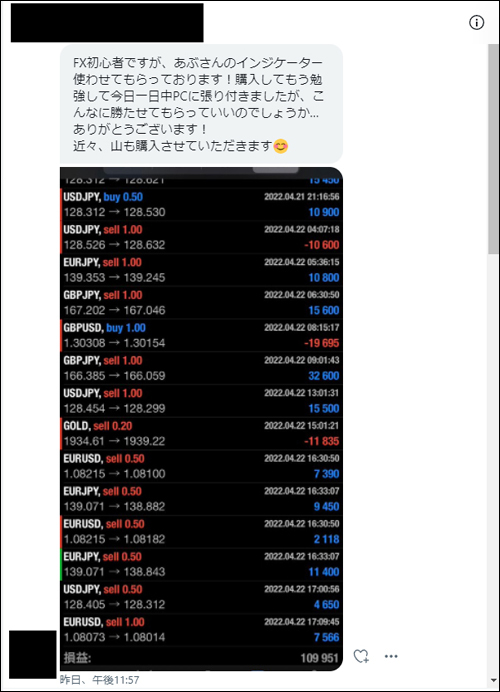
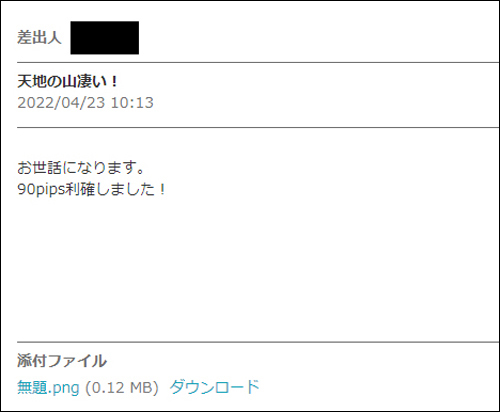
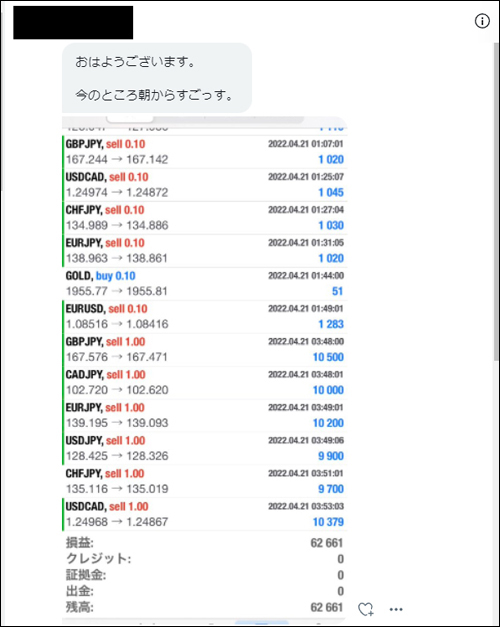
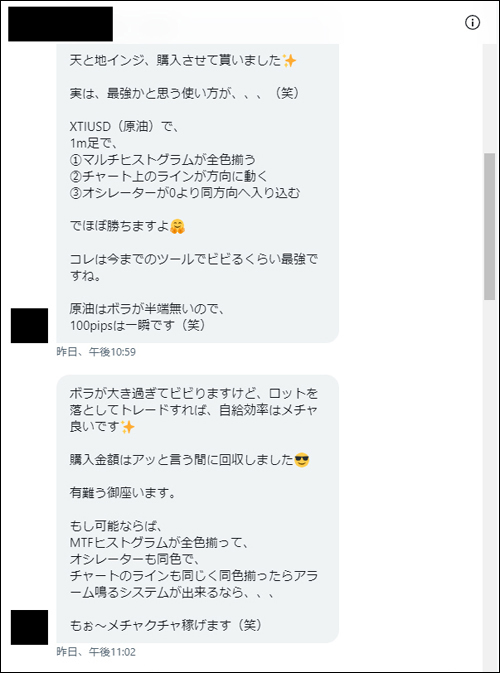
・Impressions (review version) from users who actually used the Heaven and Earth indicator
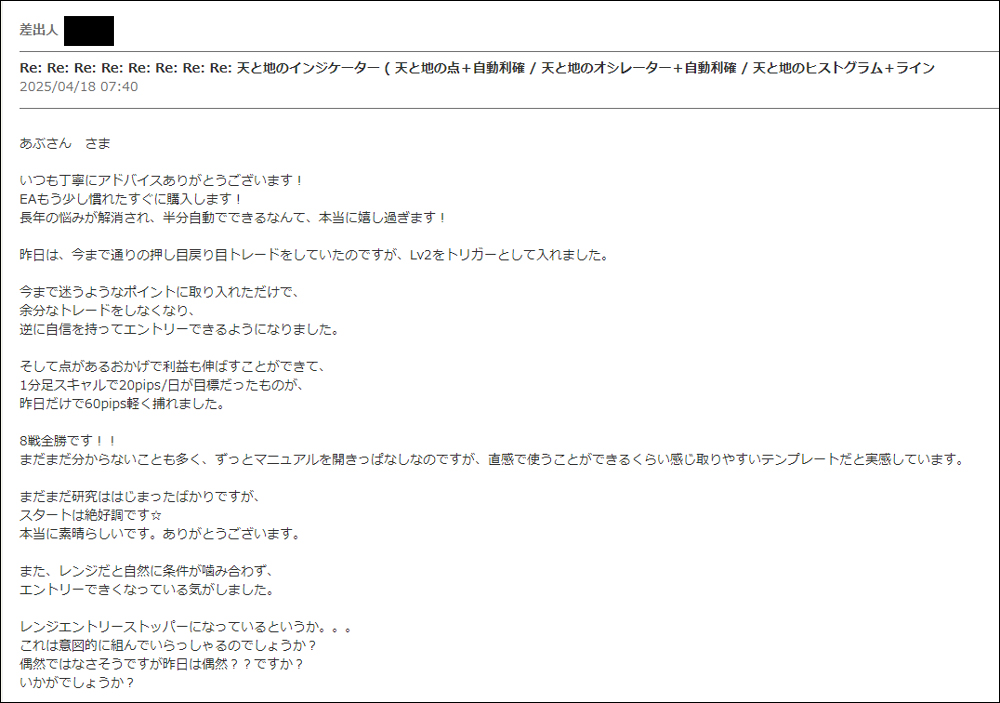
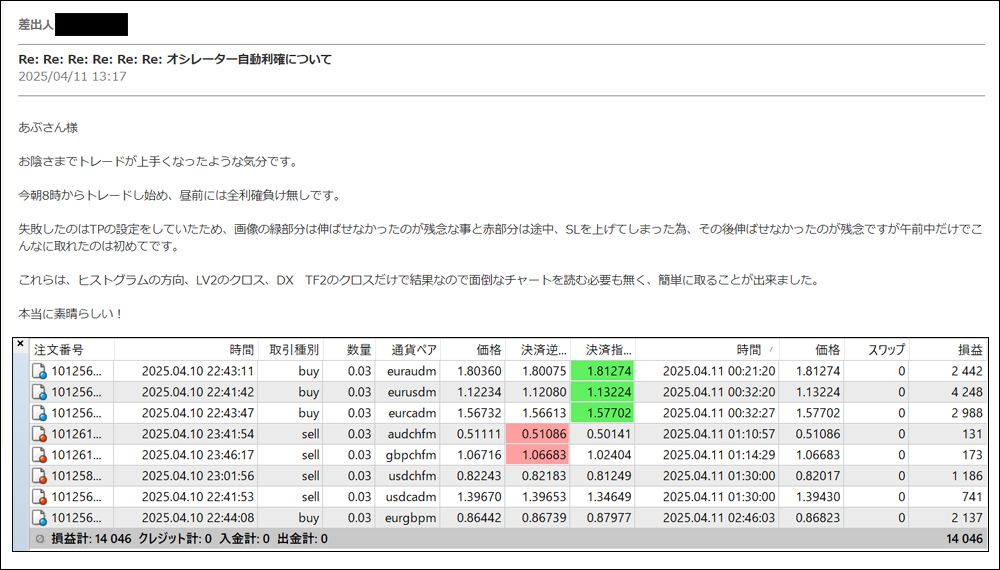
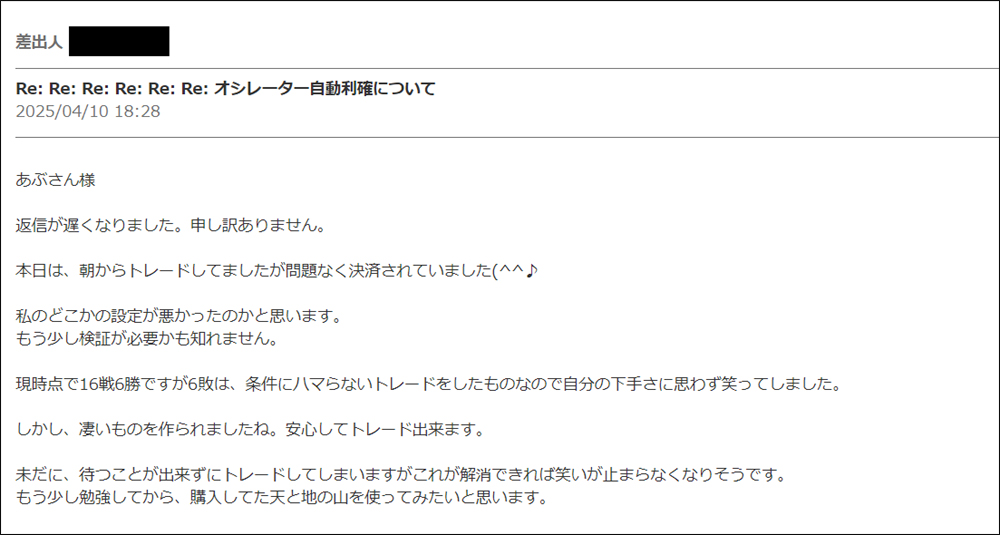
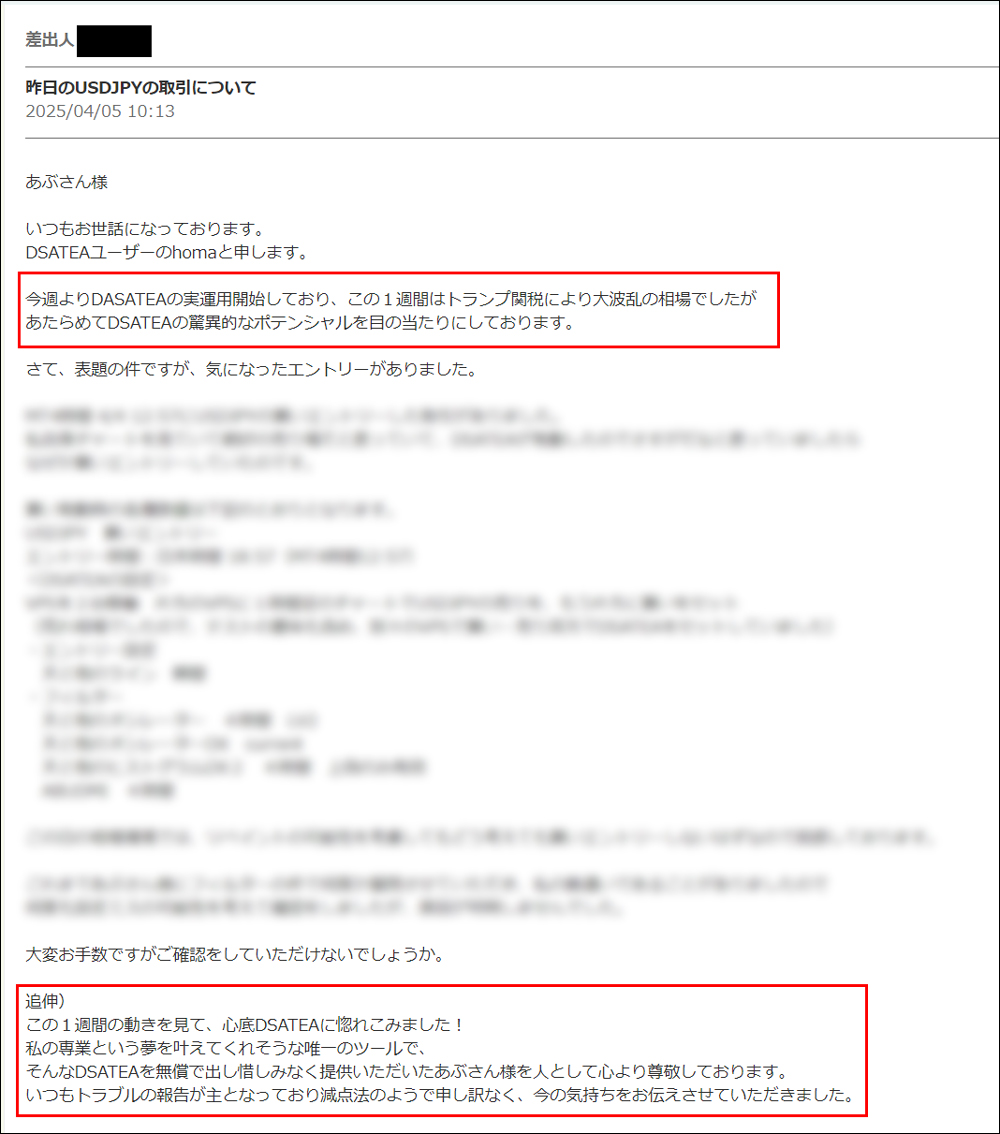
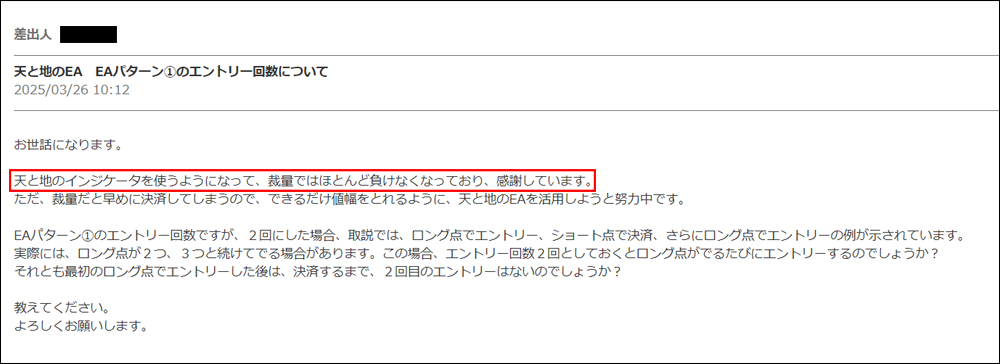
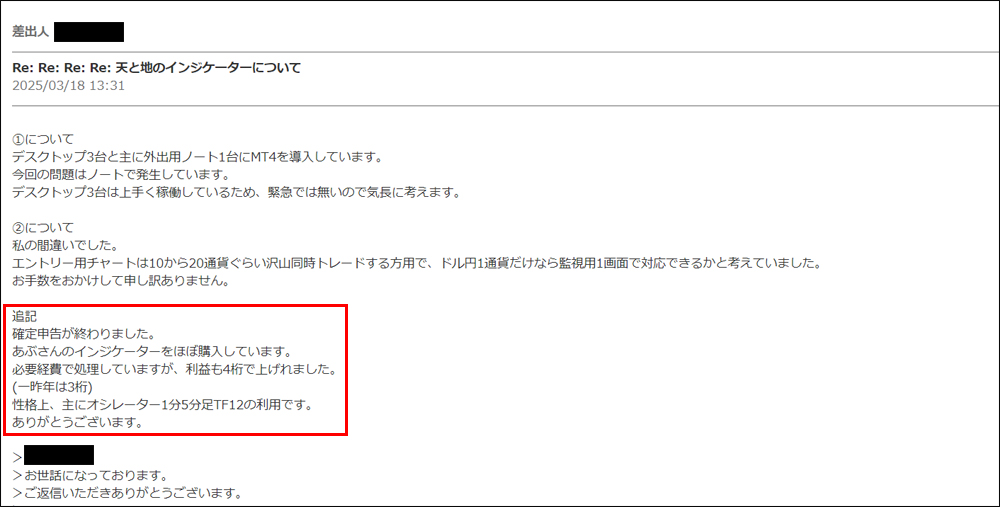
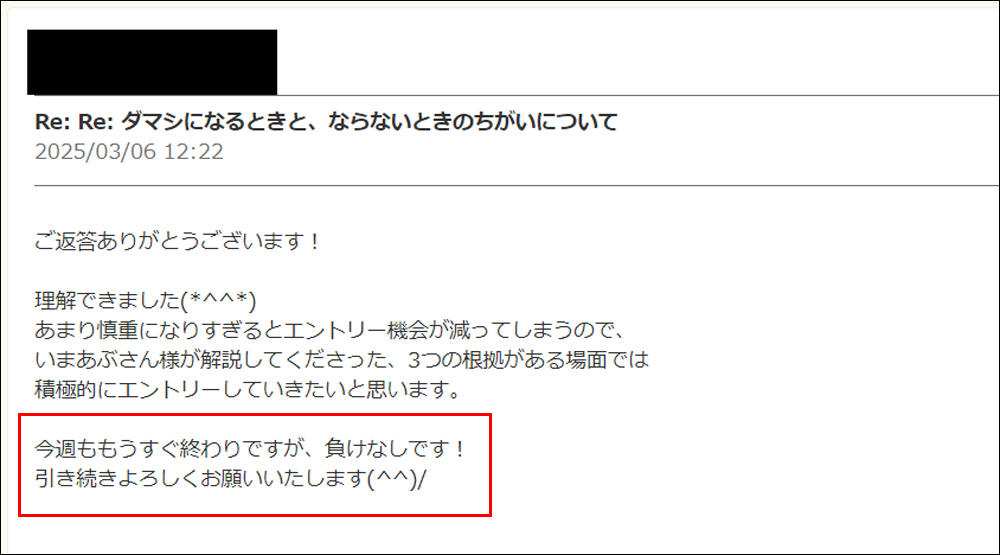
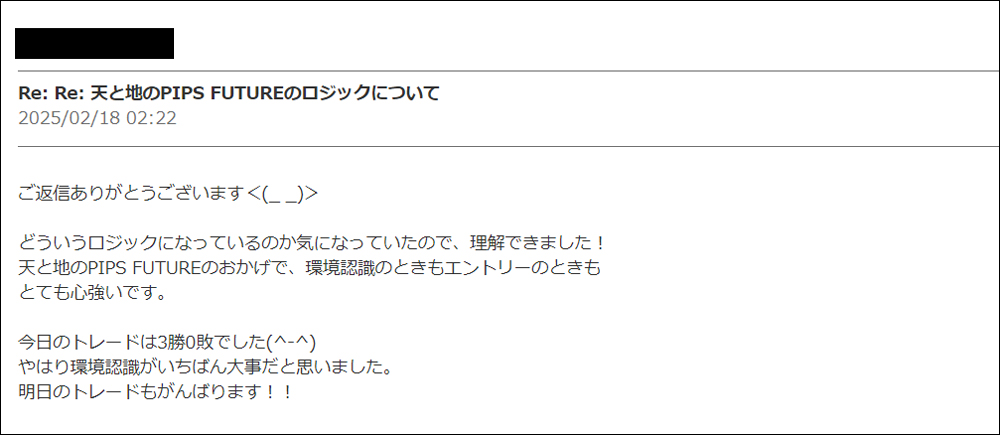
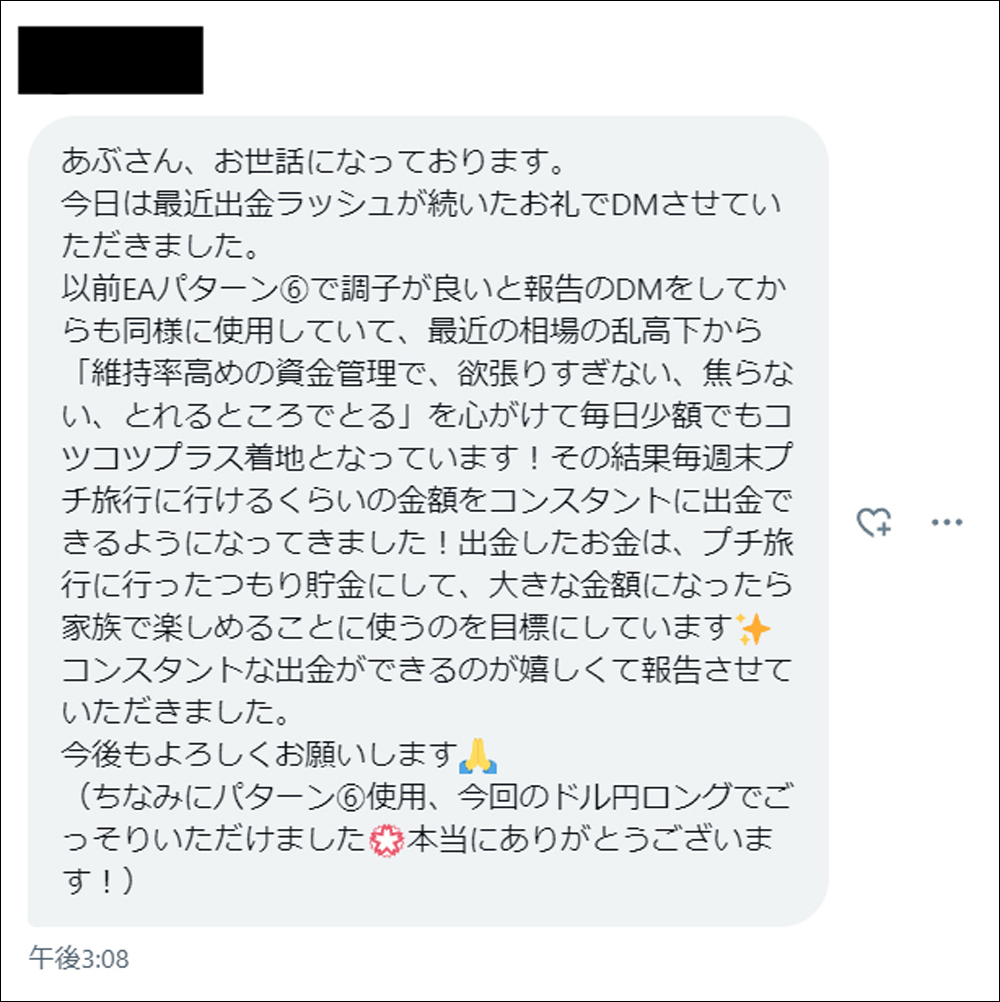
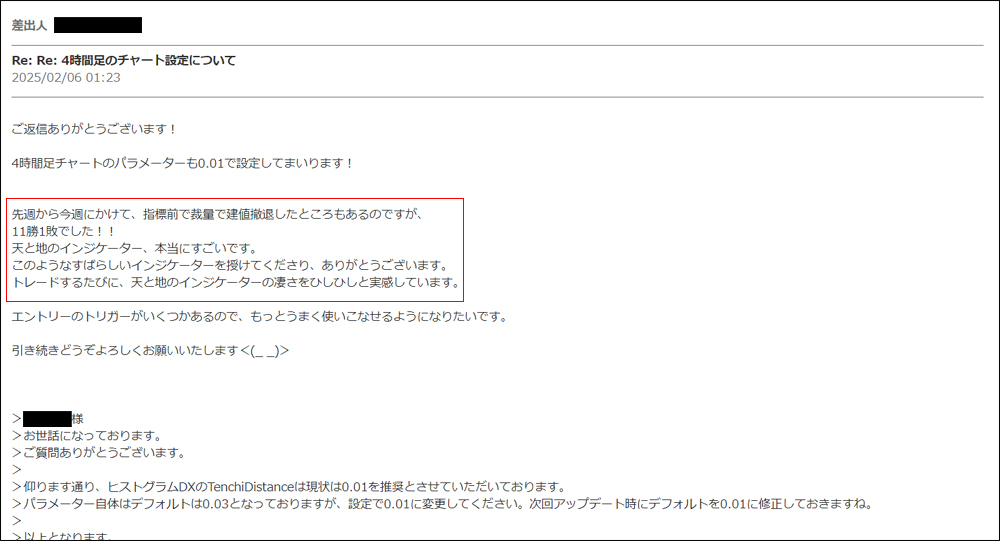
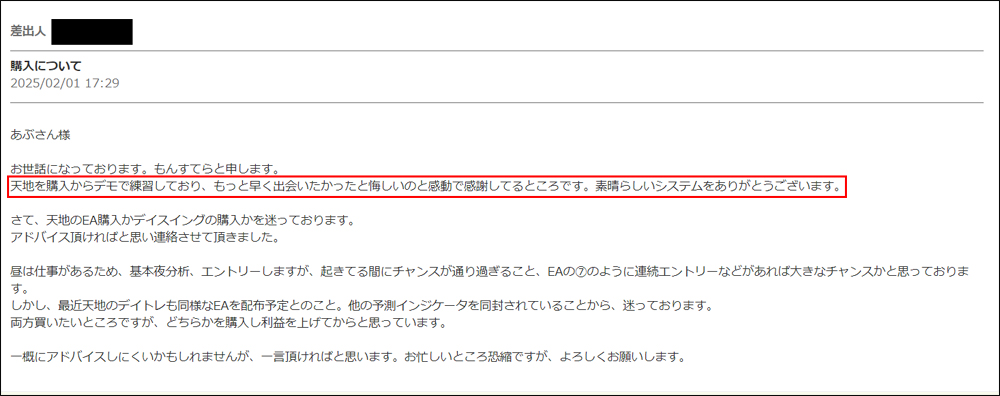
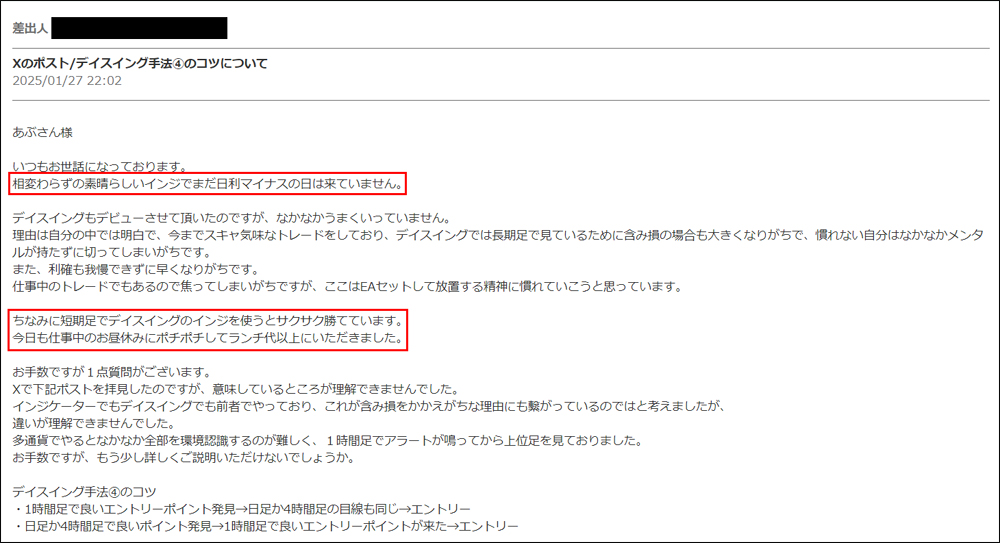
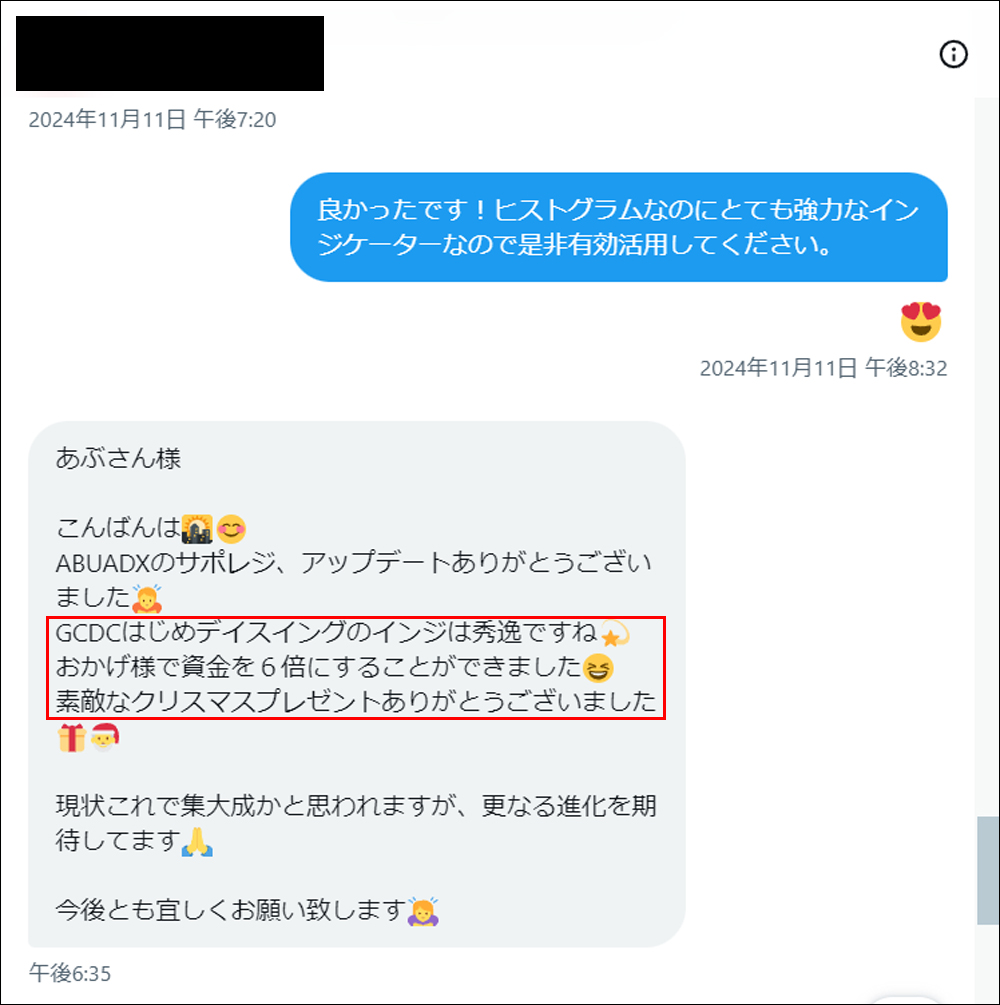
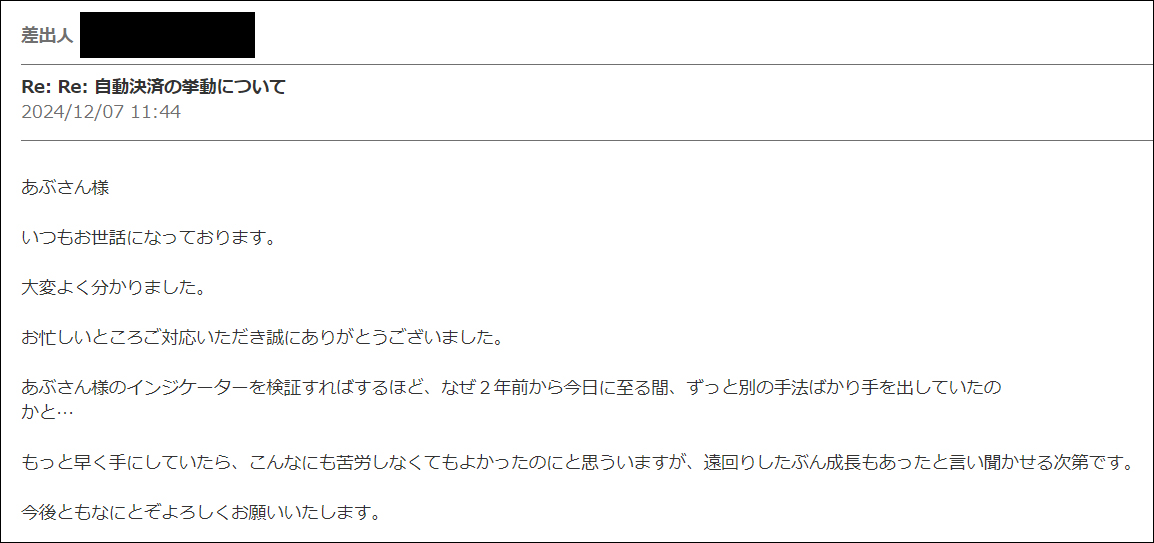
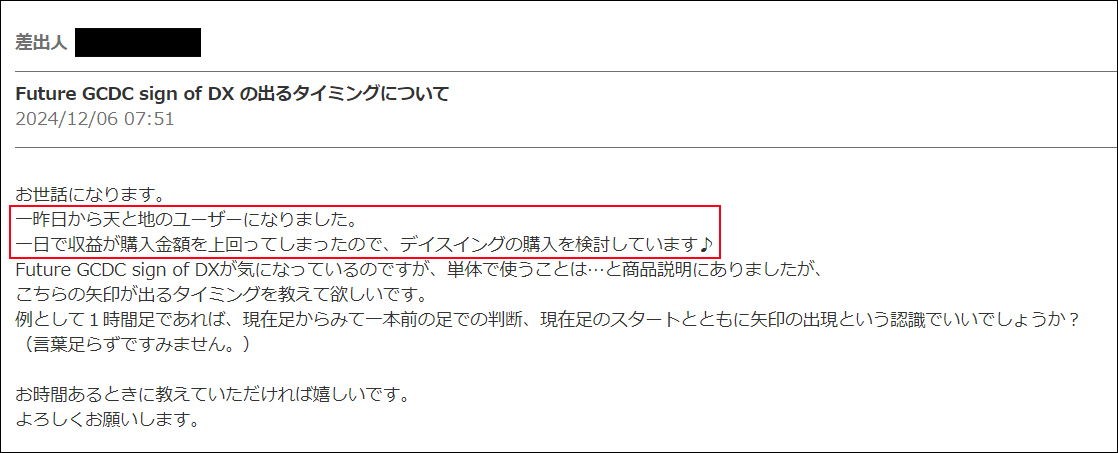
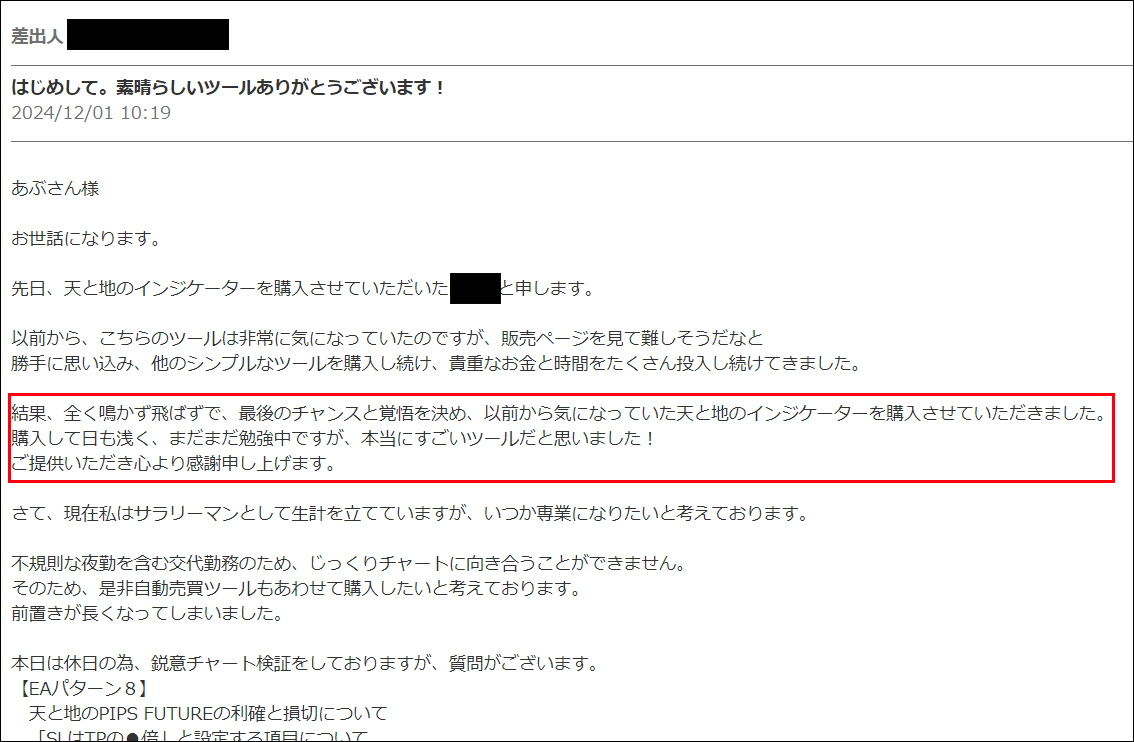
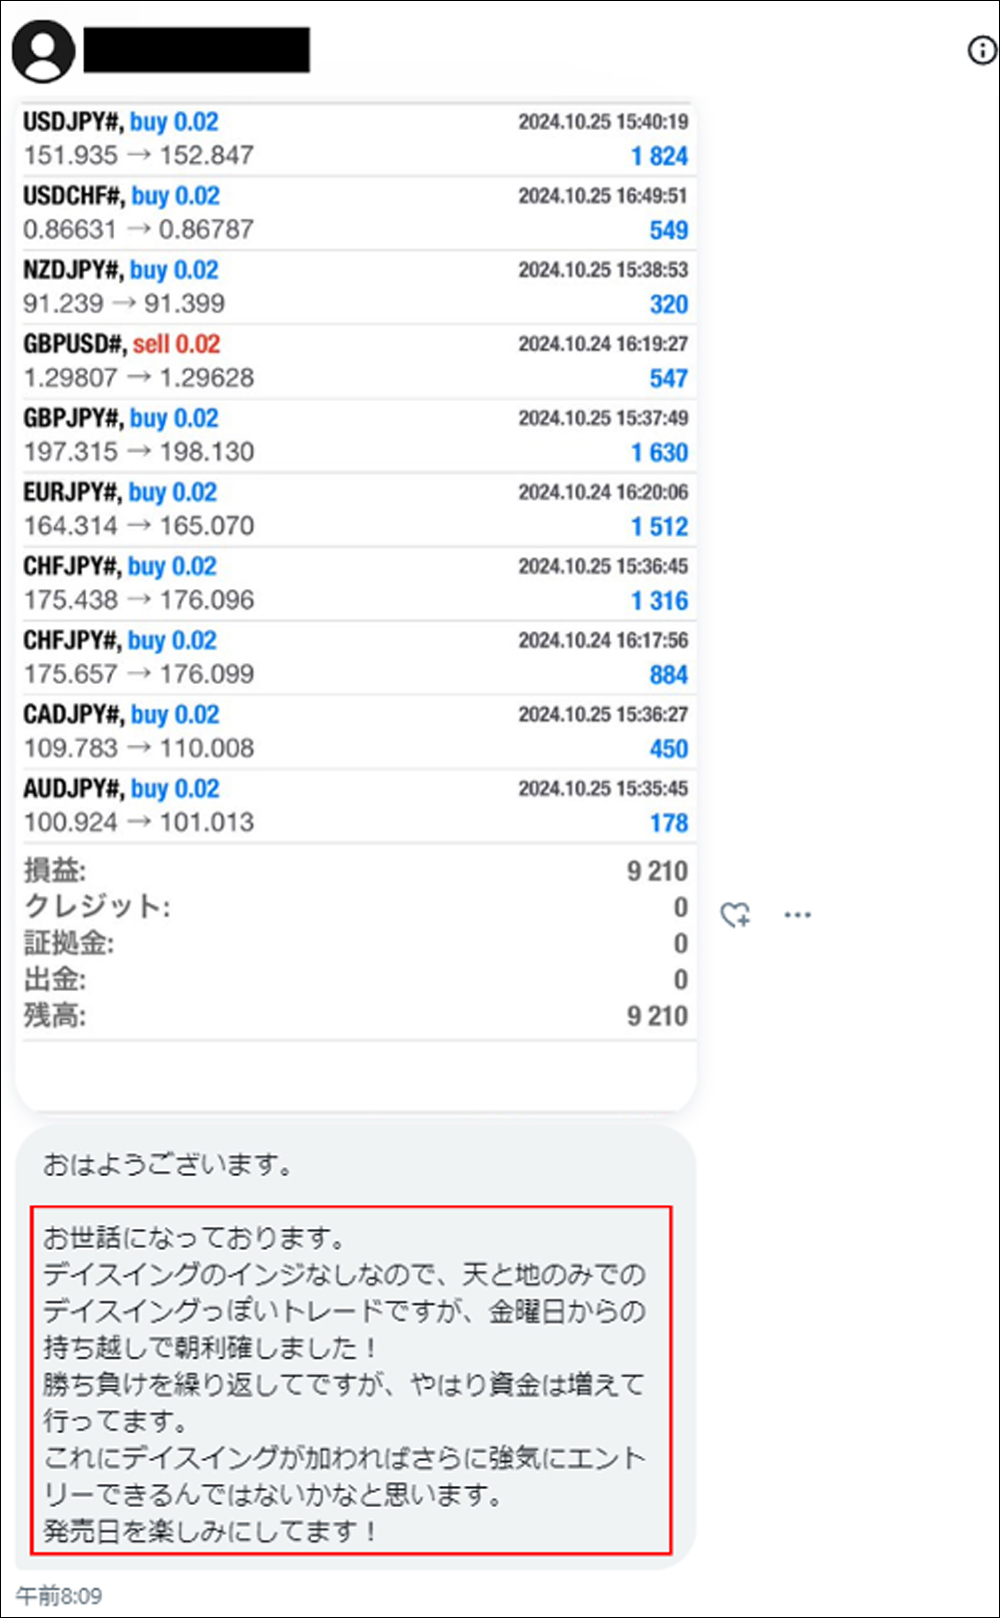
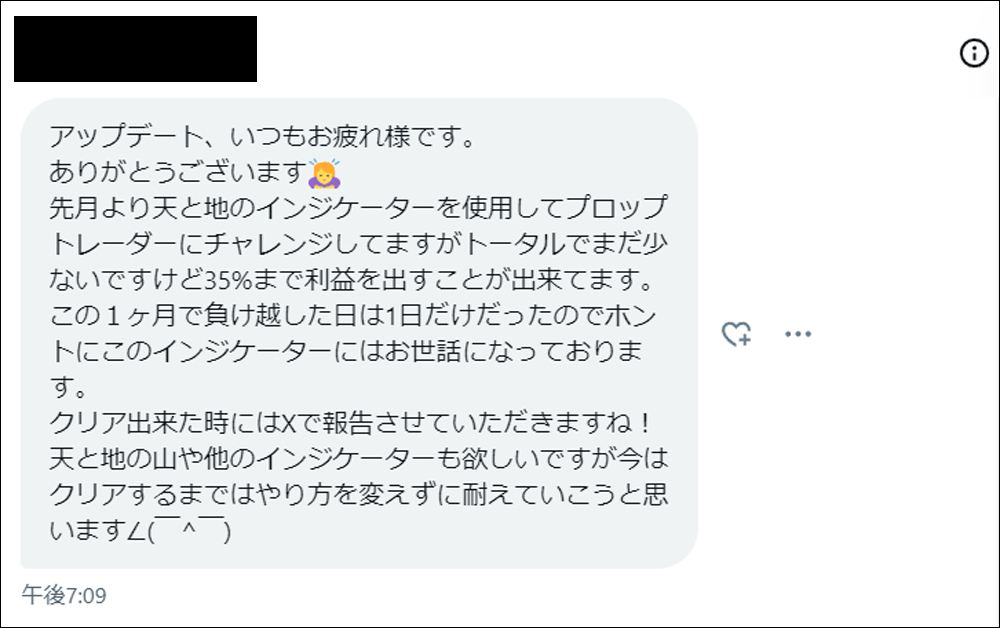
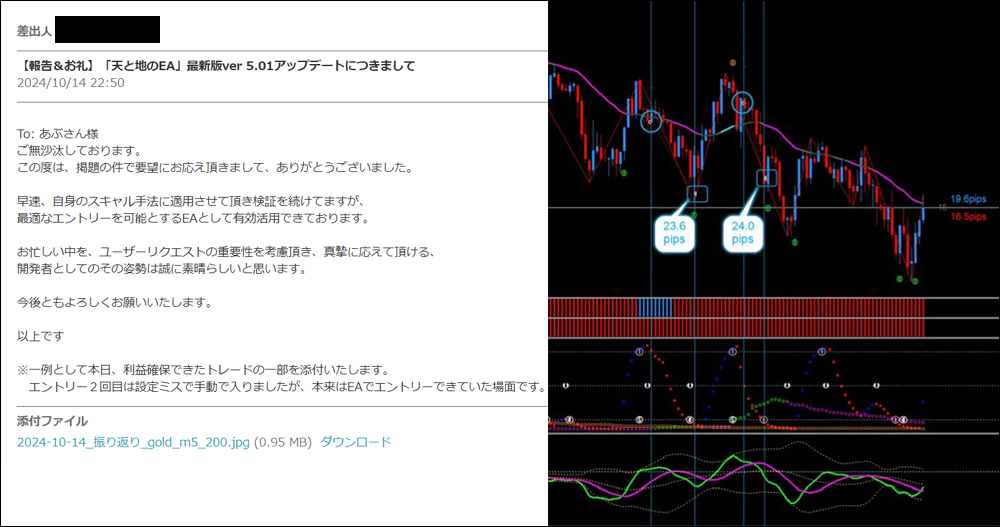
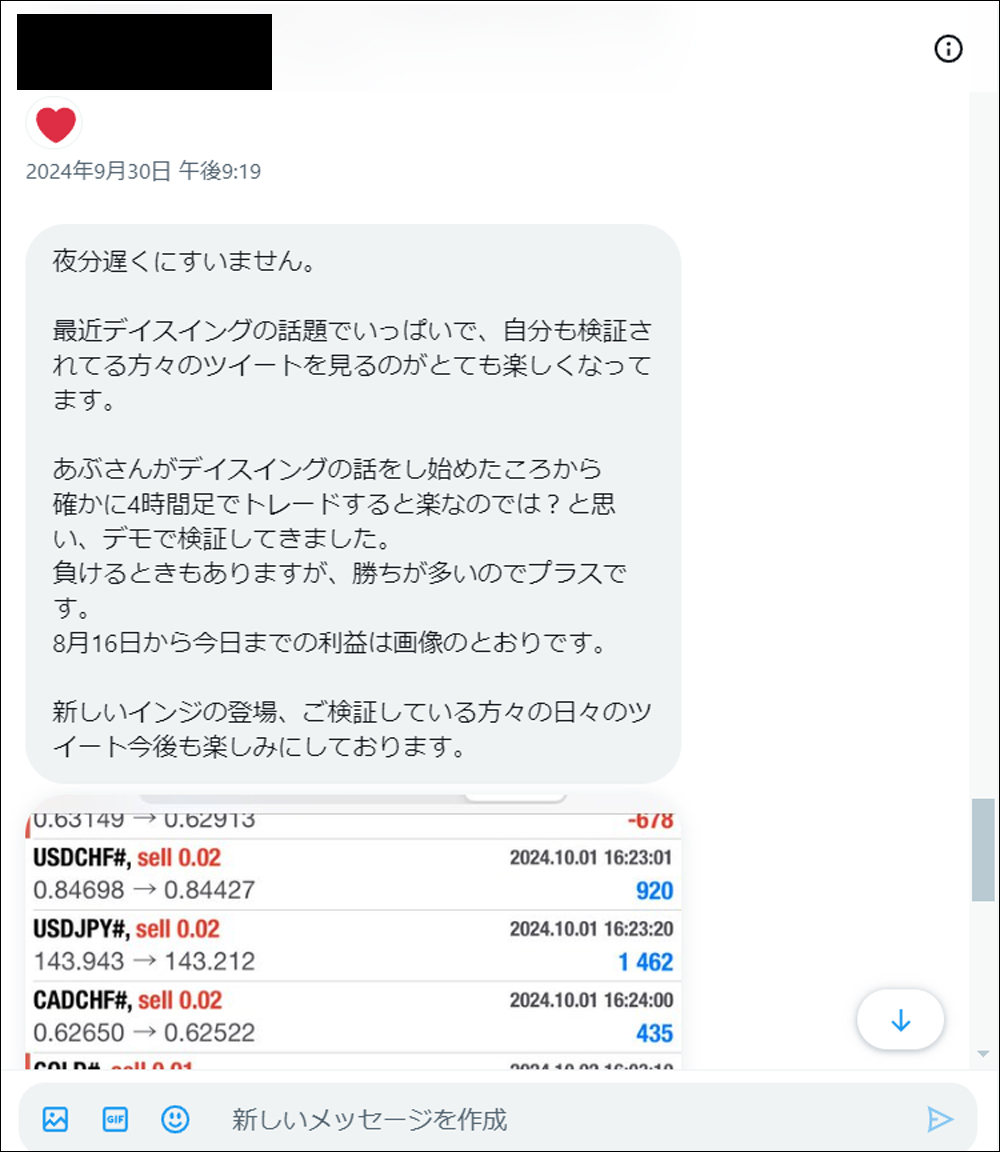
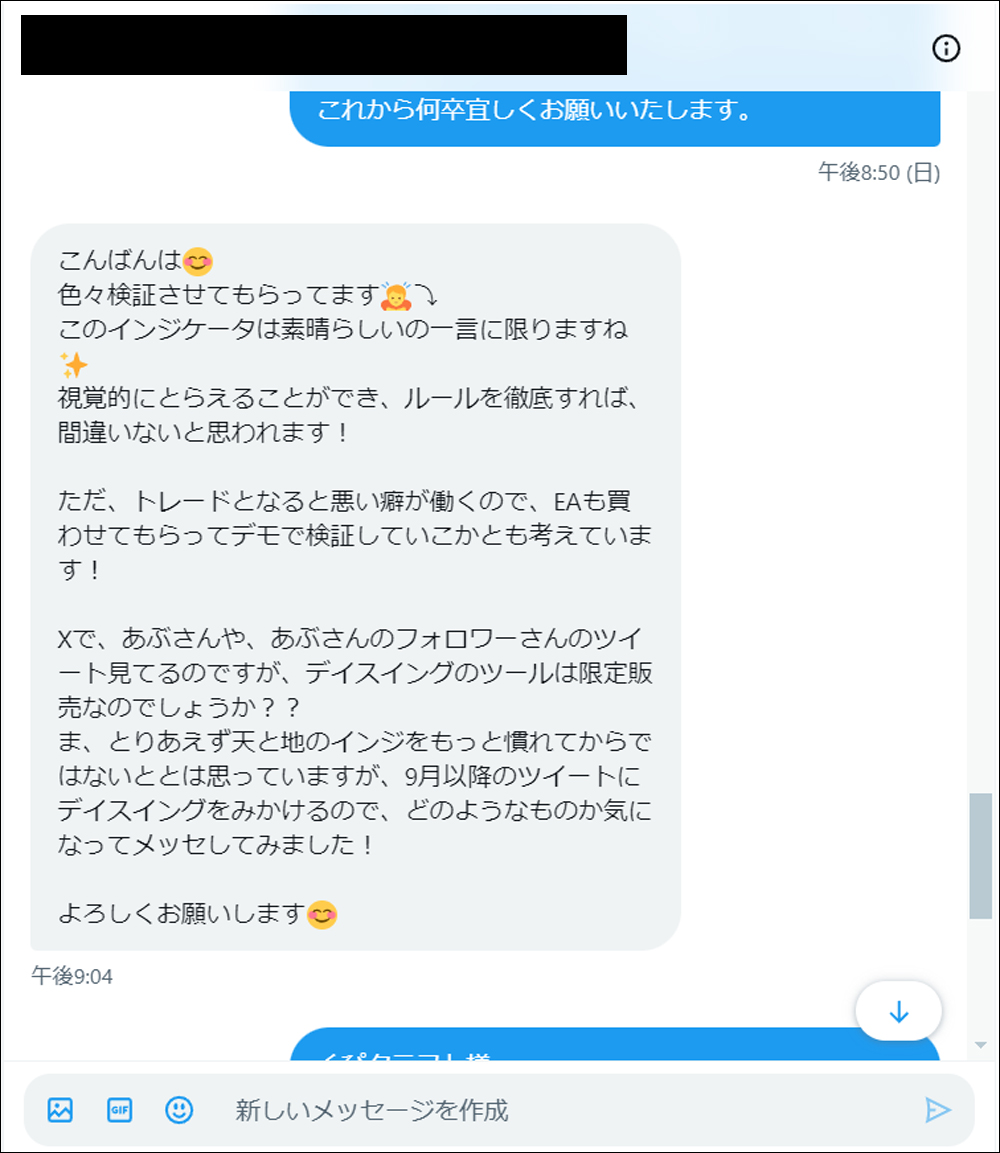
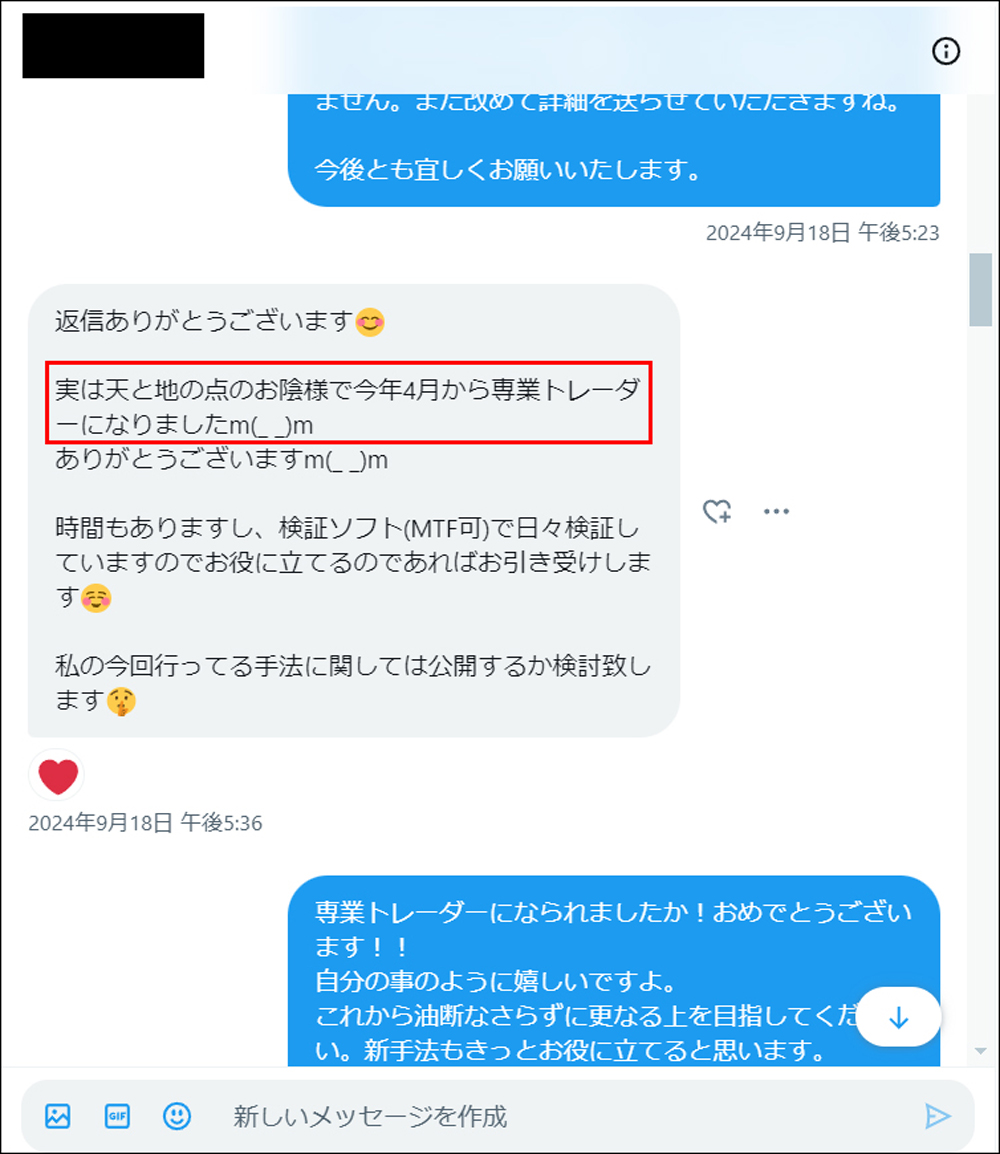
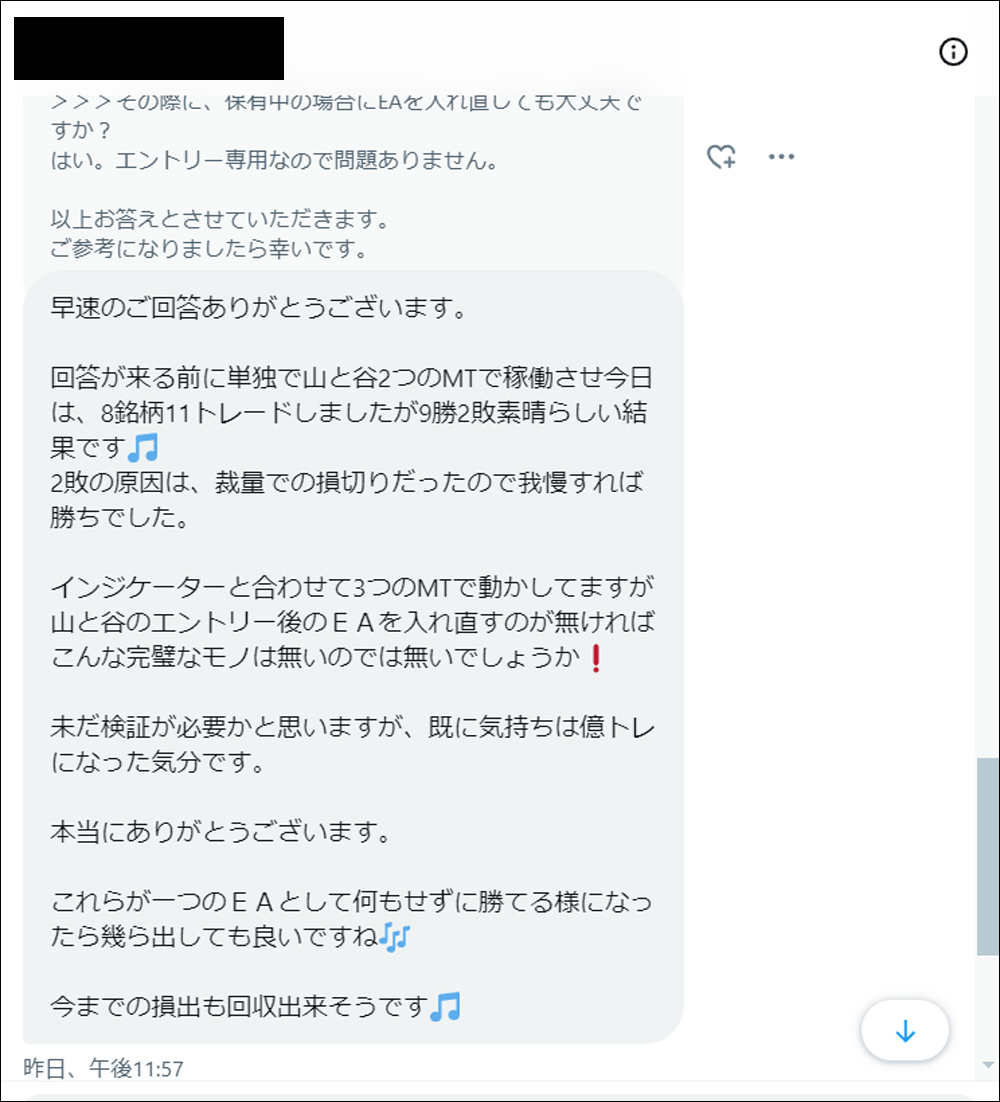
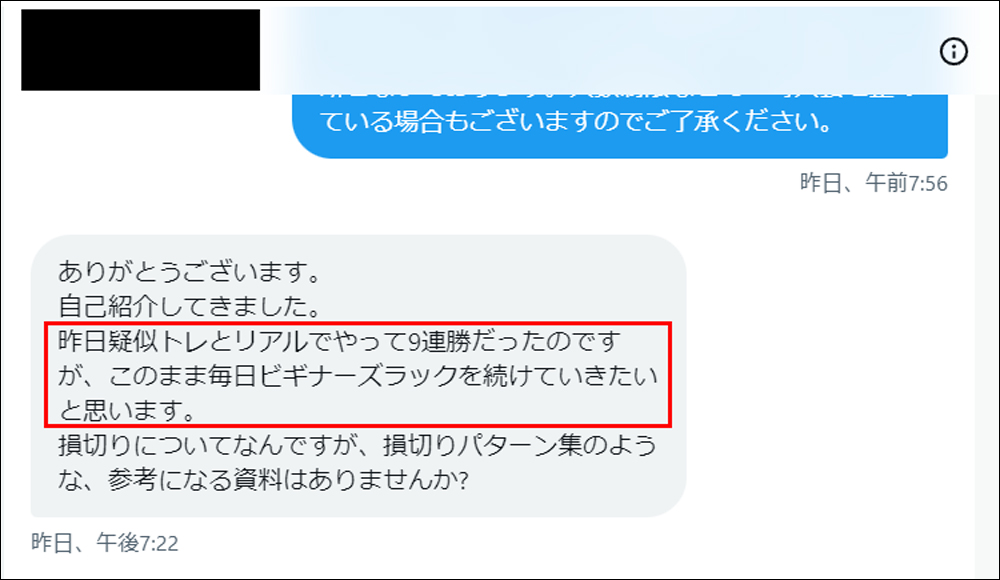
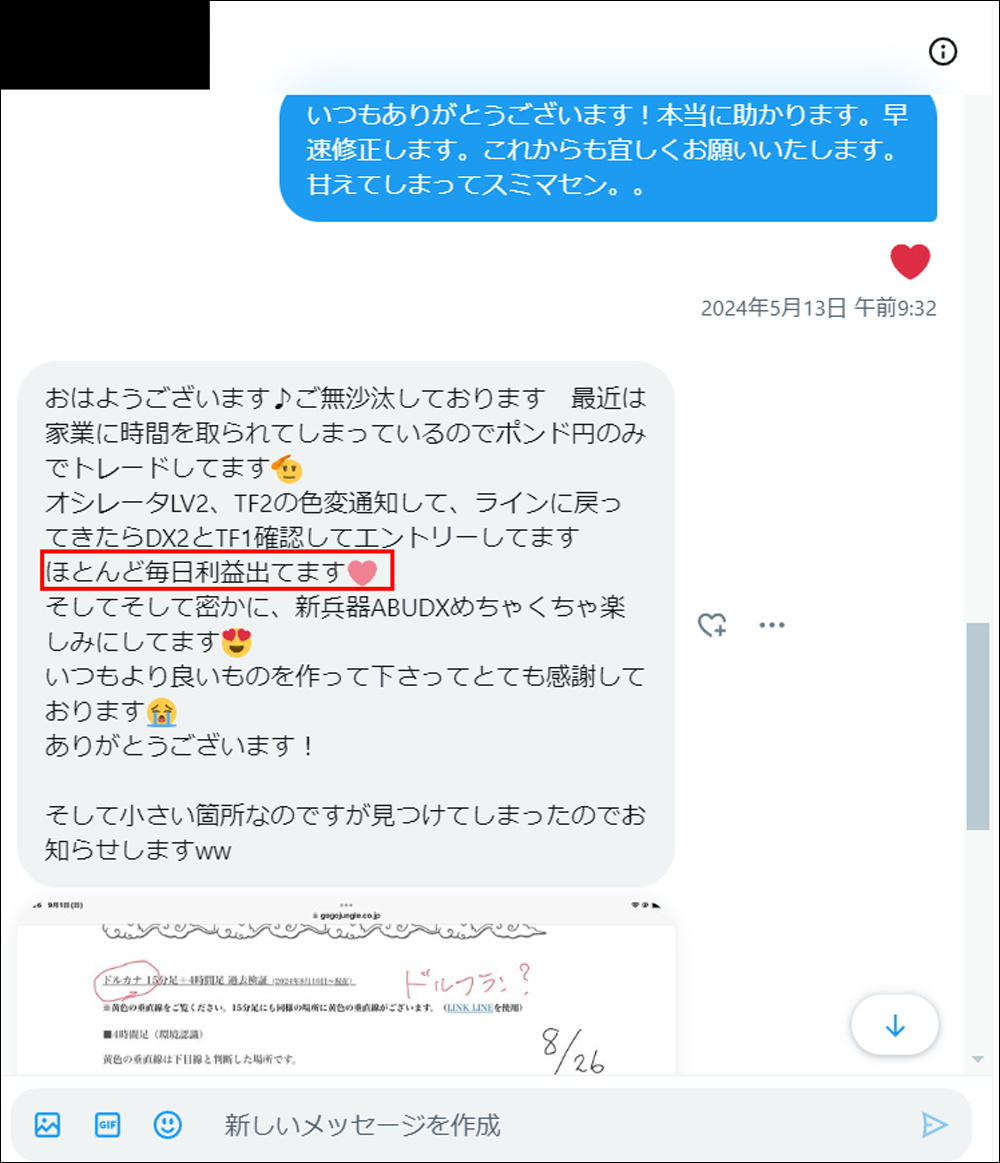
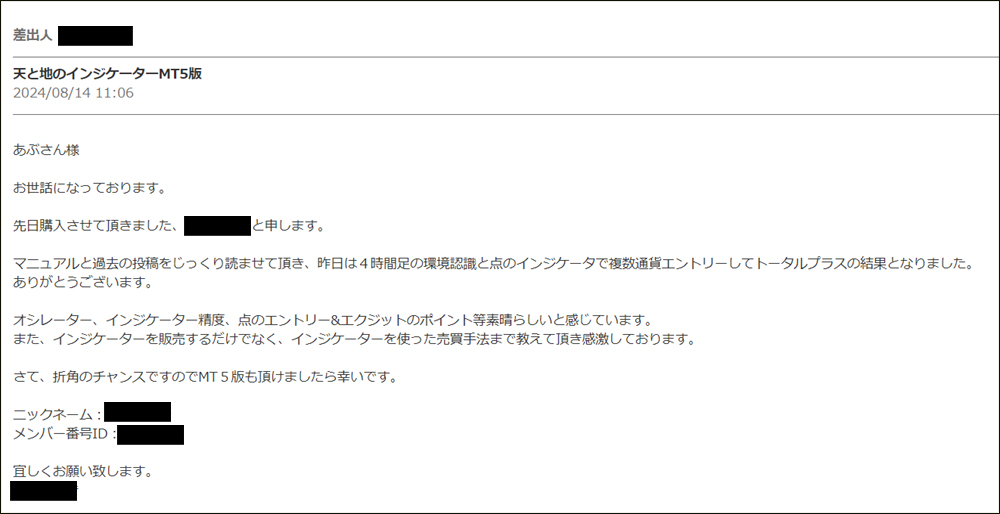
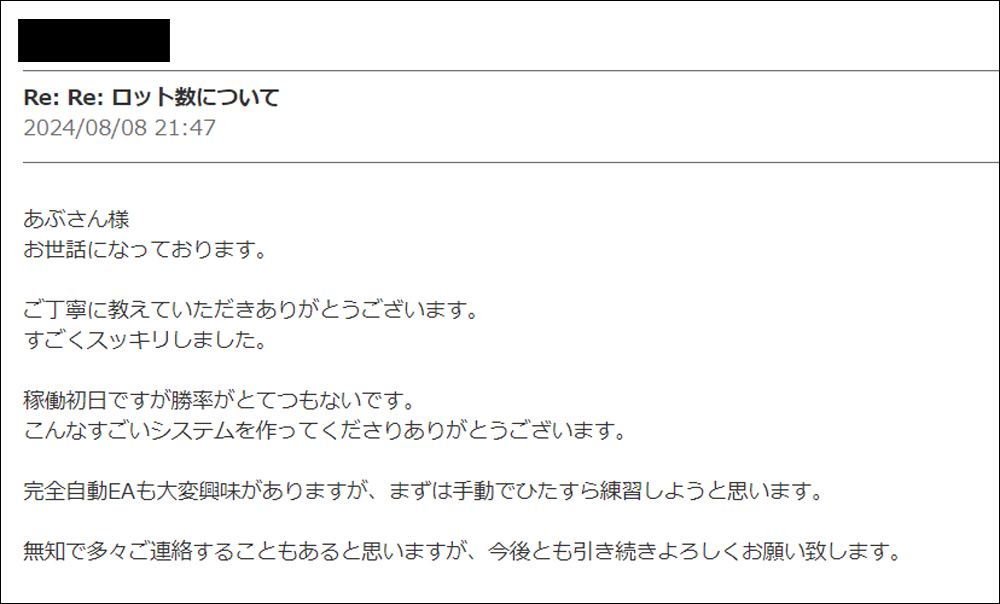
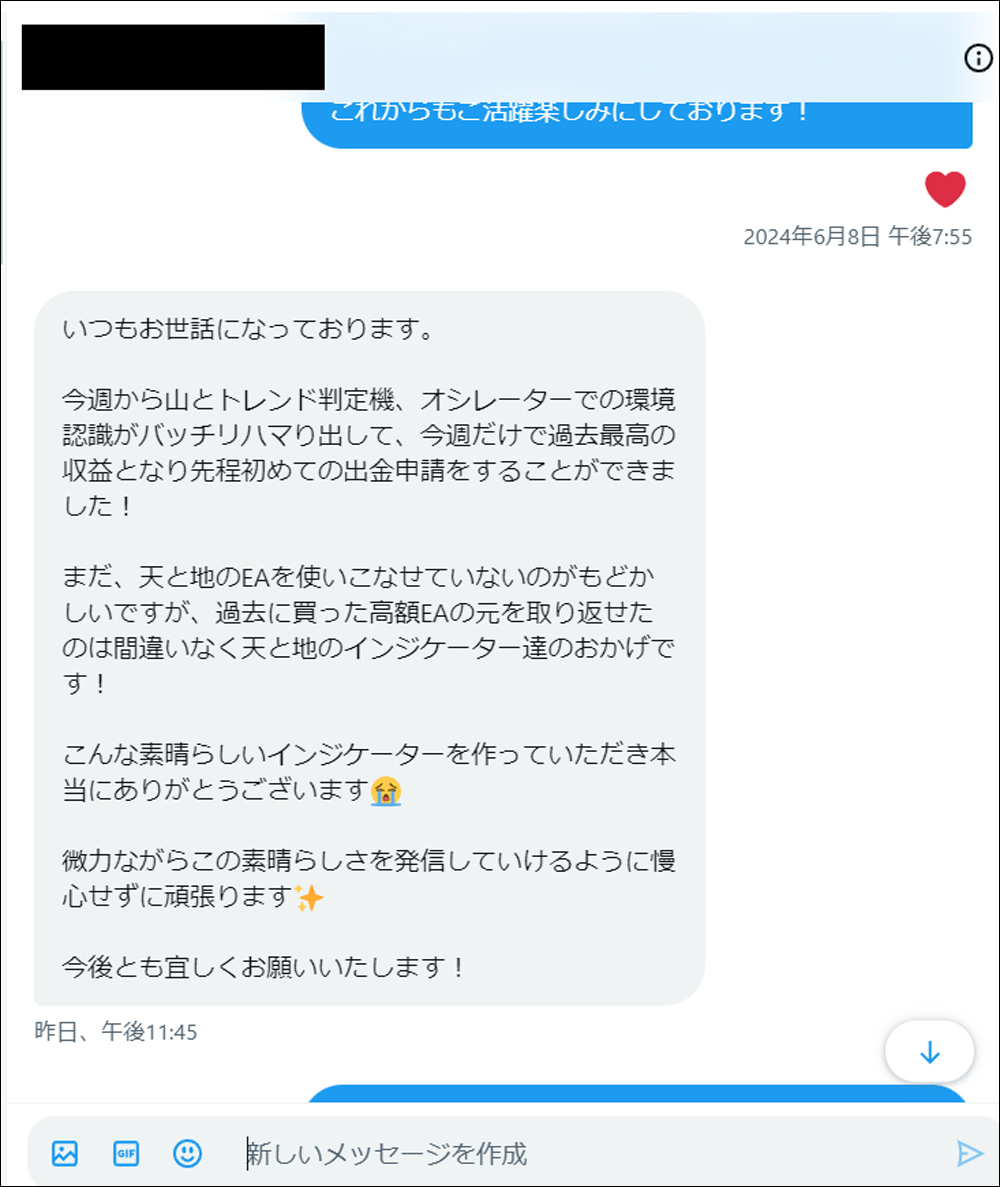
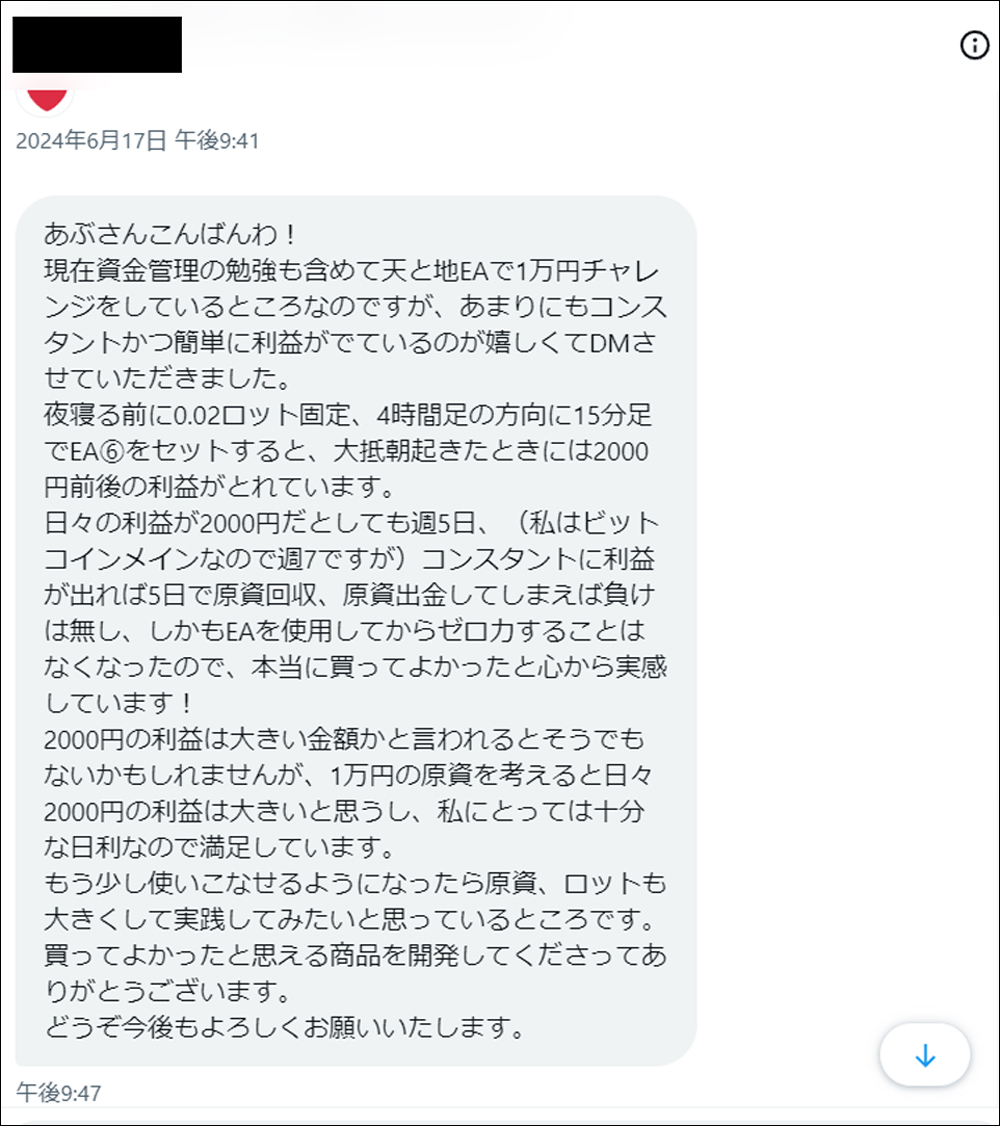
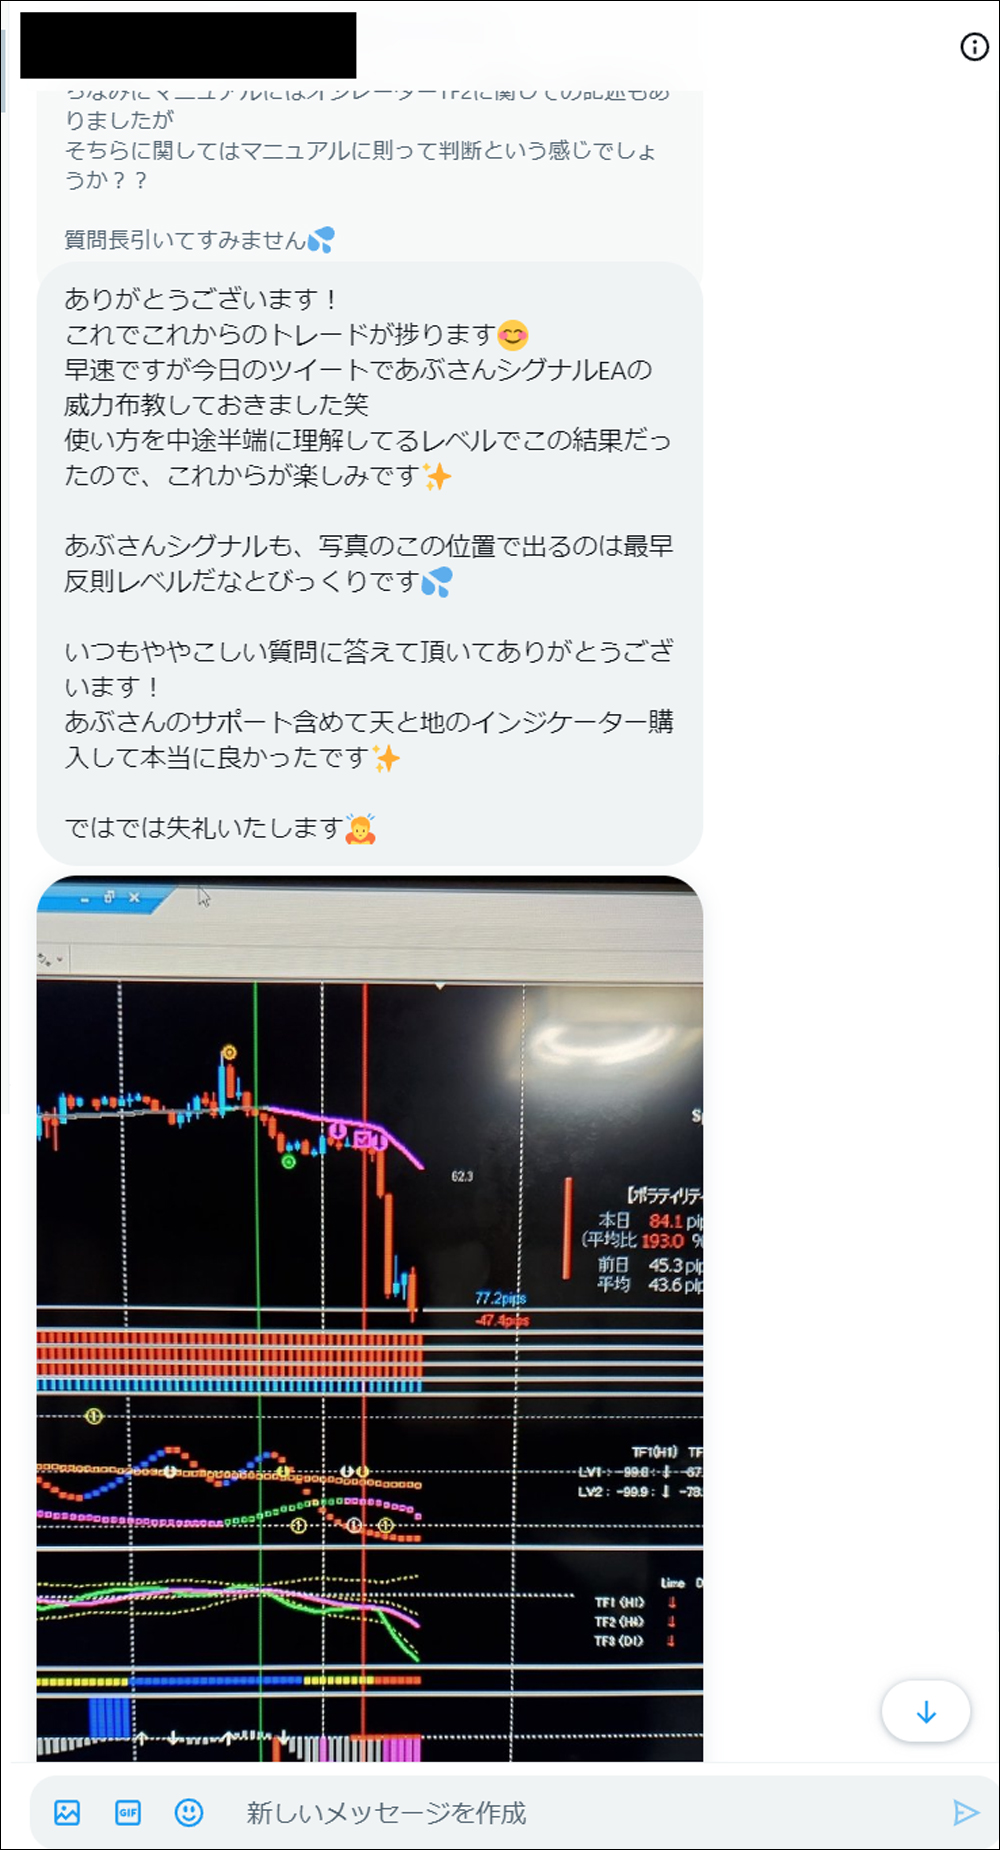
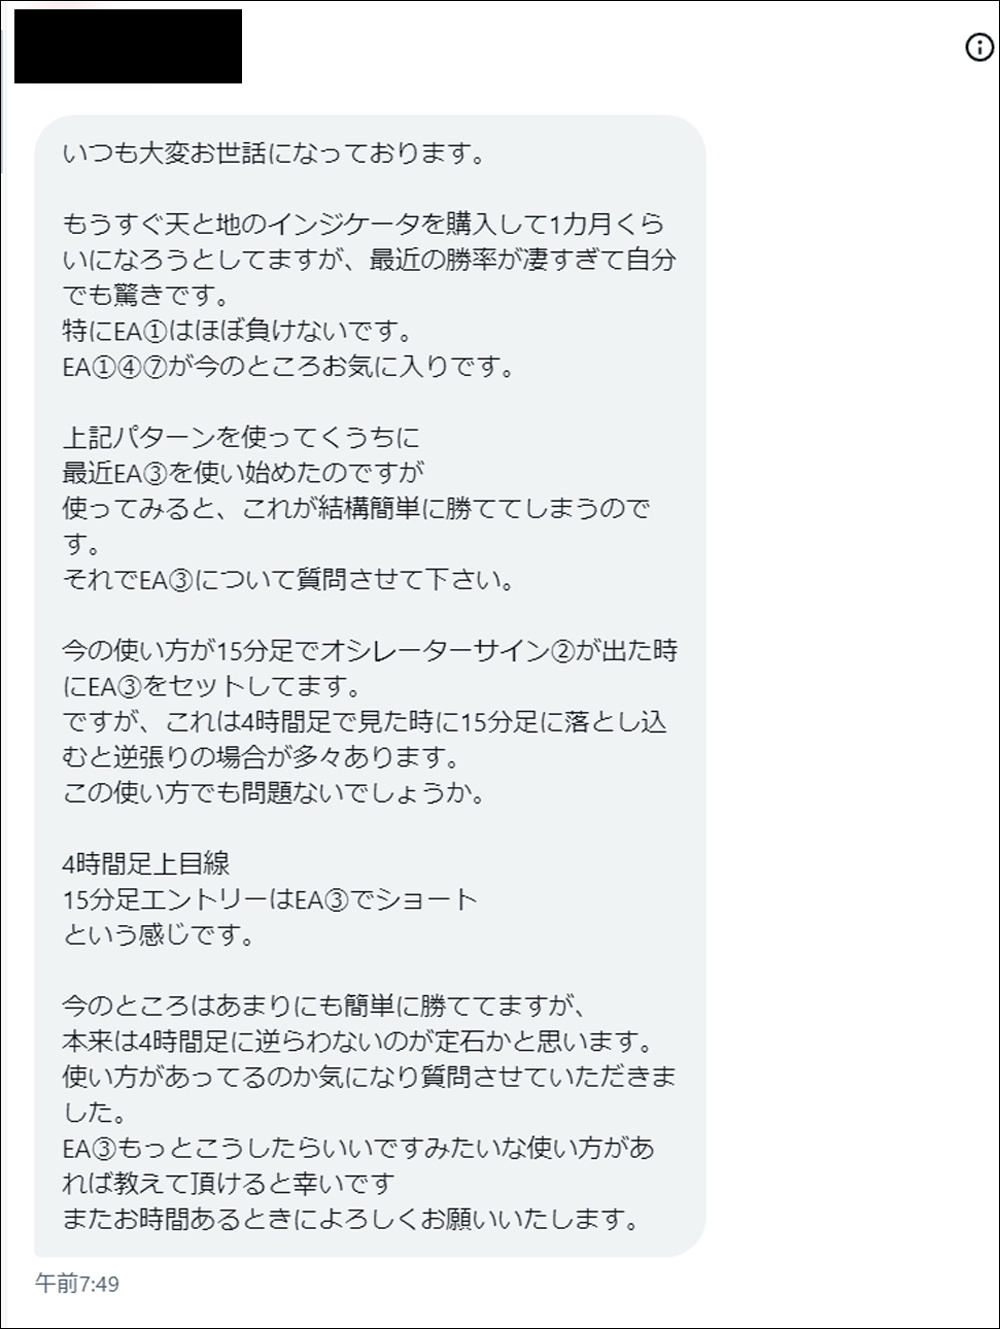
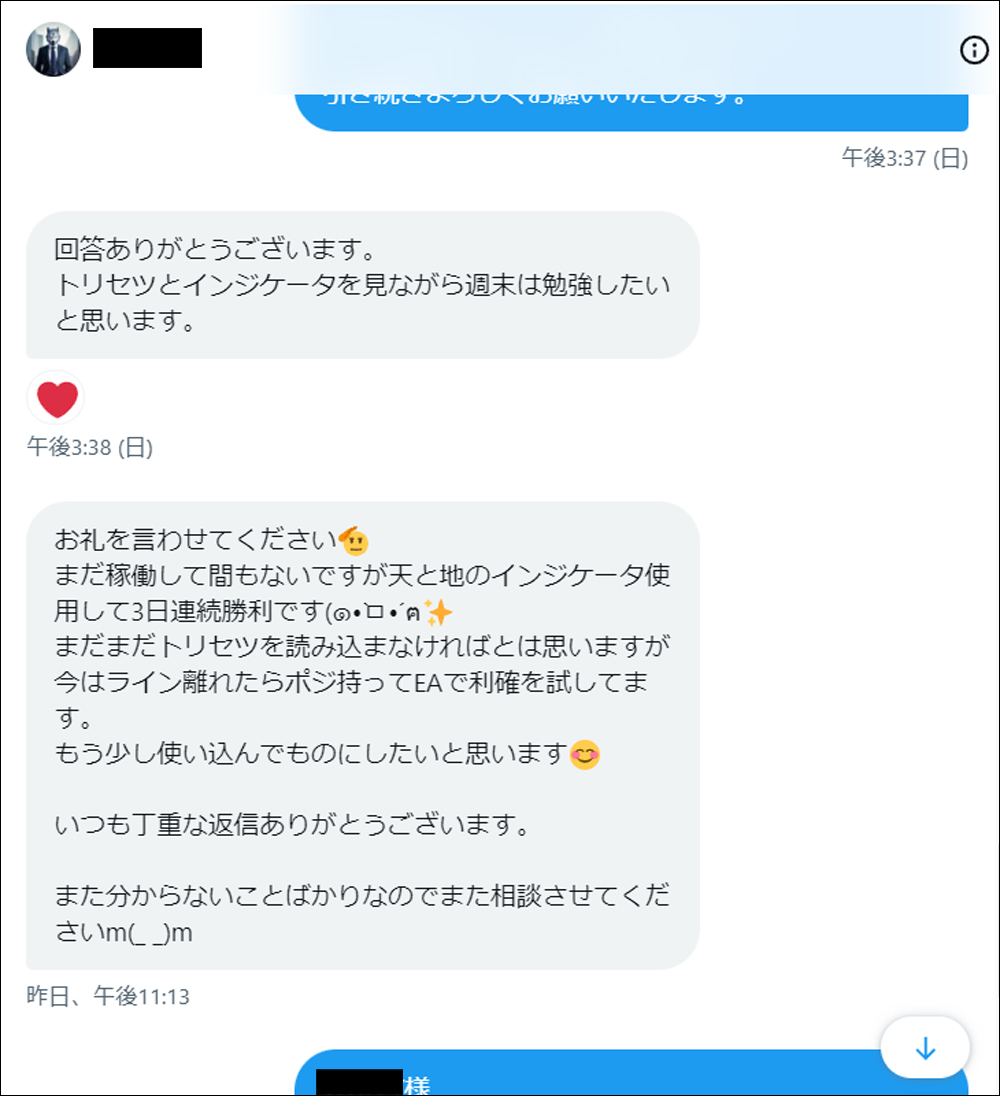
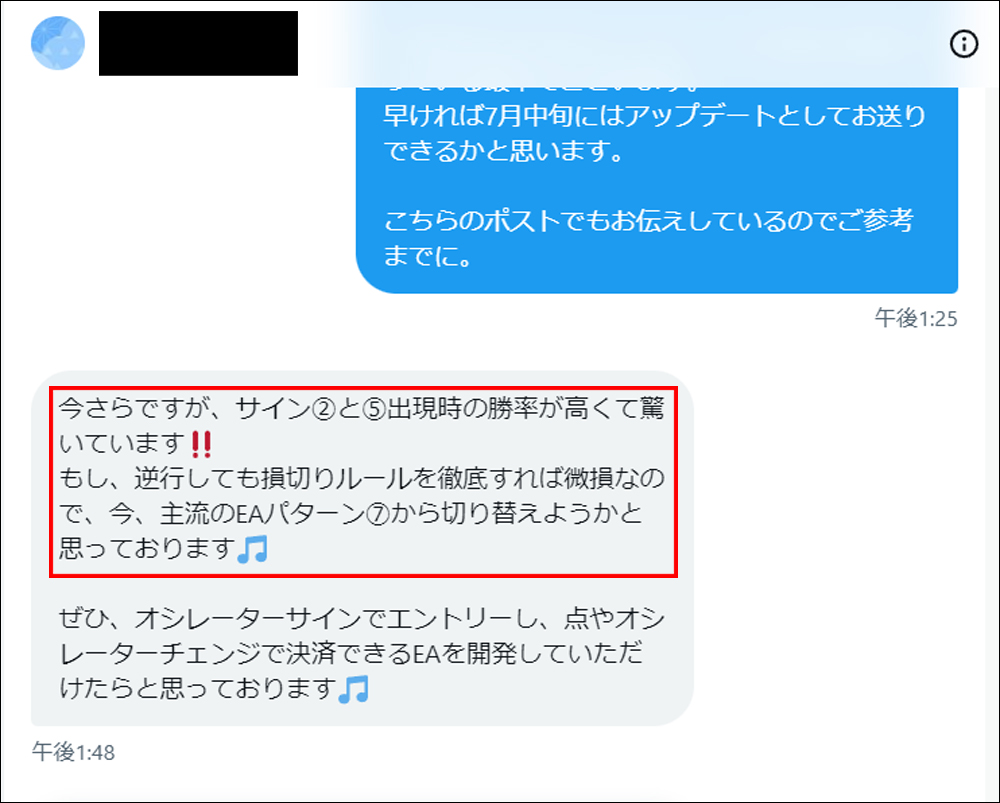
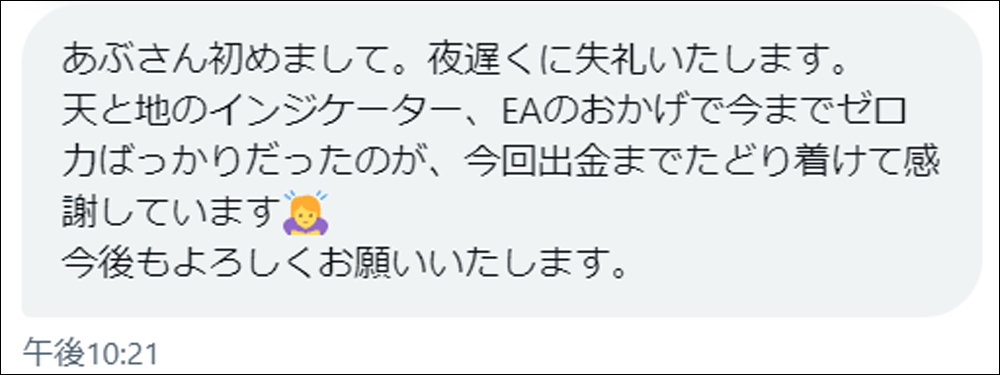
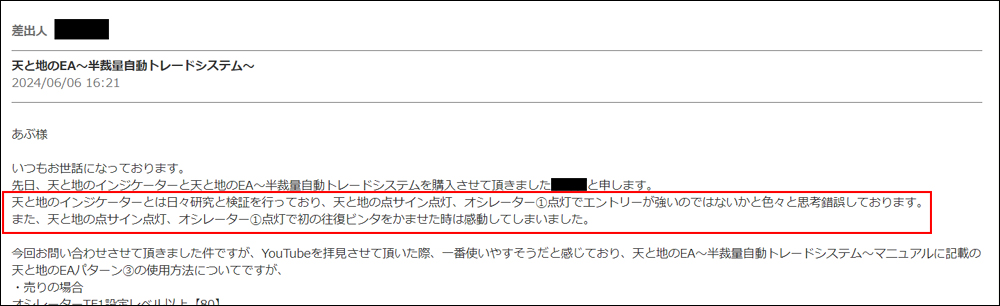
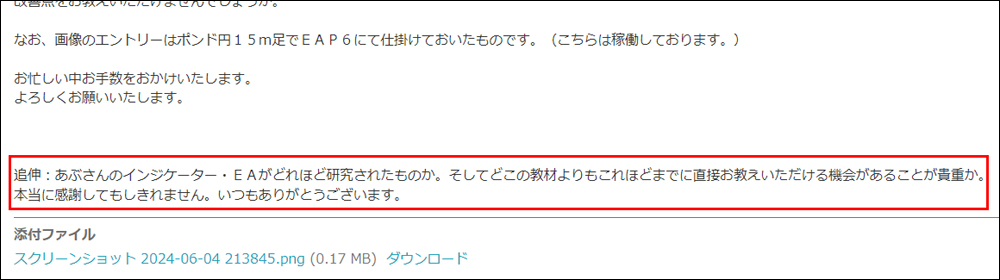
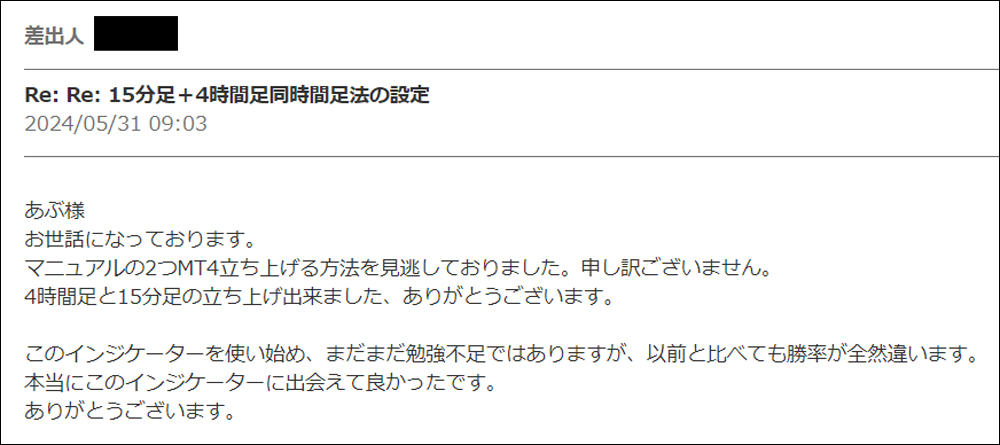
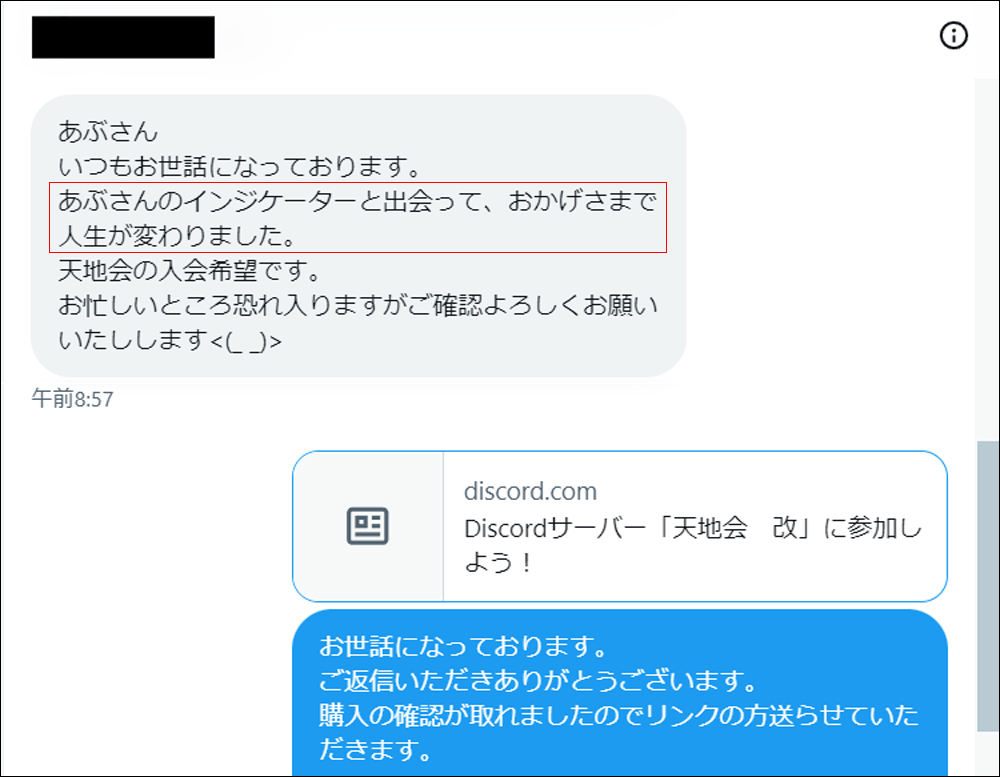
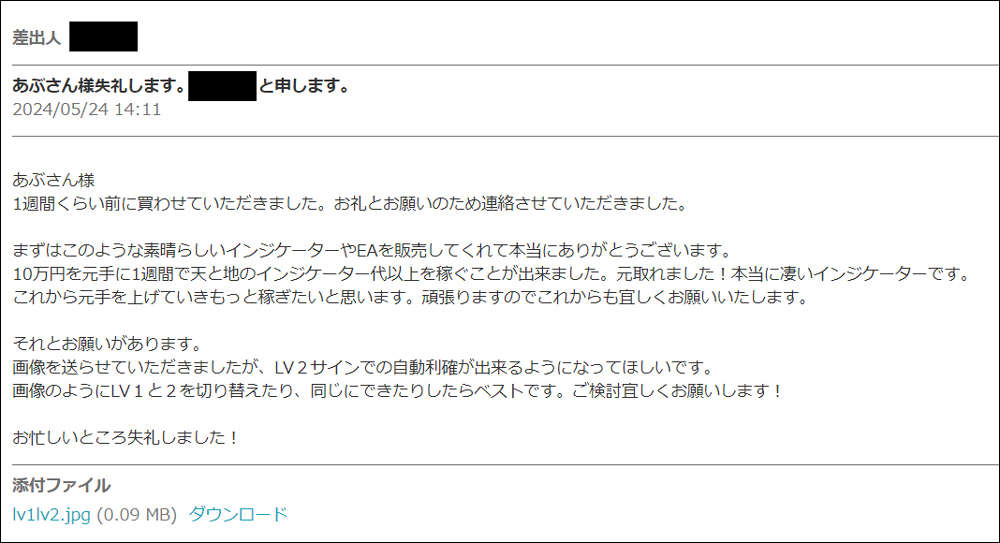
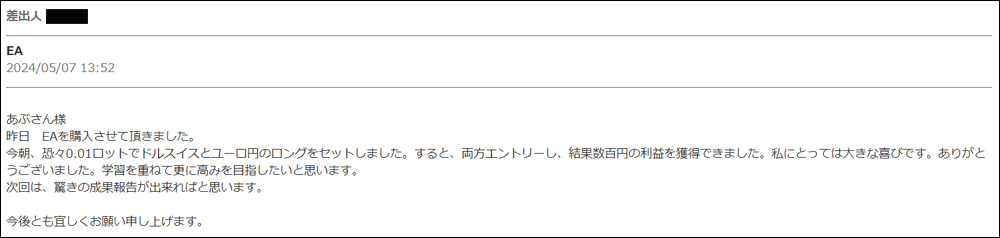
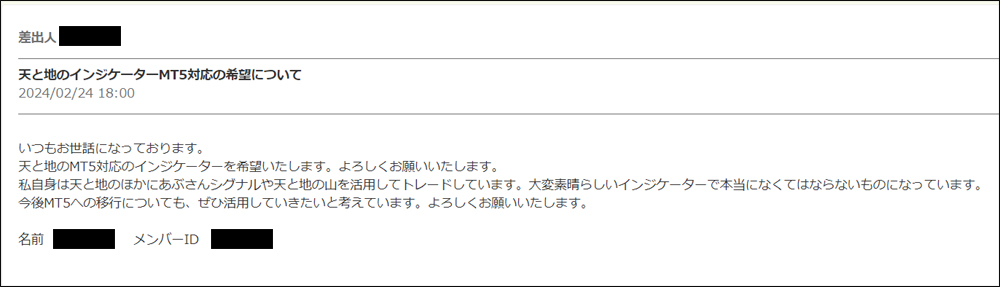
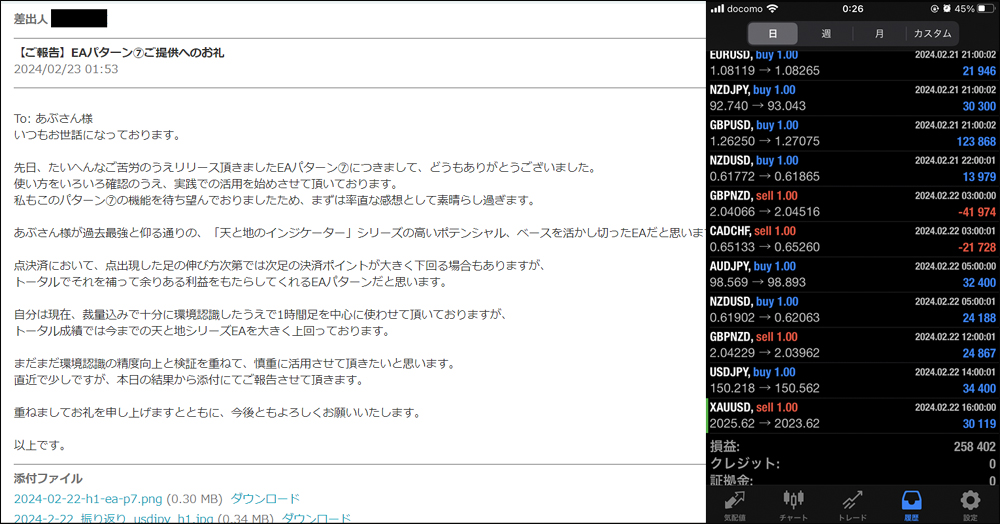
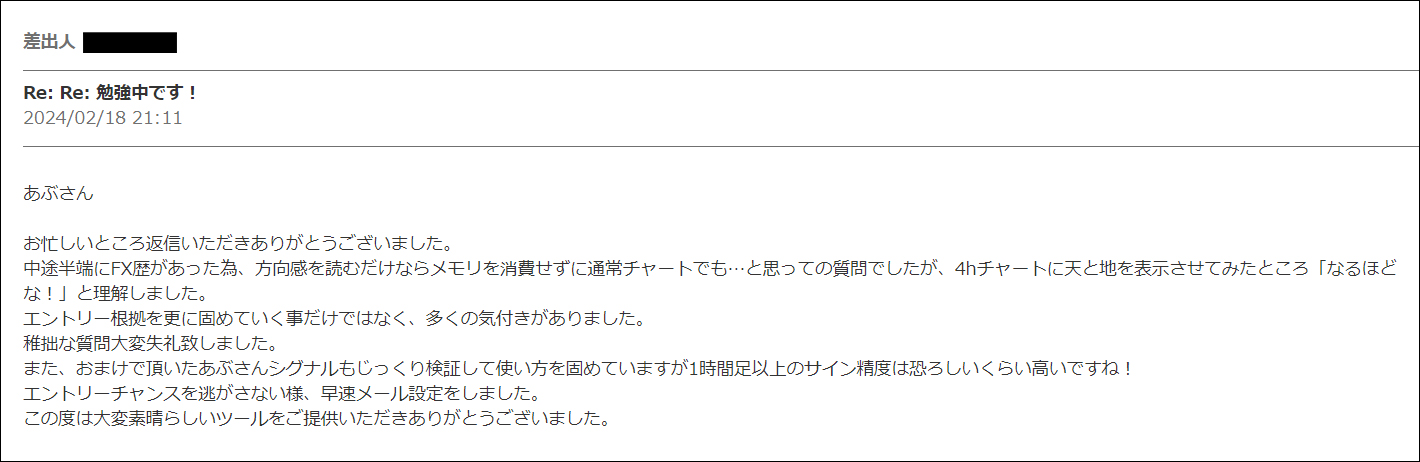
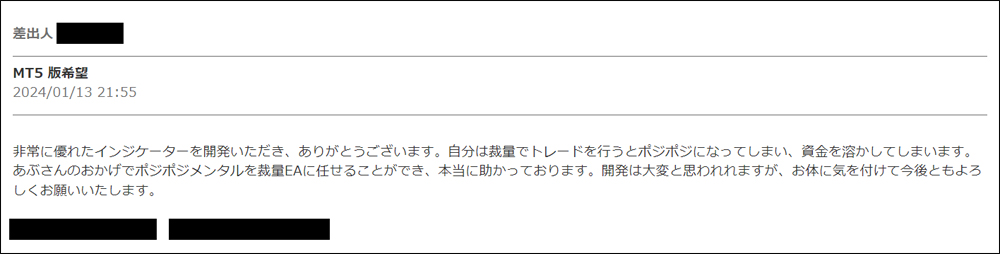
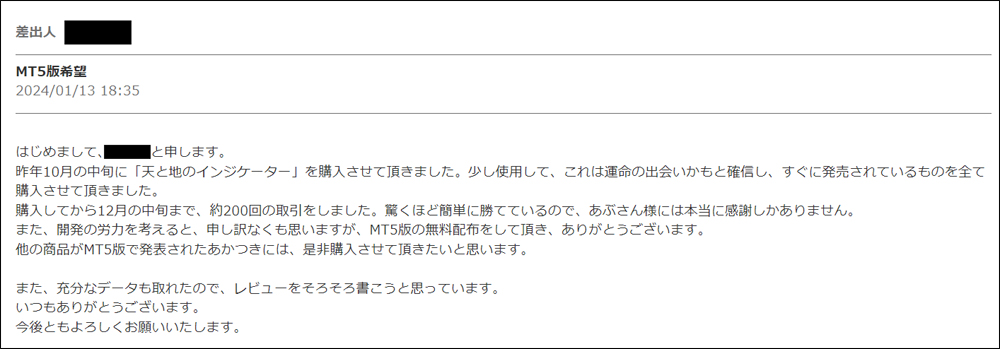
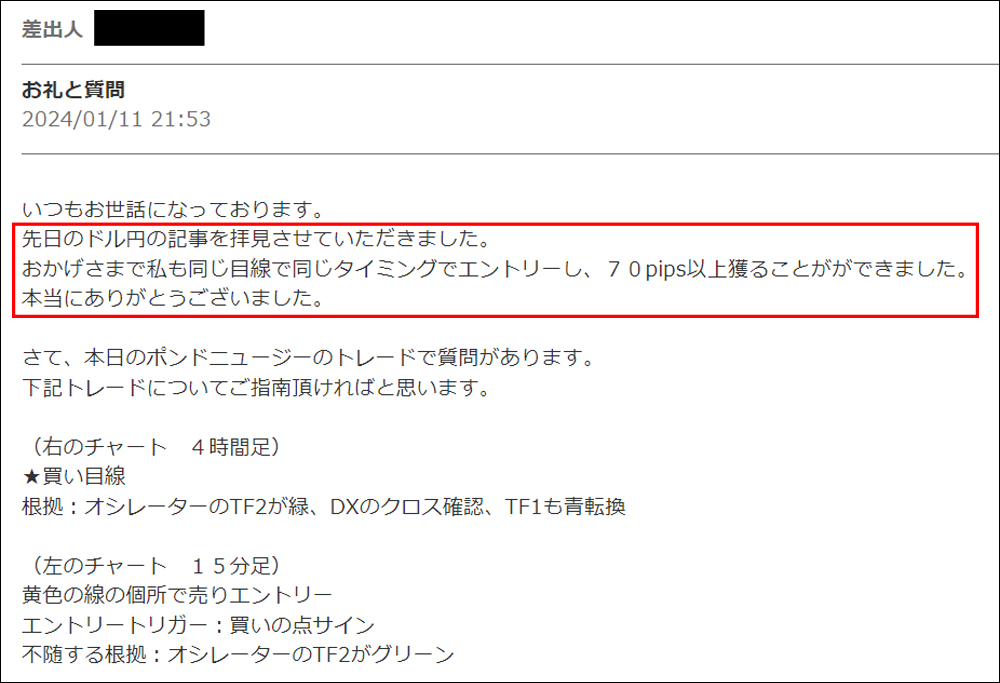
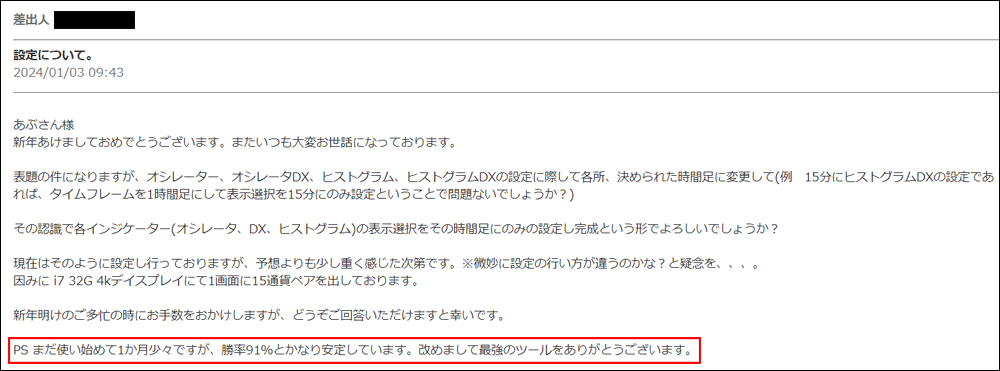
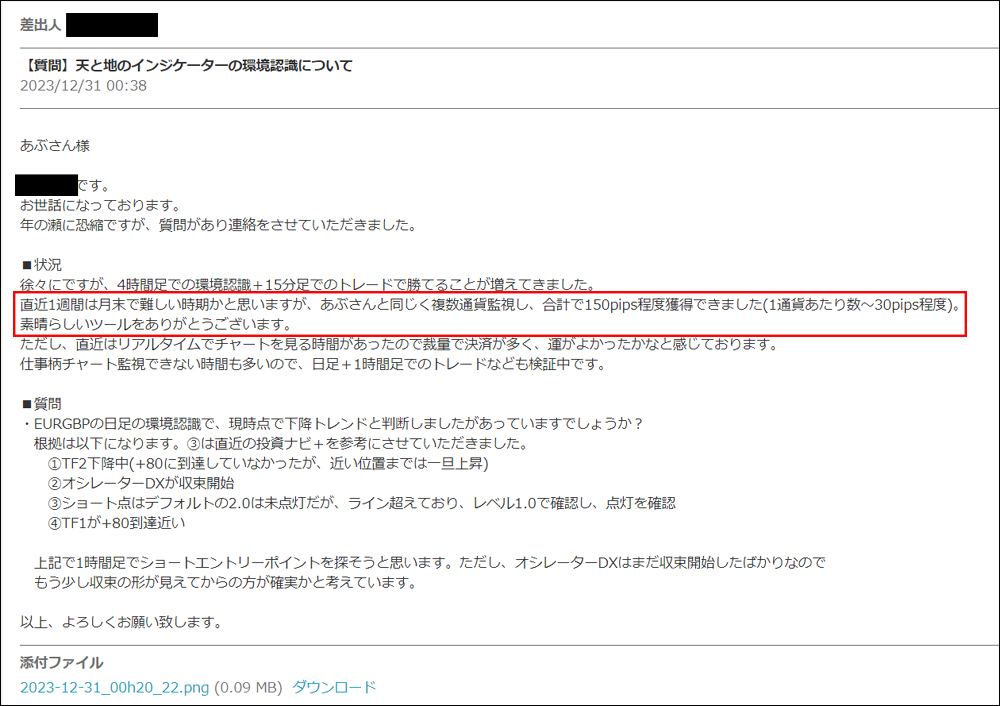
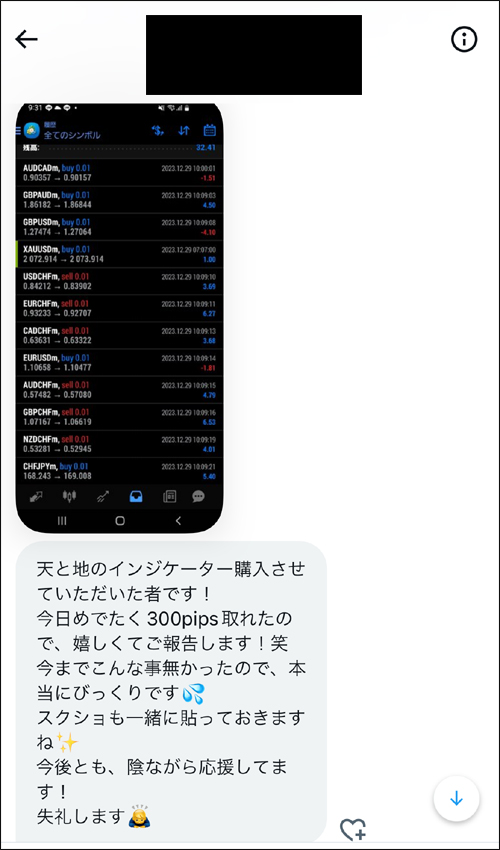
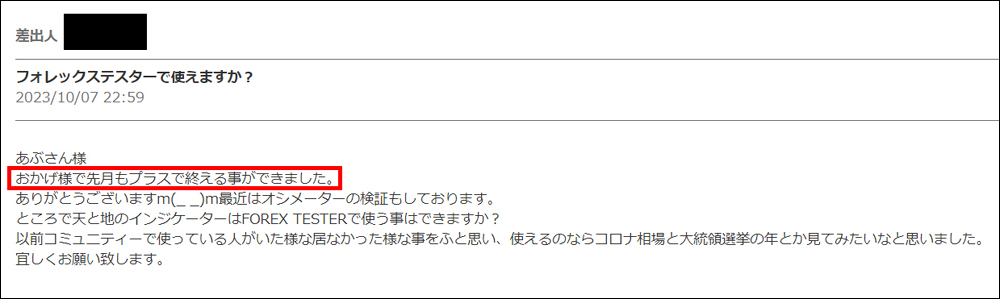
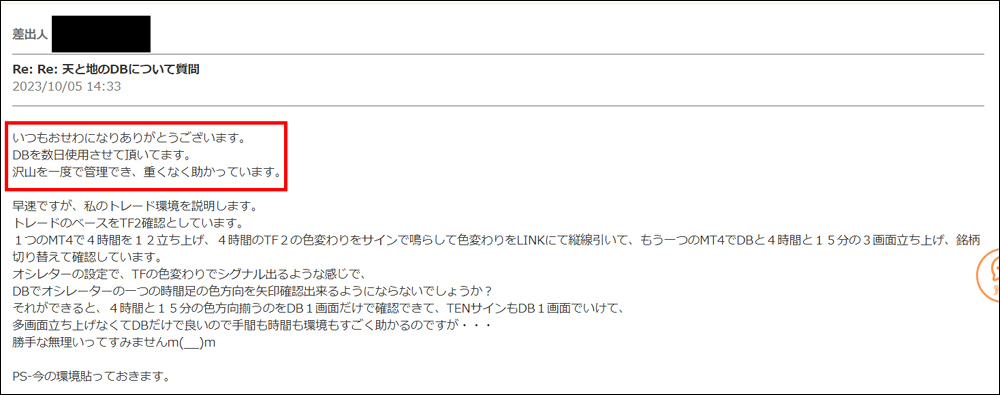
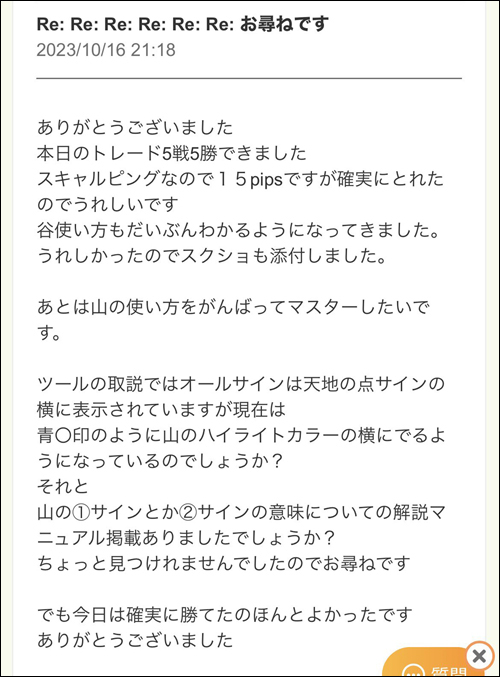
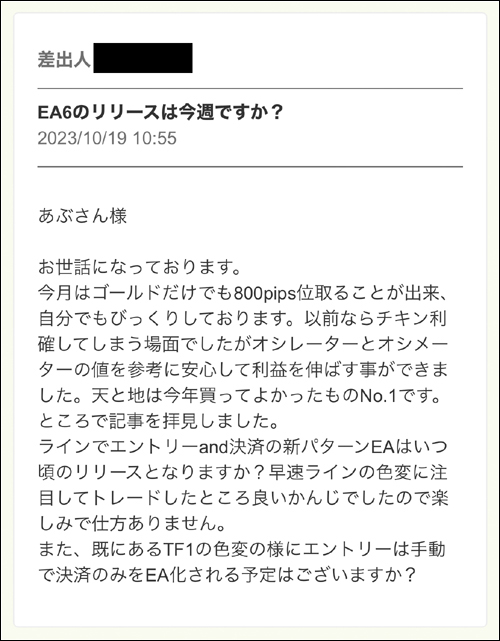
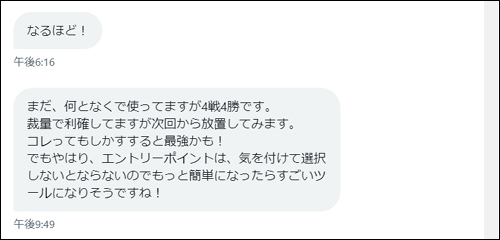
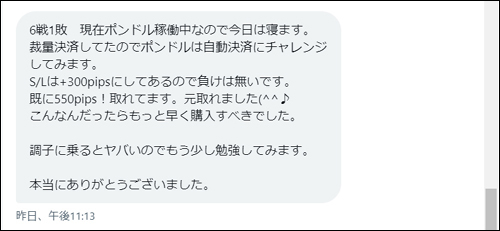
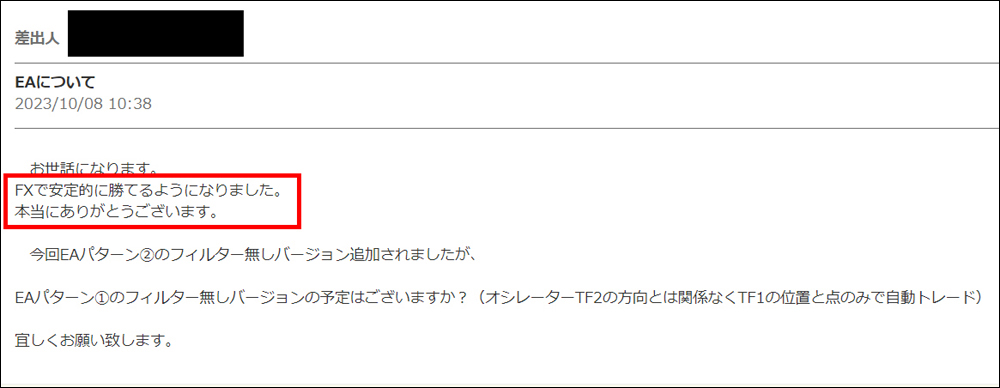
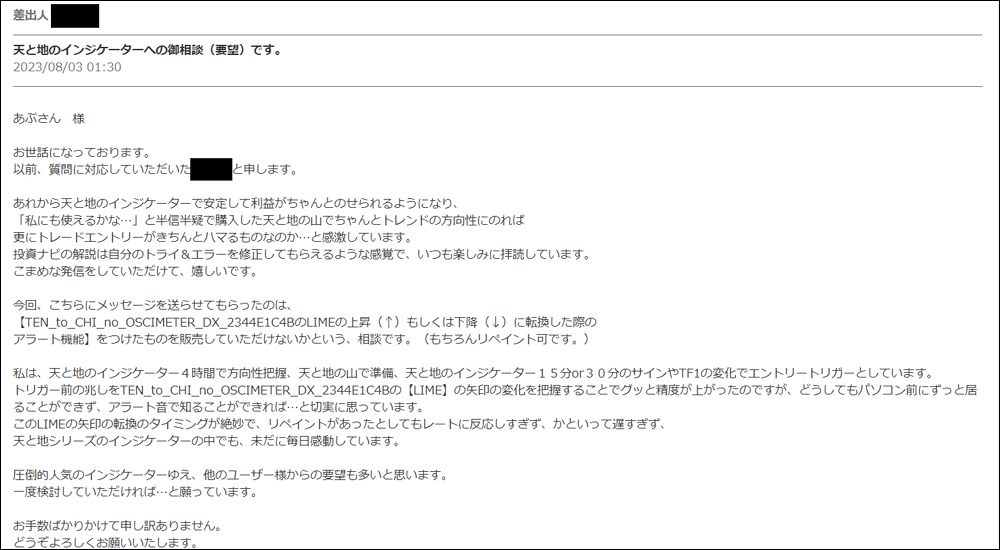
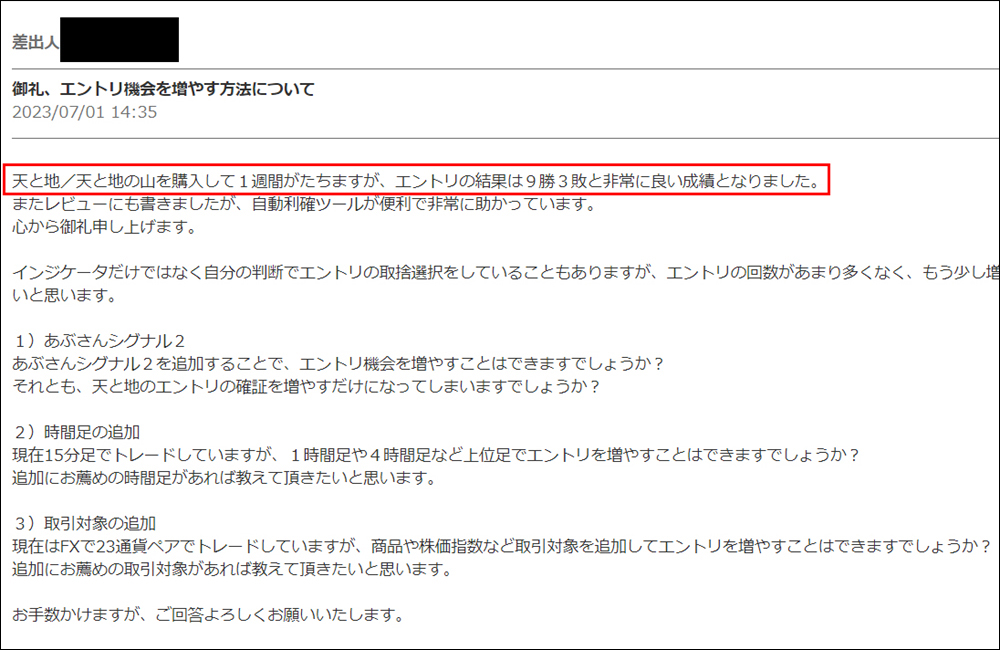
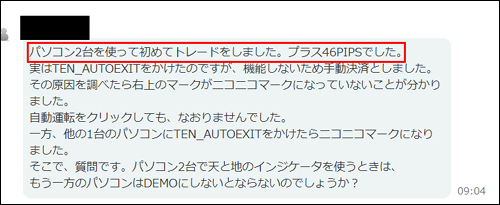
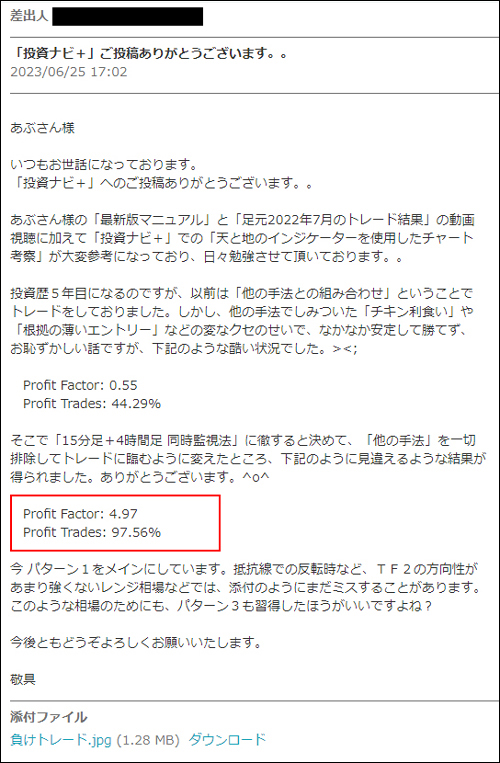
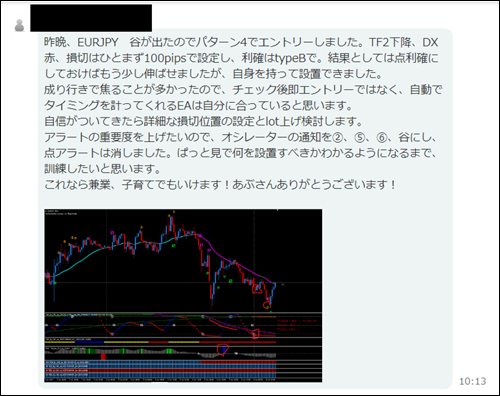
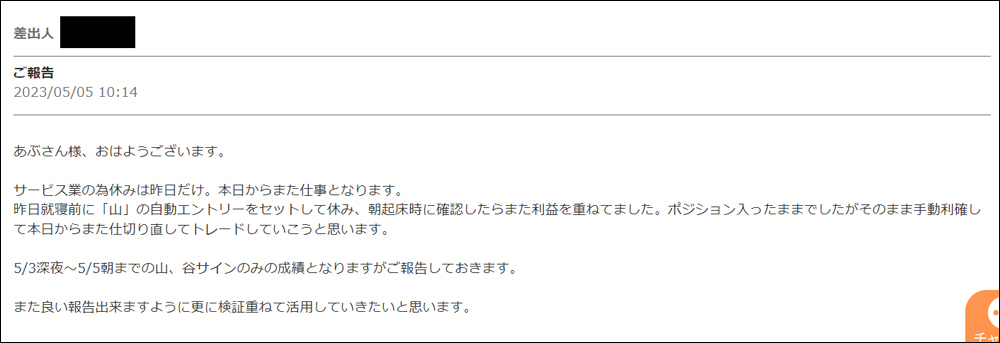
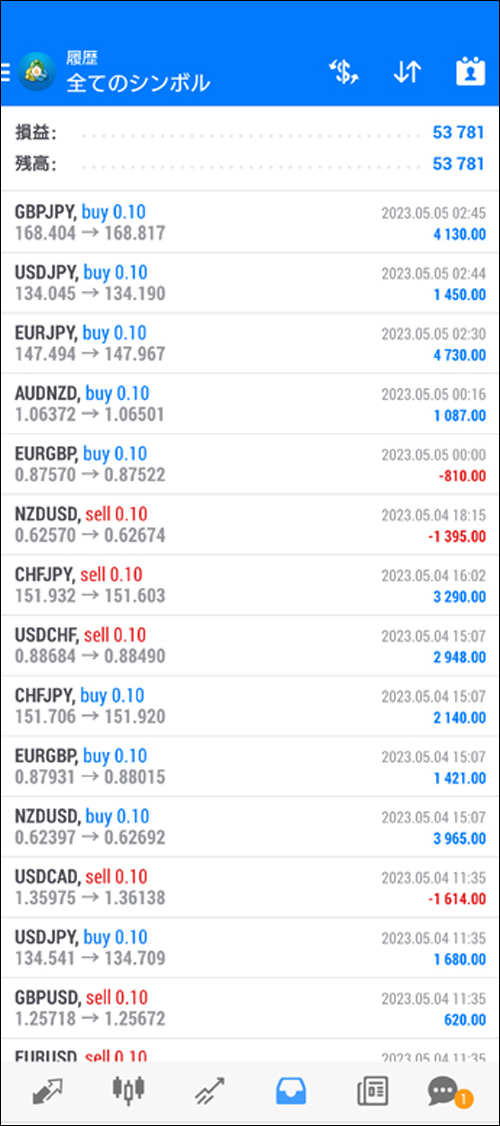
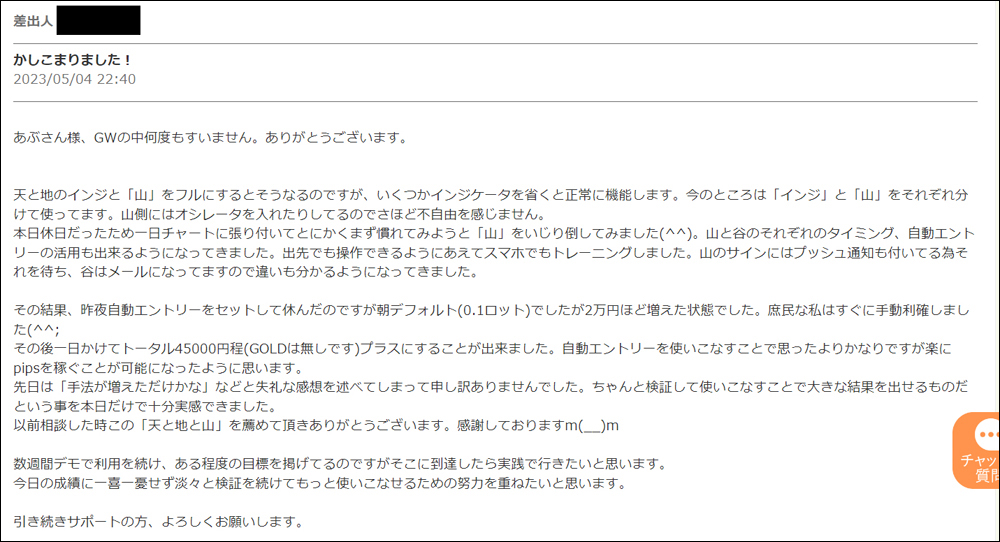
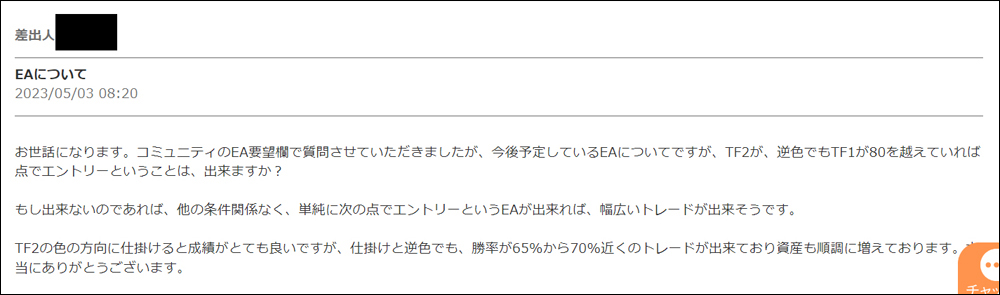
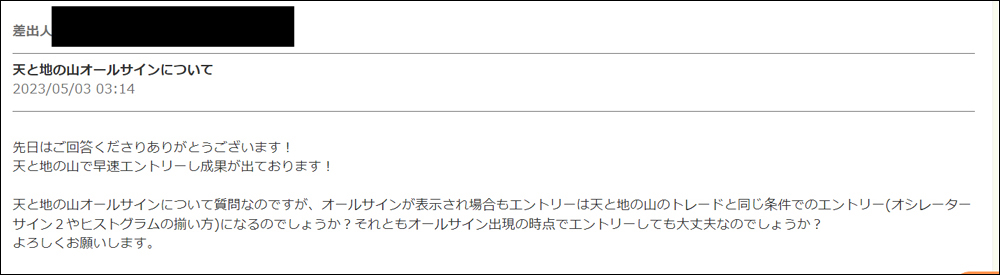
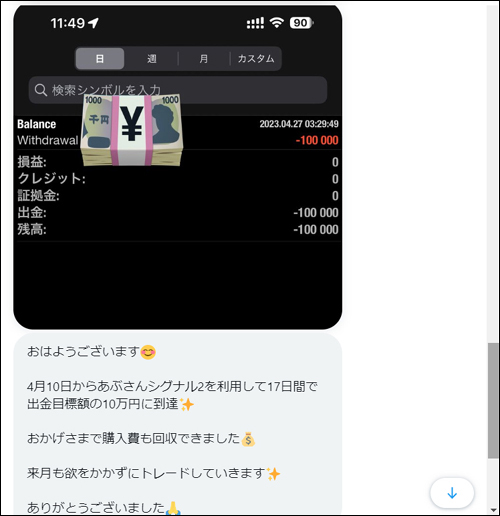
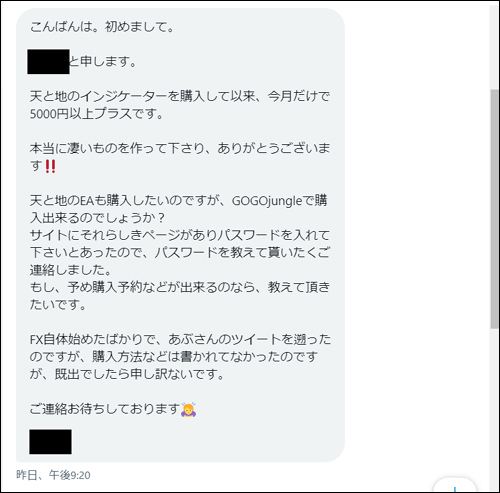
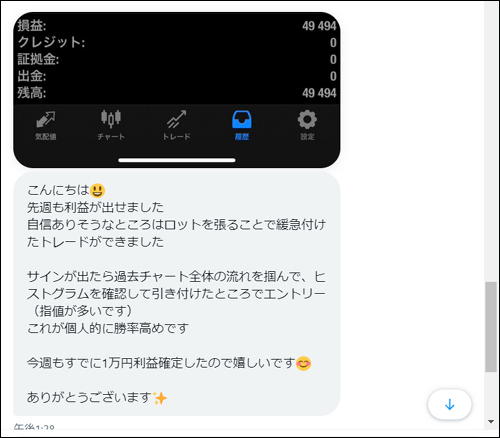
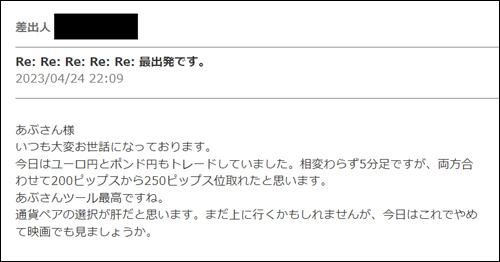
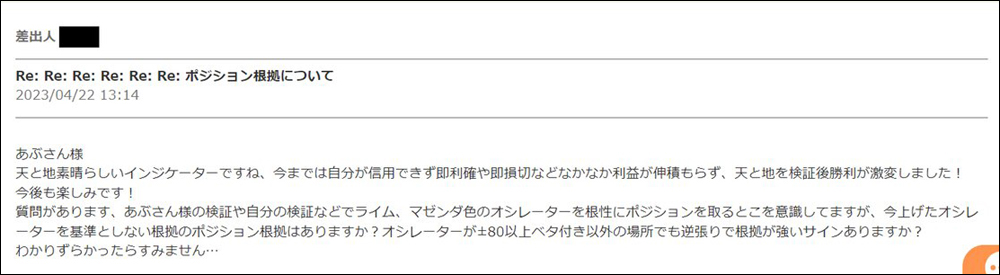
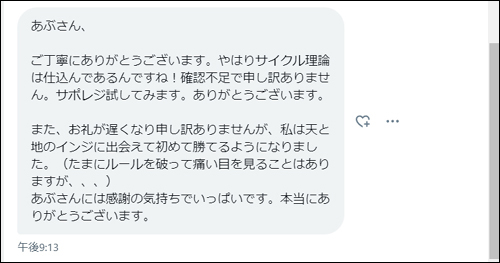
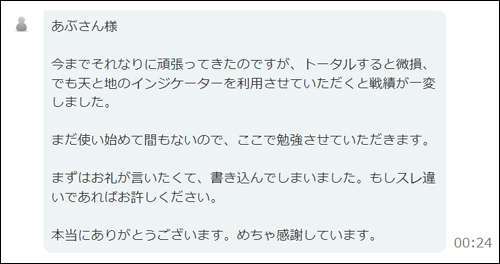
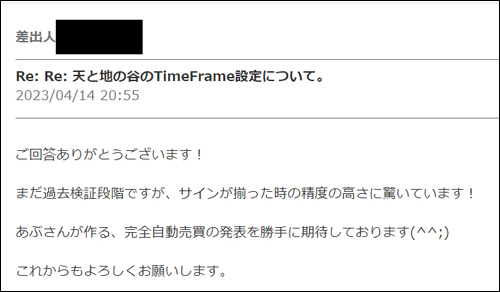
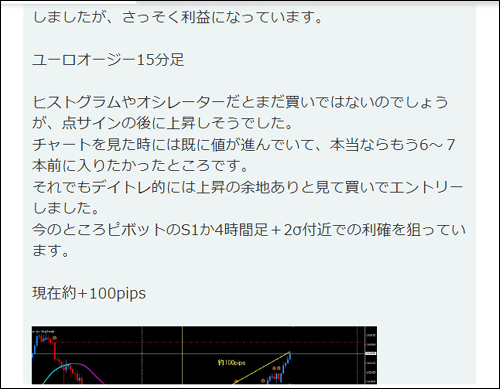
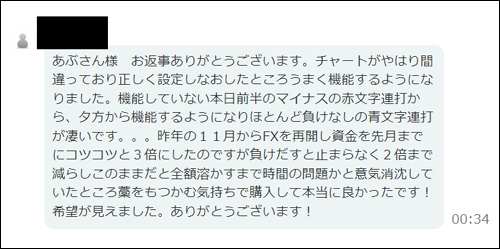
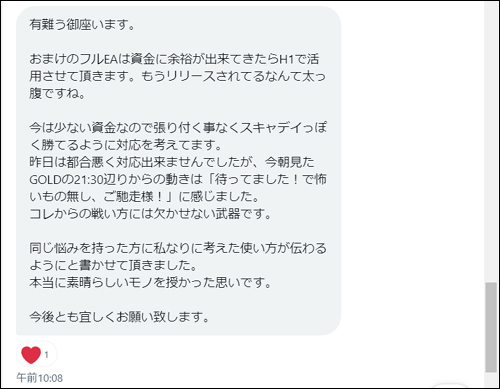
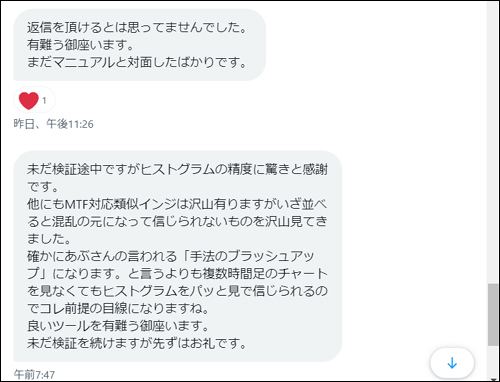
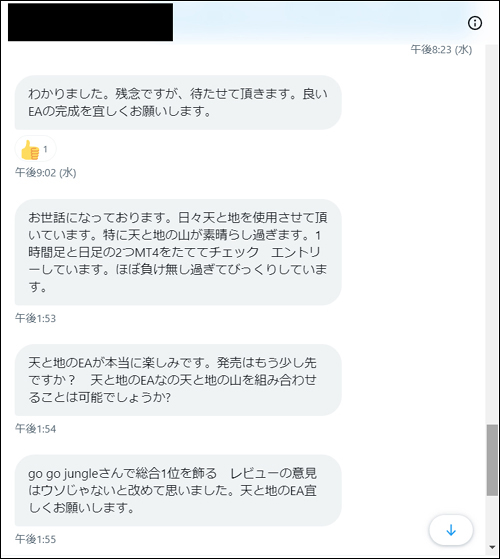
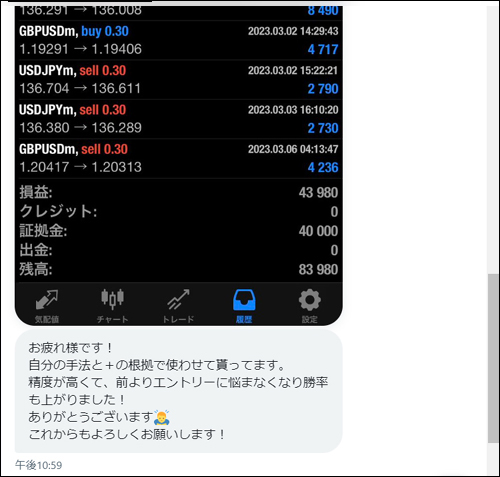
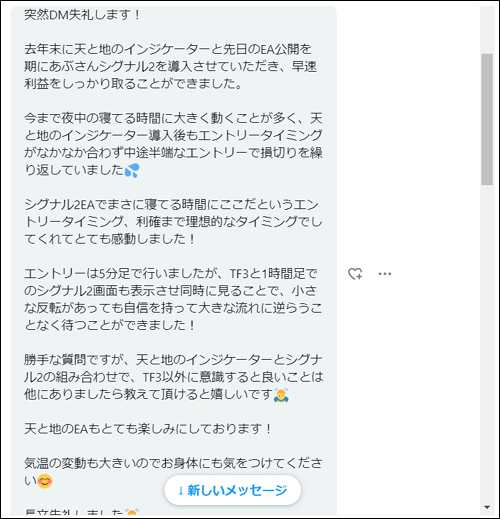
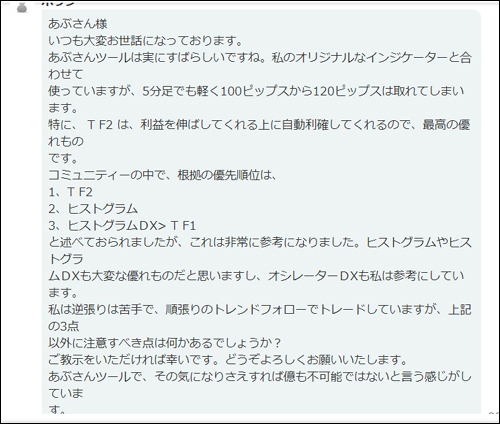
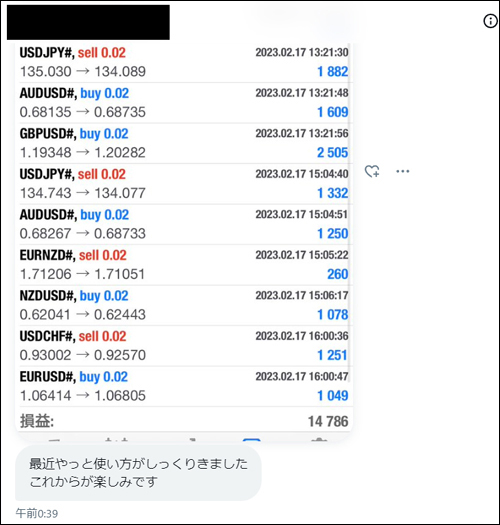
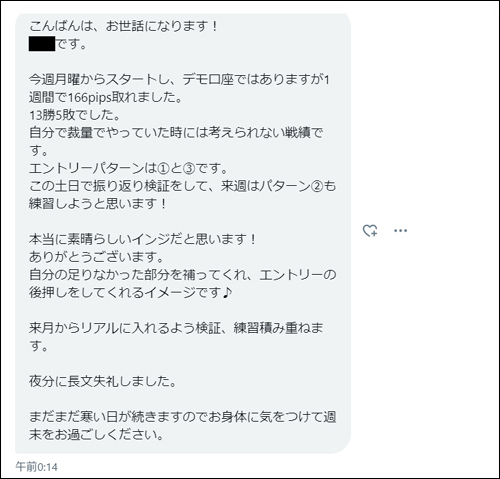
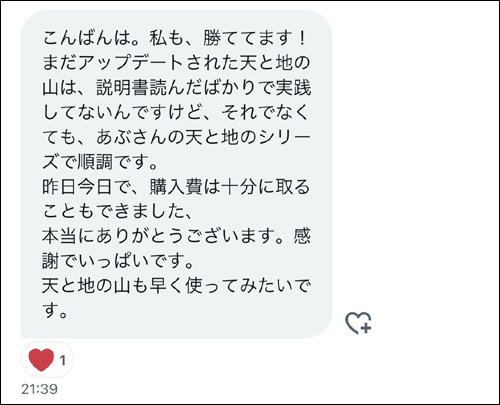
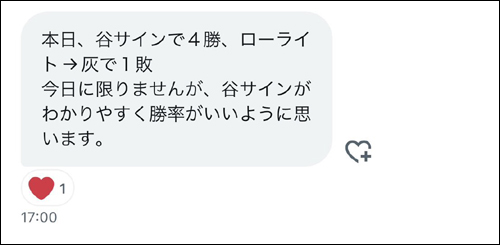
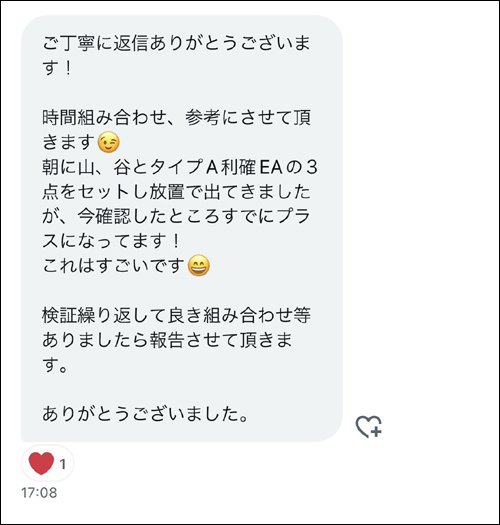
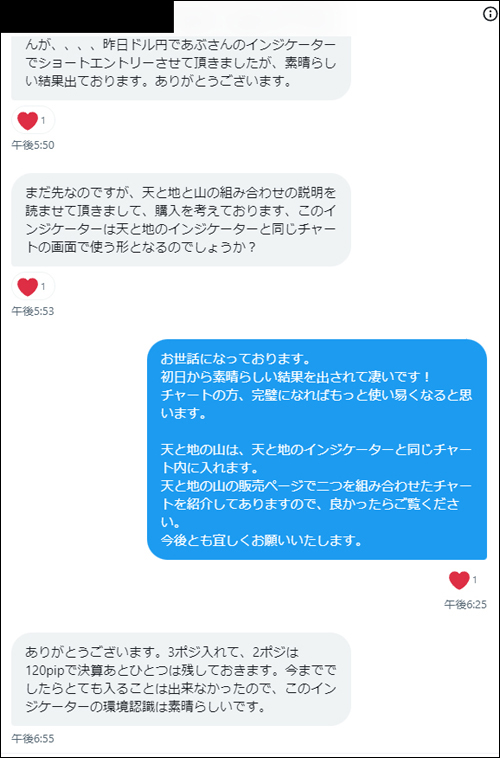
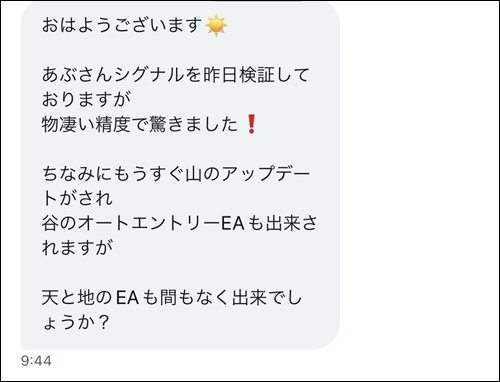
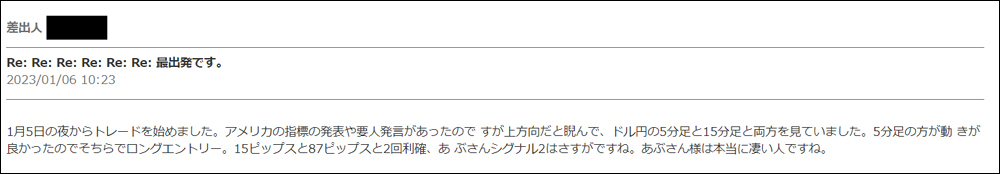
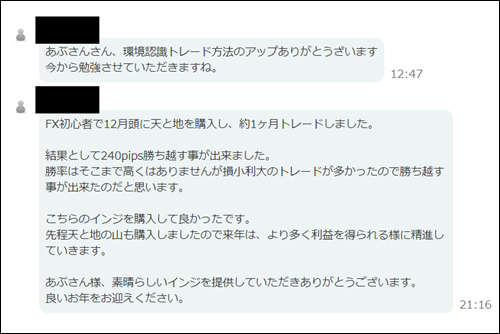
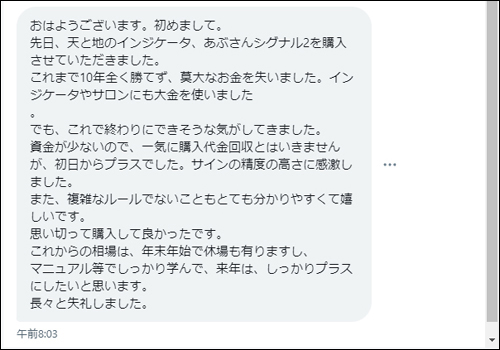
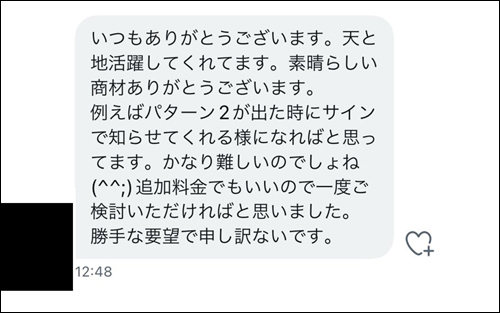
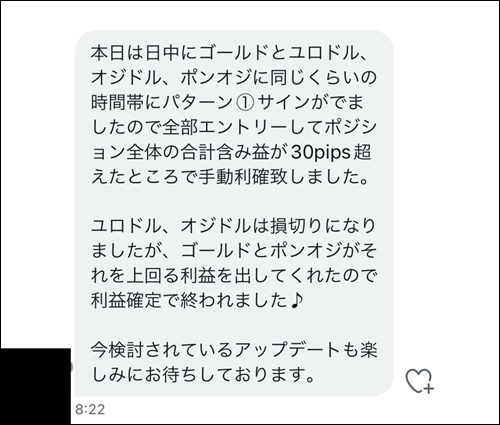
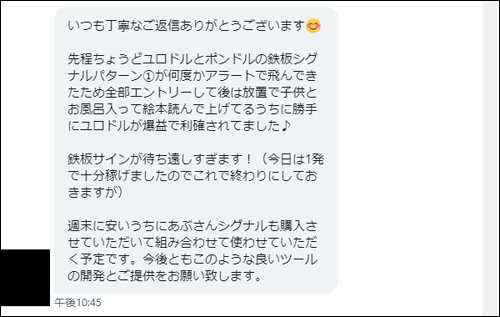
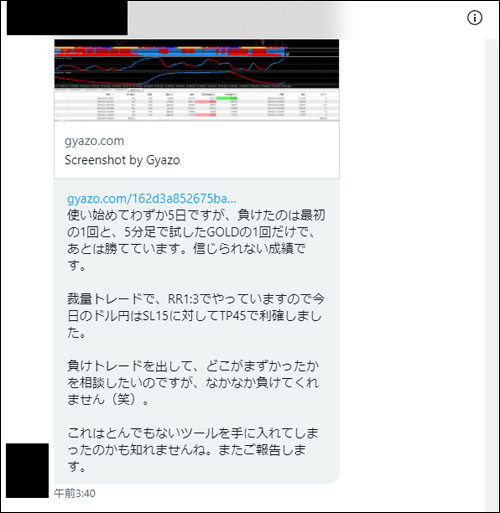
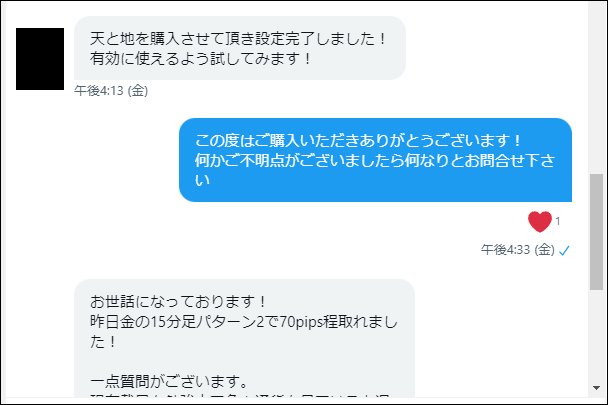
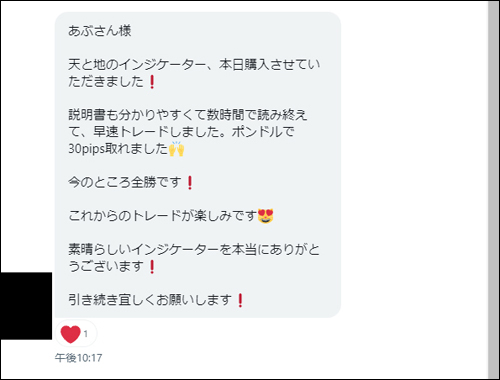
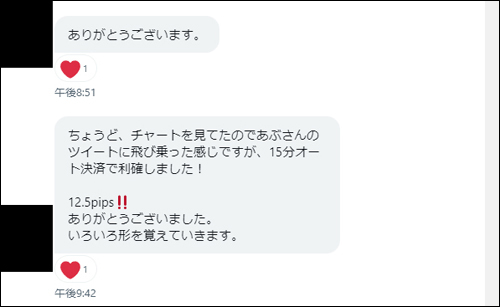
・Impressions (DM version) from users who actually used the Heaven and Earth indicator
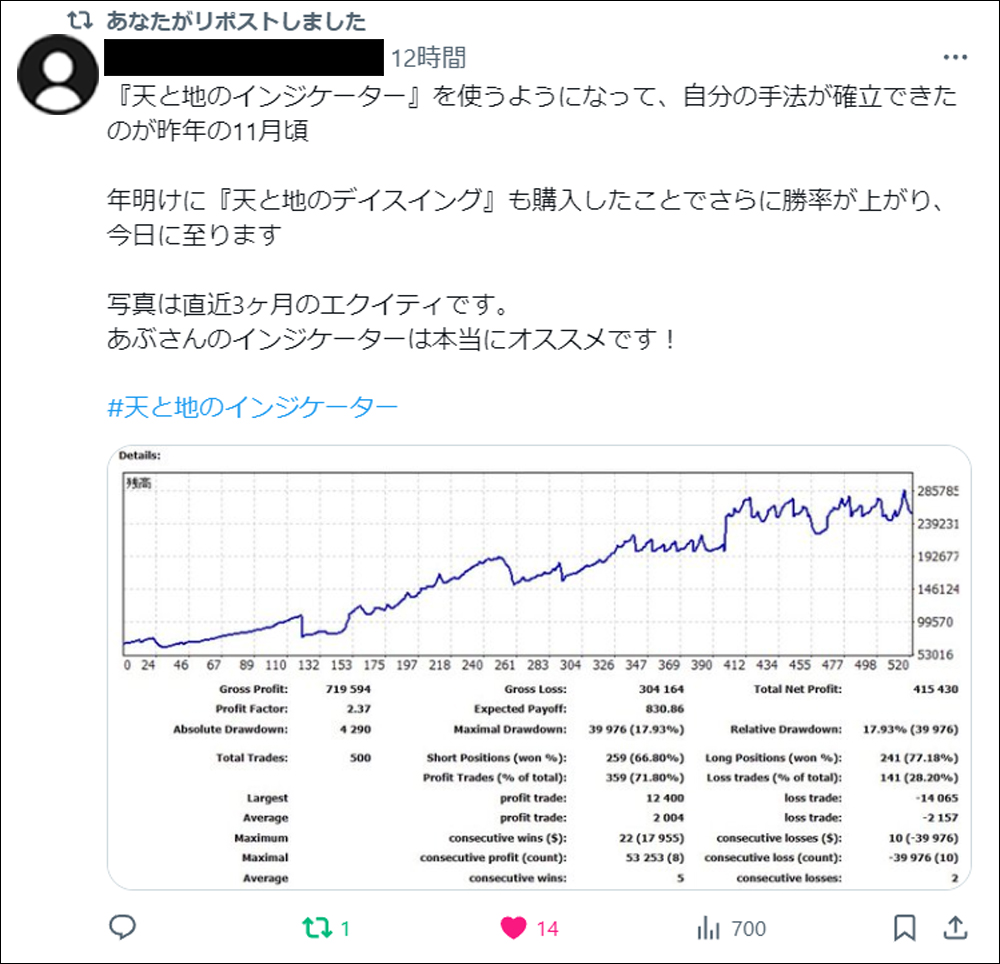
・I searched for “#Heaven and Earth Indicator”
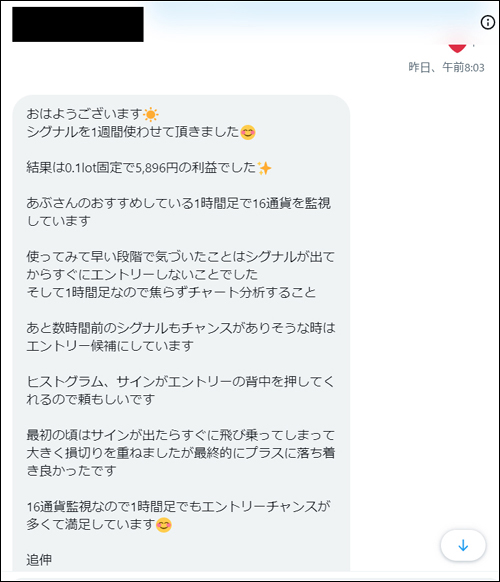
・Introducing posts from monitors who actually used the Dayswing of Heaven and Earth
・Impressions from actual users who used the Dayswing of Heaven and Earth

・The Heaven and Earth Indicator is a trading method that uses my original indicator released in February 2022, developed by Abusan.Thanks to everyone's support,“GogoJungle Award 2022, 2023, 2024 has been awarded for three consecutive years.
・In this article,the “Heaven and Earth Indicator” is used to verify and discuss the“Heaven and Earth Dayswing”Heaven and Earth DayswingThe basic trading method for the Heaven and Earth Indicator can be found inarticles before August 2024Please refer to them.


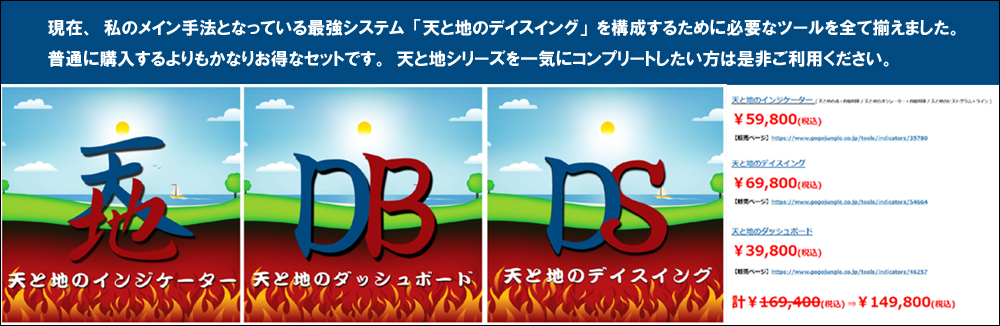
【Limited Release】Full Set of Heaven and Earth
【Abusan / Special Video Vol.1】Users exceed 3,200! Are you still trading FX without “Heaven and Earth”? Why not earn and relax at the same time?

【Abusan / Special Video Vol.2】Difference in ability? No, difference in equipment. Those who don’t use this will have a gap as wide as heaven and earth.


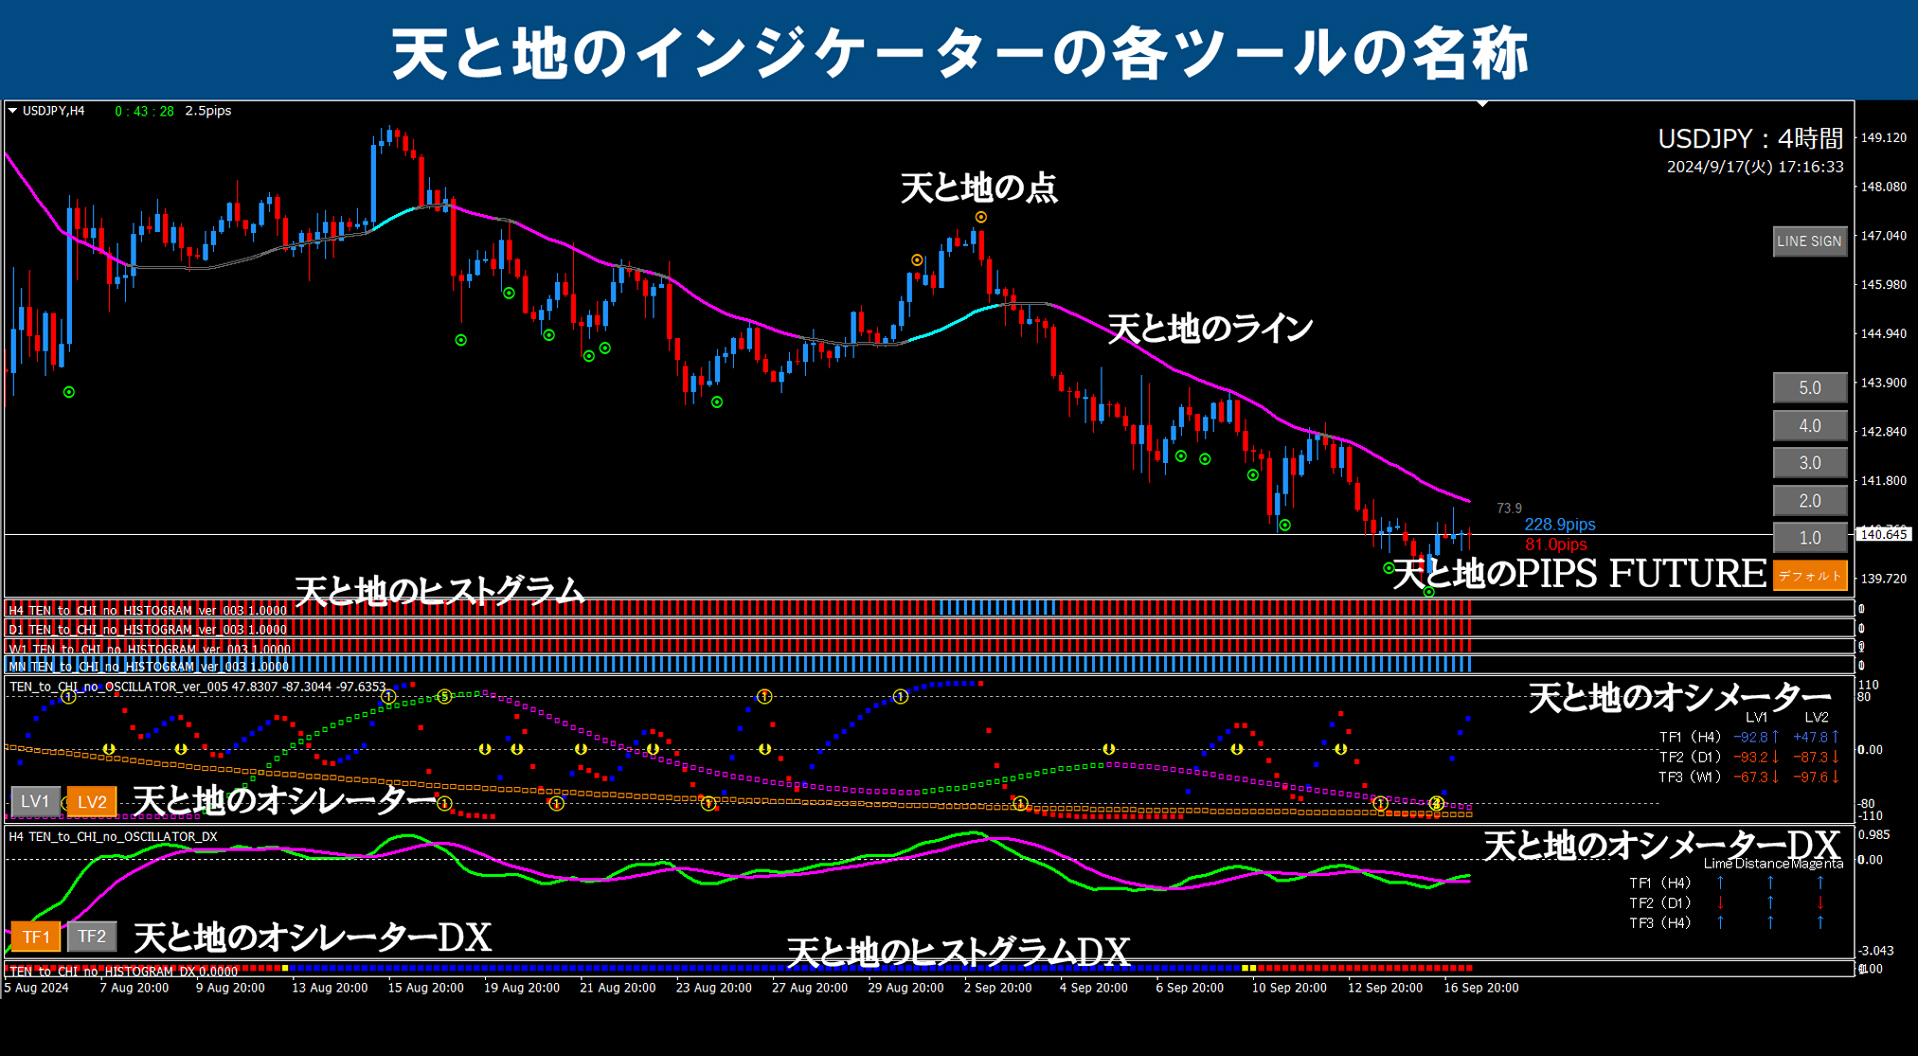
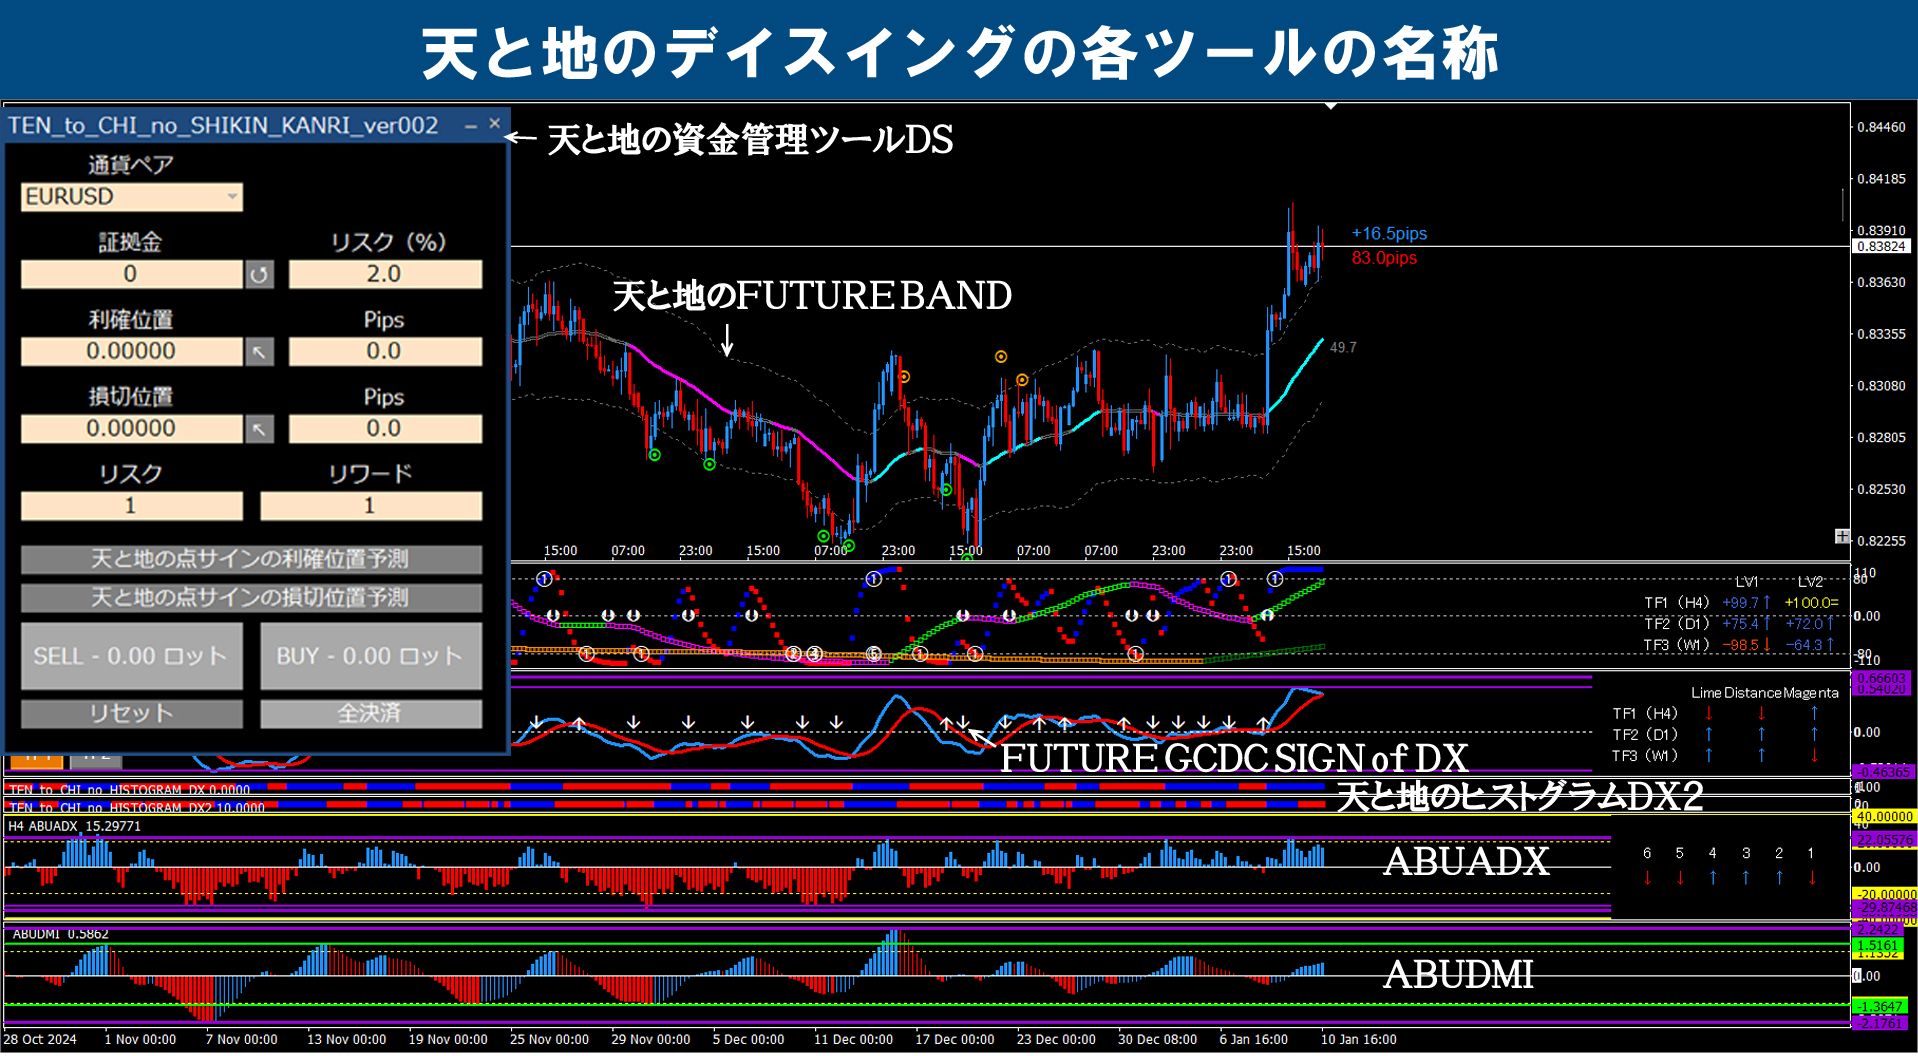
※ For specialized terms used on this blog, please refer to the image below. (All images enlarge when clicked)


GOLD (GOLD) / 1-hour chart + 4-hour chart + daily historical verification
※ Yellow dotted lines indicate all timeframes drawn in the same place.
※ Yellow circles mark important points.
Note: Clicking the chart enlarges it.
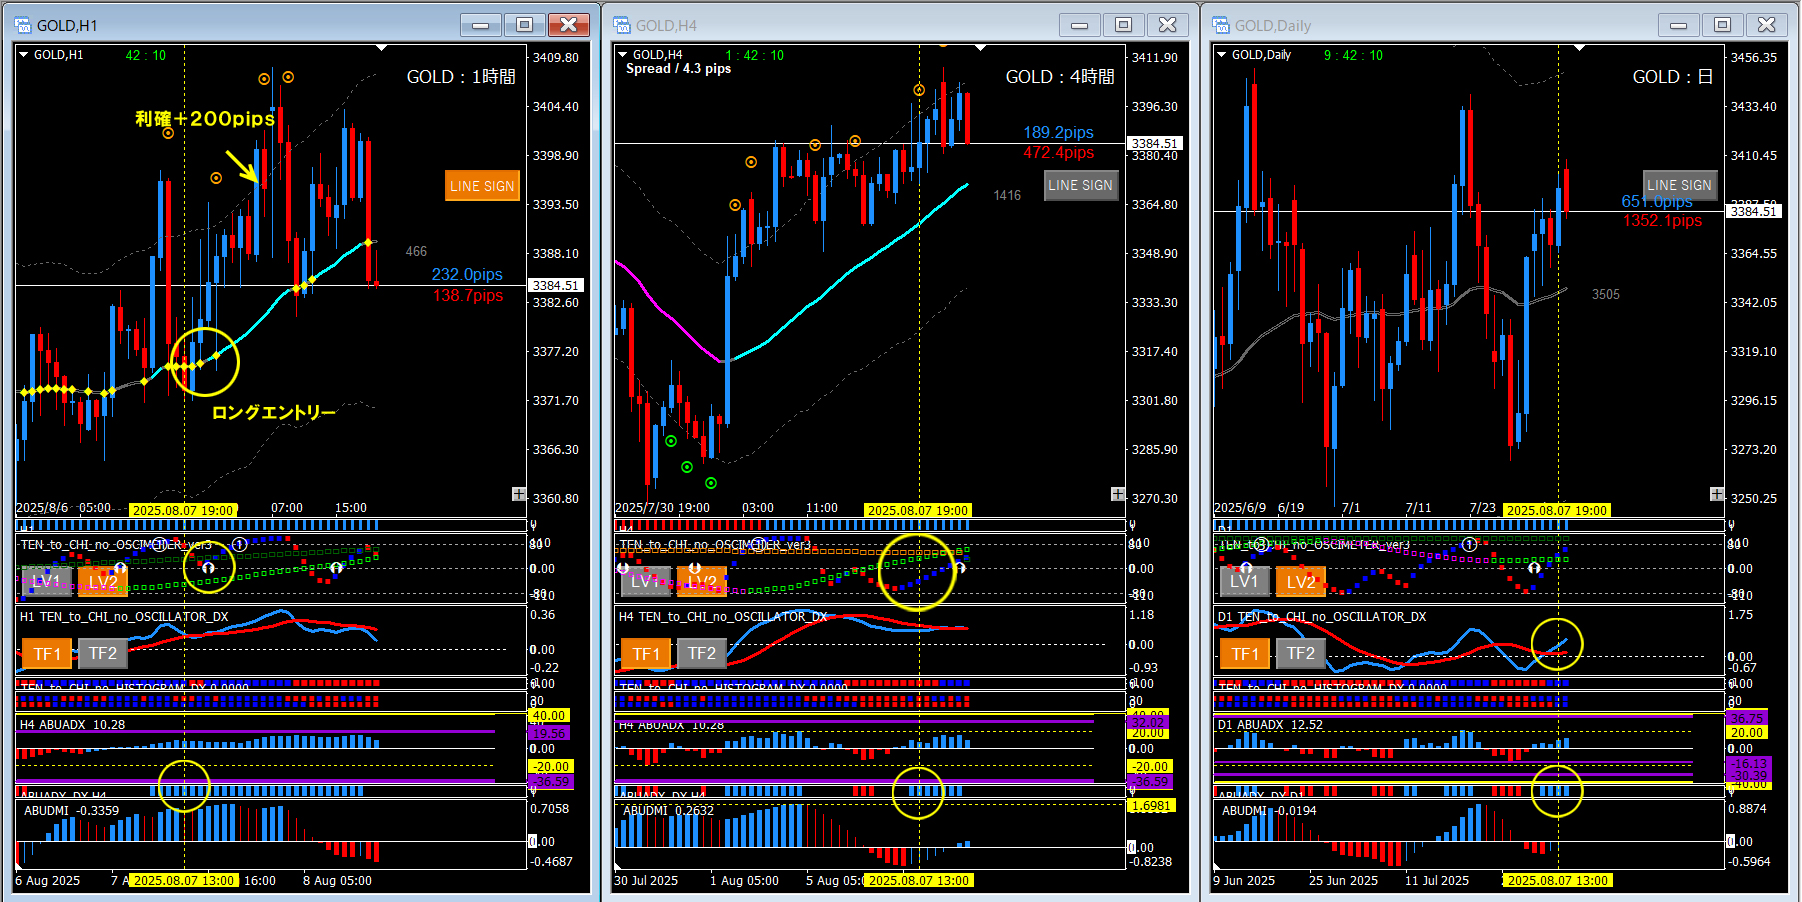
■ 1-hour chart (left: entry timeframe)
・ Line touch entry
・ ABUADX_DX (blue)
■ 4-hour chart (center: environment recognition chart)
・ Oscillator TF1, TF2 (rising)
・ ABUADX_DX (blue)
■ Daily chart (right: environment recognition chart)
・ Oscillator DX (rising crossover)
・ ABUADX_DX (blue)
■ Summary
The ABUADX_DX on the daily and 4-hour charts lights up, indicating a high-probability moment. Use this as a basis to search for long entry points on the 1-hour chart. You can aim for a line touch or the color reversal of Oscillator TF1. Because volatility is high, a line touch entry with a band touch exit is simple and effective.
■ If you use DSATEA
Since I determined an upward bias in the yellow-dotted area, I will enter the 1-hour chart with DSATEA set to long-only. If you turn on the ABUADX_DX filter (4 hours), it will be reassuring. By the way, it may take some time to confirm, but you can also set the filter of ABUADX_DX to (1 day) and it will still be effective. Please give it a try.

I hope this is helpful to everyone, even a little.
Press the GOOD mark to boost motivation for future efforts. Thank you for your cooperation in further increasing motivation.
