

【+1,580,000 yen】 Thorough review of the signal tool DOT.MMS × automated trading|1 trade 13,624 yen · Monthly average 260,000 yen, AI also highly rated!
This time, we will test the performance of the high-win-rate and talked-about signal tool "DOT.MMS" combined with the fully automated trading EA " One-Click FX Arrows” in tandem.
Since trades are executed in sync with the arrows, you can grasp the signal tool’s true performance. Additionally, after each trade, an objective performance evaluation byAI Judgmentwill be conducted.
So, will the AI evaluation be a “high rating”?
Automated Signal Tool Trading: Details of One-Click FX Arrows
What is DOT.MMS?
The signal tool used in this time is “DOT.MMS.” This is a free indicator for MT4 that determines overbought/oversold based on two RSI lines and presents a clear entry signal with arrows. It is mainly used for high/low trades in binary options and for scalping, typically on timeframes of 15 minutes or higher, though it can sometimes support 1-minute charts. The developer’s details are not disclosed, but by linking it with an automated trading EA, fully automatic trading on MT4 is possible.
DOT.MMS is a customized version. The versions distributed on Japanese blogs have garbled text and bugs.DOT.MMS_v2_modified.zip
One-Click FX Arrows Description and Setup Environment
Connecting this signal to automated trading is done with “One-Click FX Arrows.” This time, we will demonstrate in an MT4 environment, using USDJPY as the currency pair and a 1-hour chart.
The test environment settings are as follows:
- Test period: April 2023 to September 2023
- Model: Control Point
- Spread: fixed at 0.2 pips
- Stop loss / Take profit: both not set
- Trailing stop: chandelier exit (set to 10x as a substitute for stop loss)
- Signals do not repaint: enter immediately when the arrow appears
- Reverse-direction arrows trigger reverse entries
- Maximum positions: 1 (no additional entries and no hedging)
With these settings, we will pragmatically test how DOT.MMS signals can be utilized in automated trading.
Start of Auto-Trading
Open Strategy Tester,One-Click FX Arrowsand select period, currency pair, and model to begin testing in Visual mode.
As the chart starts moving, the DOT.MMS indicator appears, and arrows materialize according to the signals. First, we will confirm that entries are executed in response to the signals.
When arrows appear, entries are automatically executed, and when the opposite-direction arrow appears, a close is made and a reverse entry is performed simultaneously.
Since the automated trading operation has been confirmed to function properly, we will now disable the automatic stop and proceed with full-scale trading.
At the bottom of the screen is a real-time profit and loss graph, allowing you to clearly see the trading status even when playback speed is increased.
Note that the maximum number of positions is set to 1, so even if arrows of the same direction appear consecutively, no additional entries will be made. When this happens, an error message indicating the position limit will be displayed at the bottom-left of the screen.
In this video, about six months of historical data are used, so playback speed is increased. Actual trading processing takes about six minutes to complete.
Period End and Summary
Six months of trading have ended.AI JudgmentCSV files for evaluation and a folder of output images will automatically open. Also,One-Click FX Arrowswill automatically compile statistics such as total profit/loss, win rate, and profit factor on the screen.
AI Judgment Analysis Results
Let’s review the AI analysis results.
Step 1: Statistical Summary
| Item | Value |
|---|---|
| Trading period | 2023-04-03 ~ 2023-09-29 |
| Total trades | 116 |
| Total net profit (yen) | 1,580,400 |
| Winning trades / Profit | 66 trades / +4,470,700 yen |
| Losing trades / Loss | 50 trades / -2,890,300 yen |
| Win rate (%) | 56.90 % |
| Profit factor | 1.55 |
| Average risk-reward | 1.17 |
| Average profit/loss per trade | 13,624.14 yen |
| Average pips | 63.46 pips |
| Maximum drawdown | -321,600 yen / -16.91 % |
Step 2: Graphs and Comments
Cumulative Profit
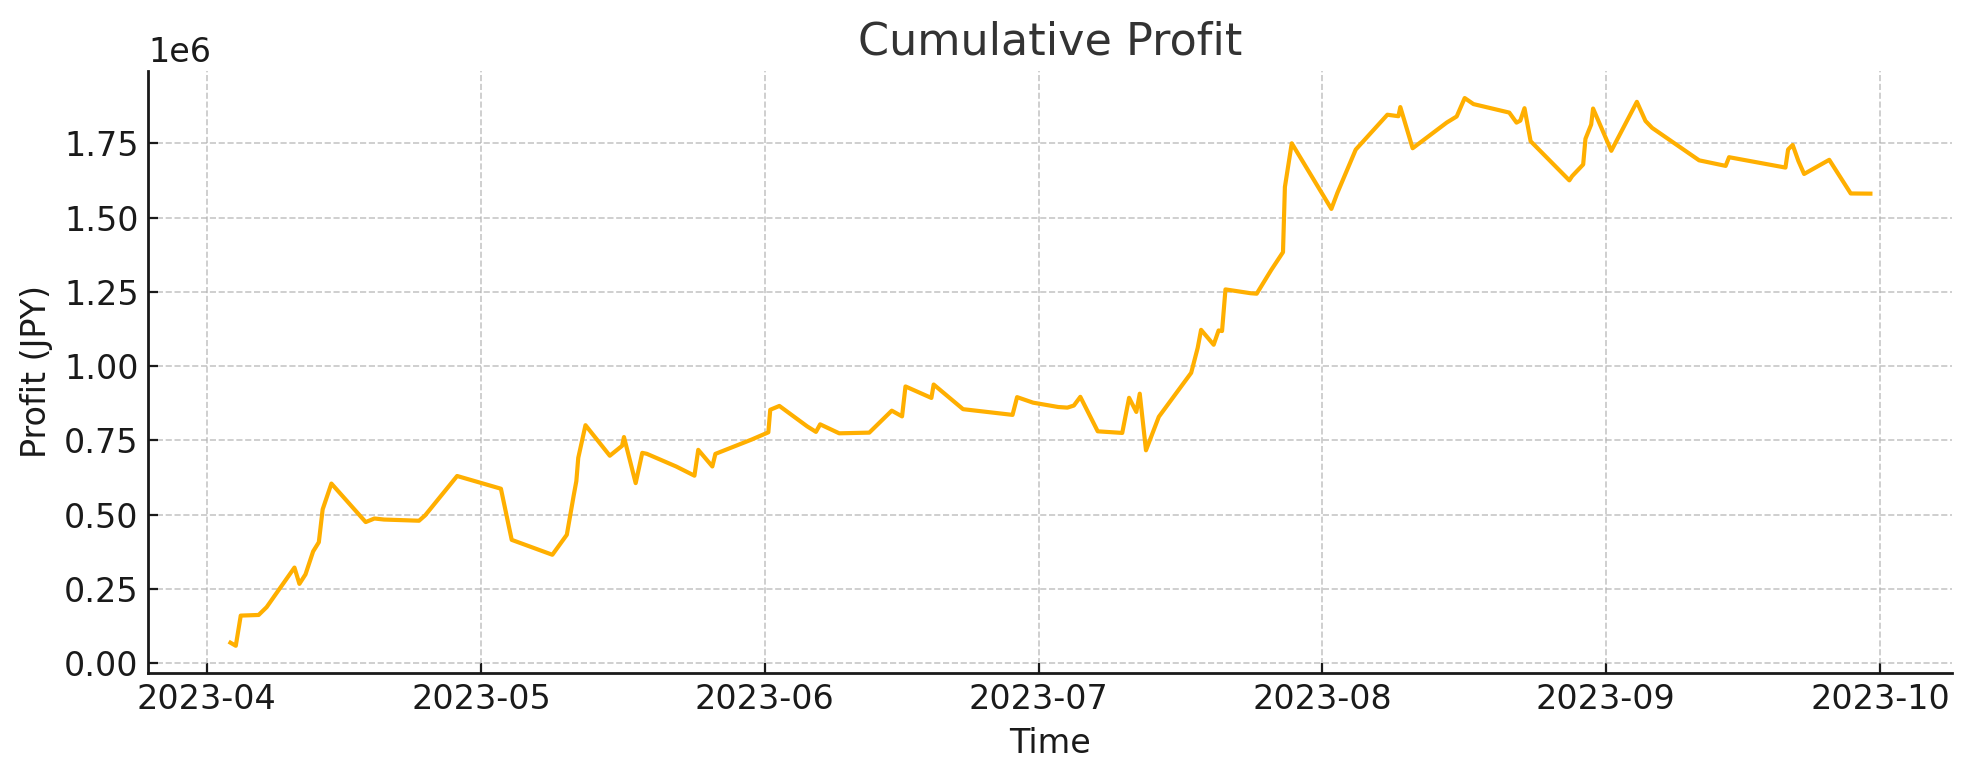
Cumulative profit trends upward, indicating an overall favorable trend.
Trade-wise Profit
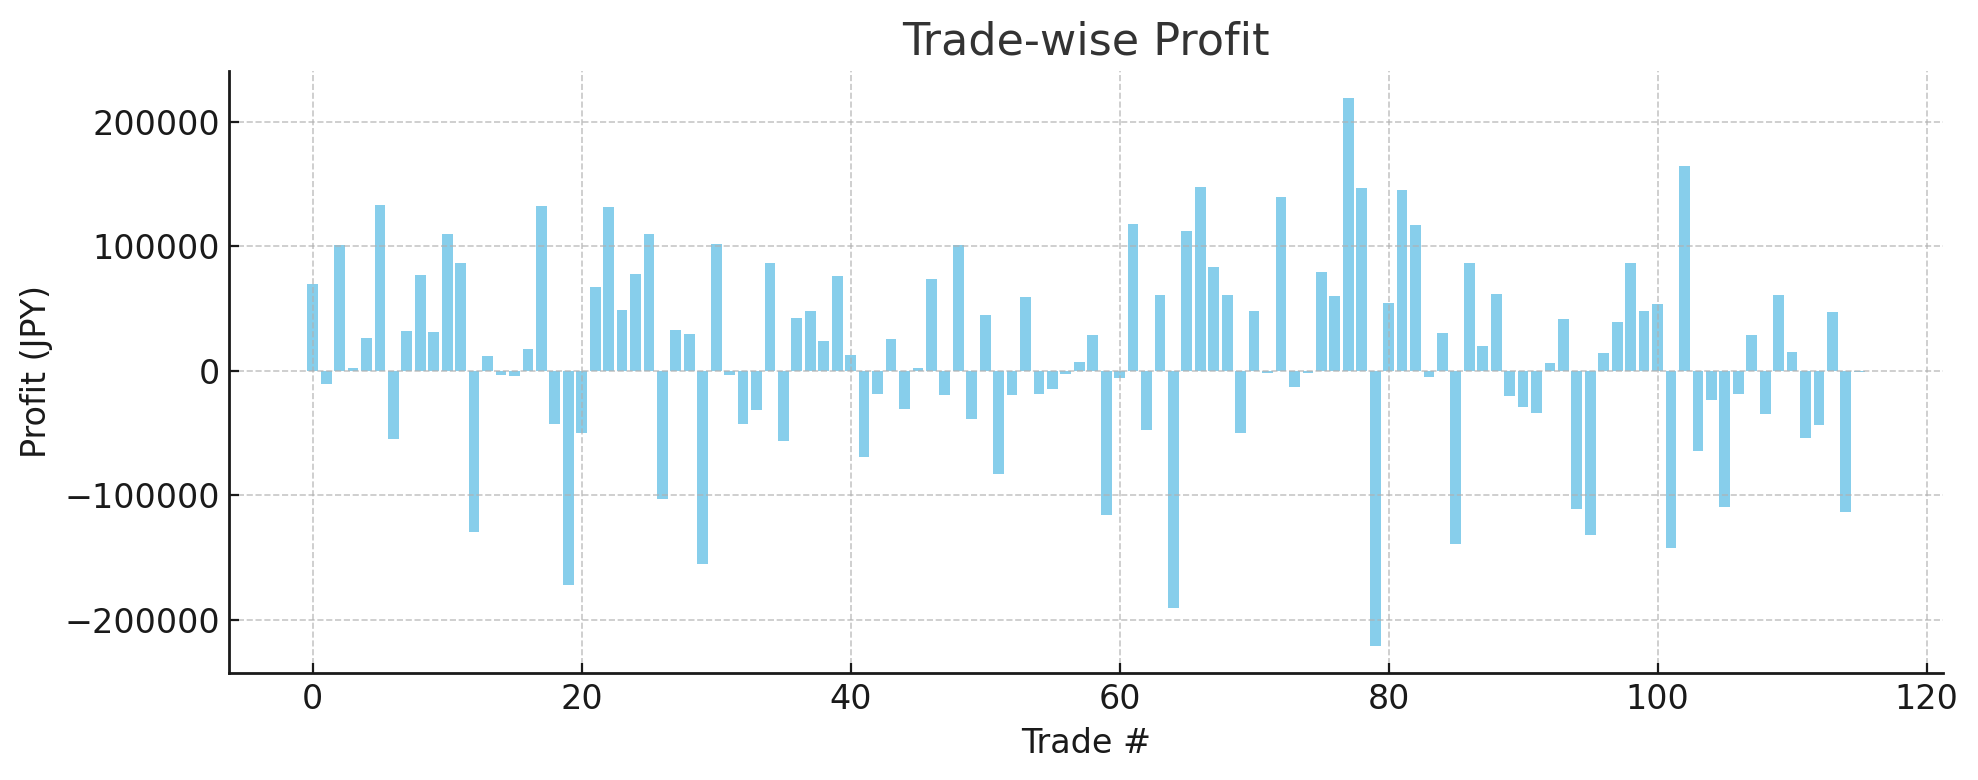
Individual trades show variability in gains and losses, but major losses are limited.
Profit Distribution
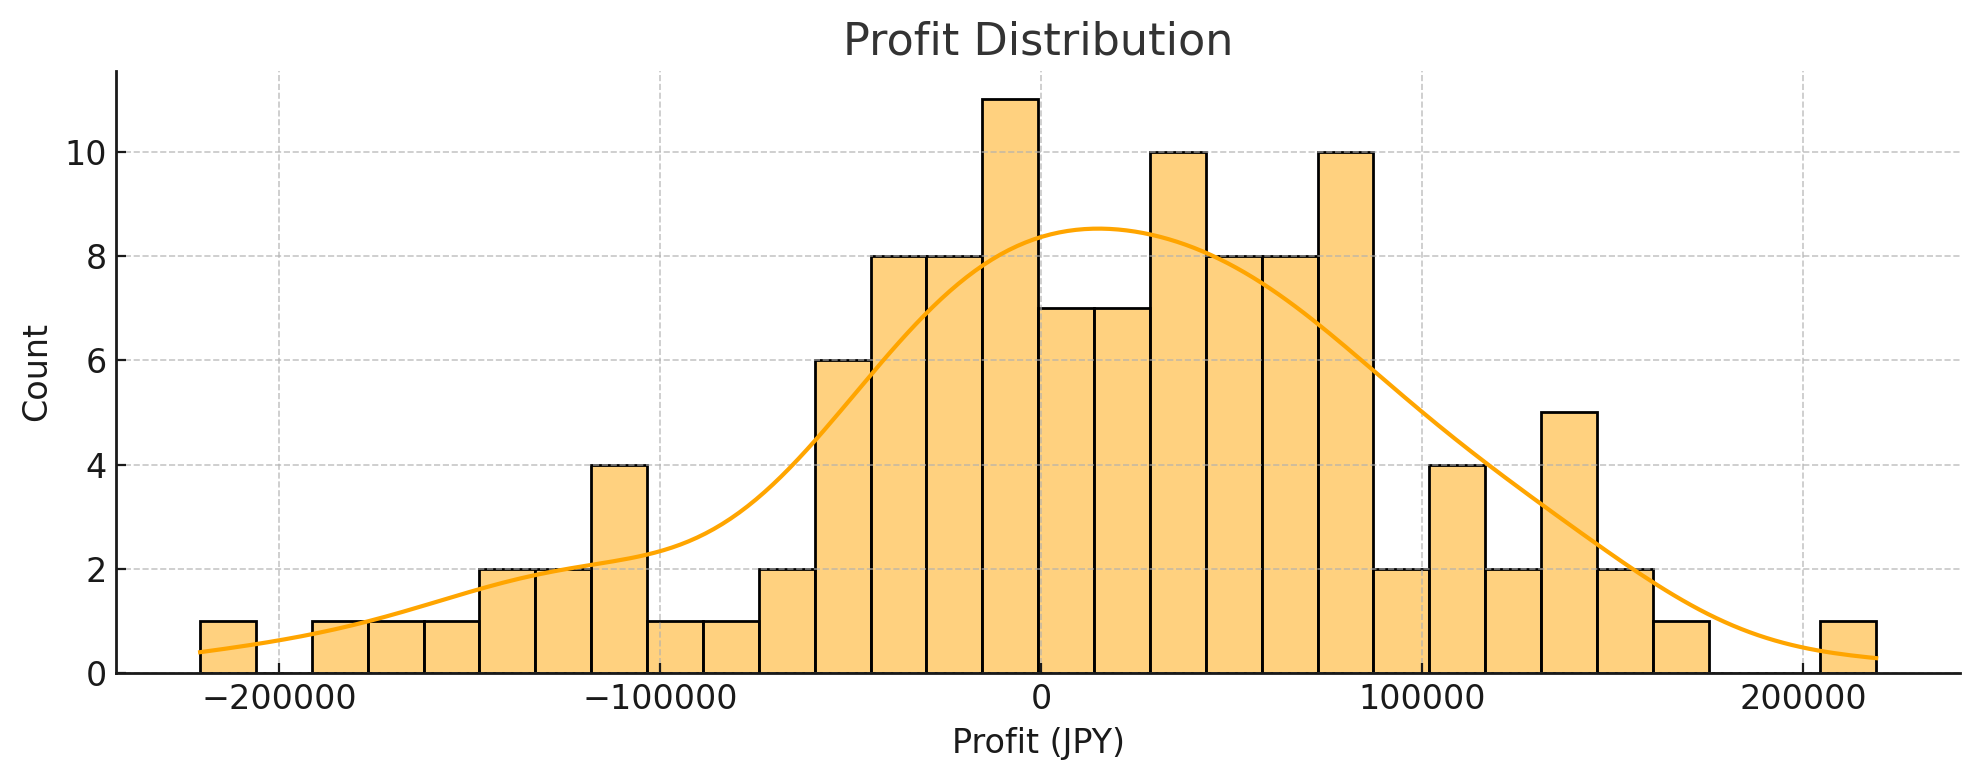
Distribution is slightly right-skewed, with a thicker tail on the profit side. The risk-reward balance is favorable.
Win/Loss Breakdown
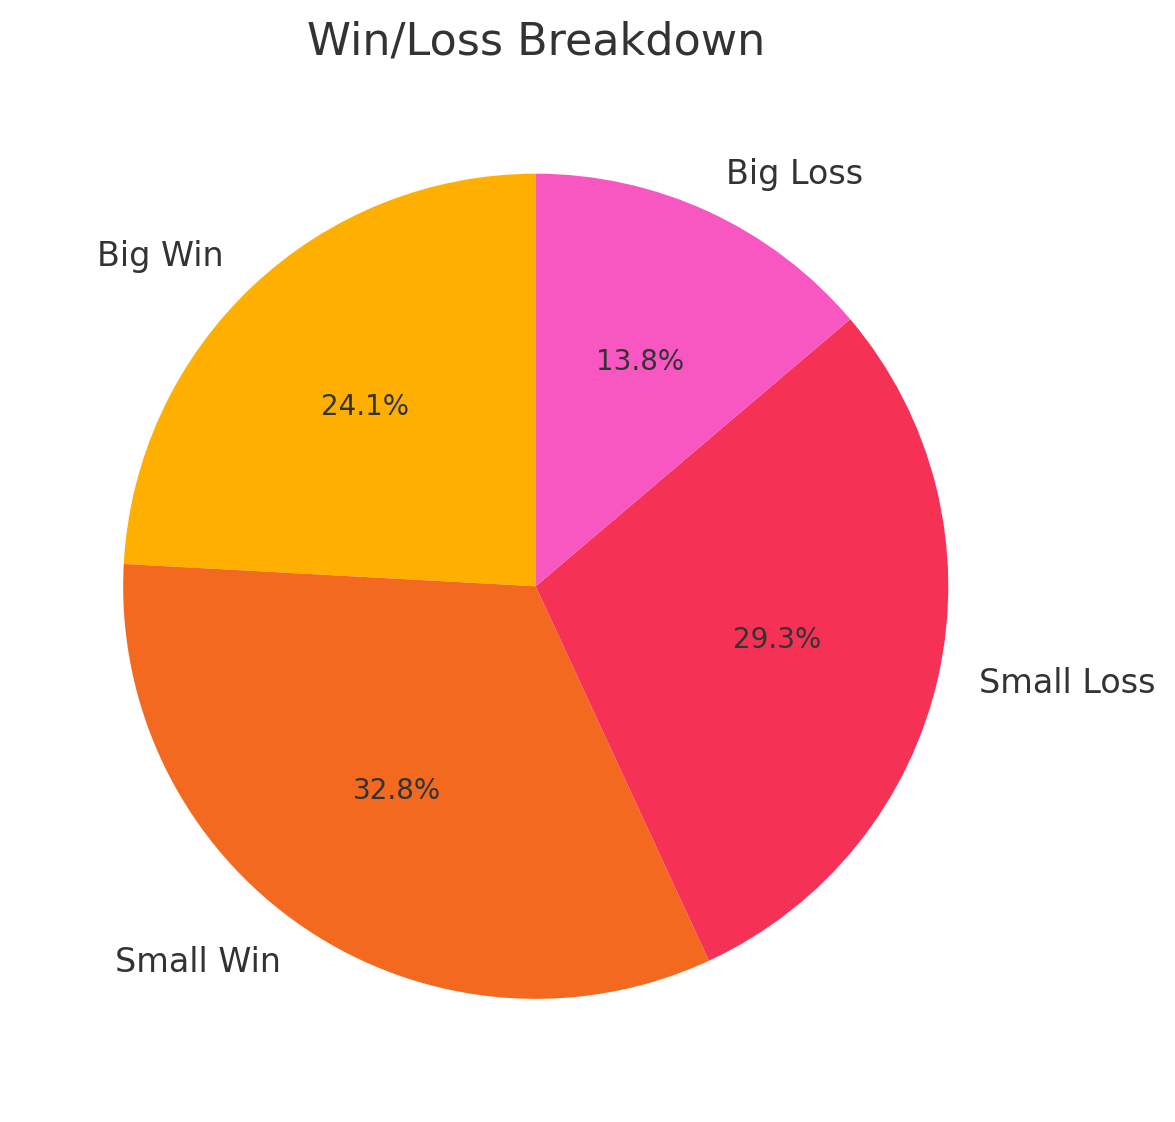
Small wins dominate, with few large losses, contributing to profit stability.
Max Drawdown per Trade
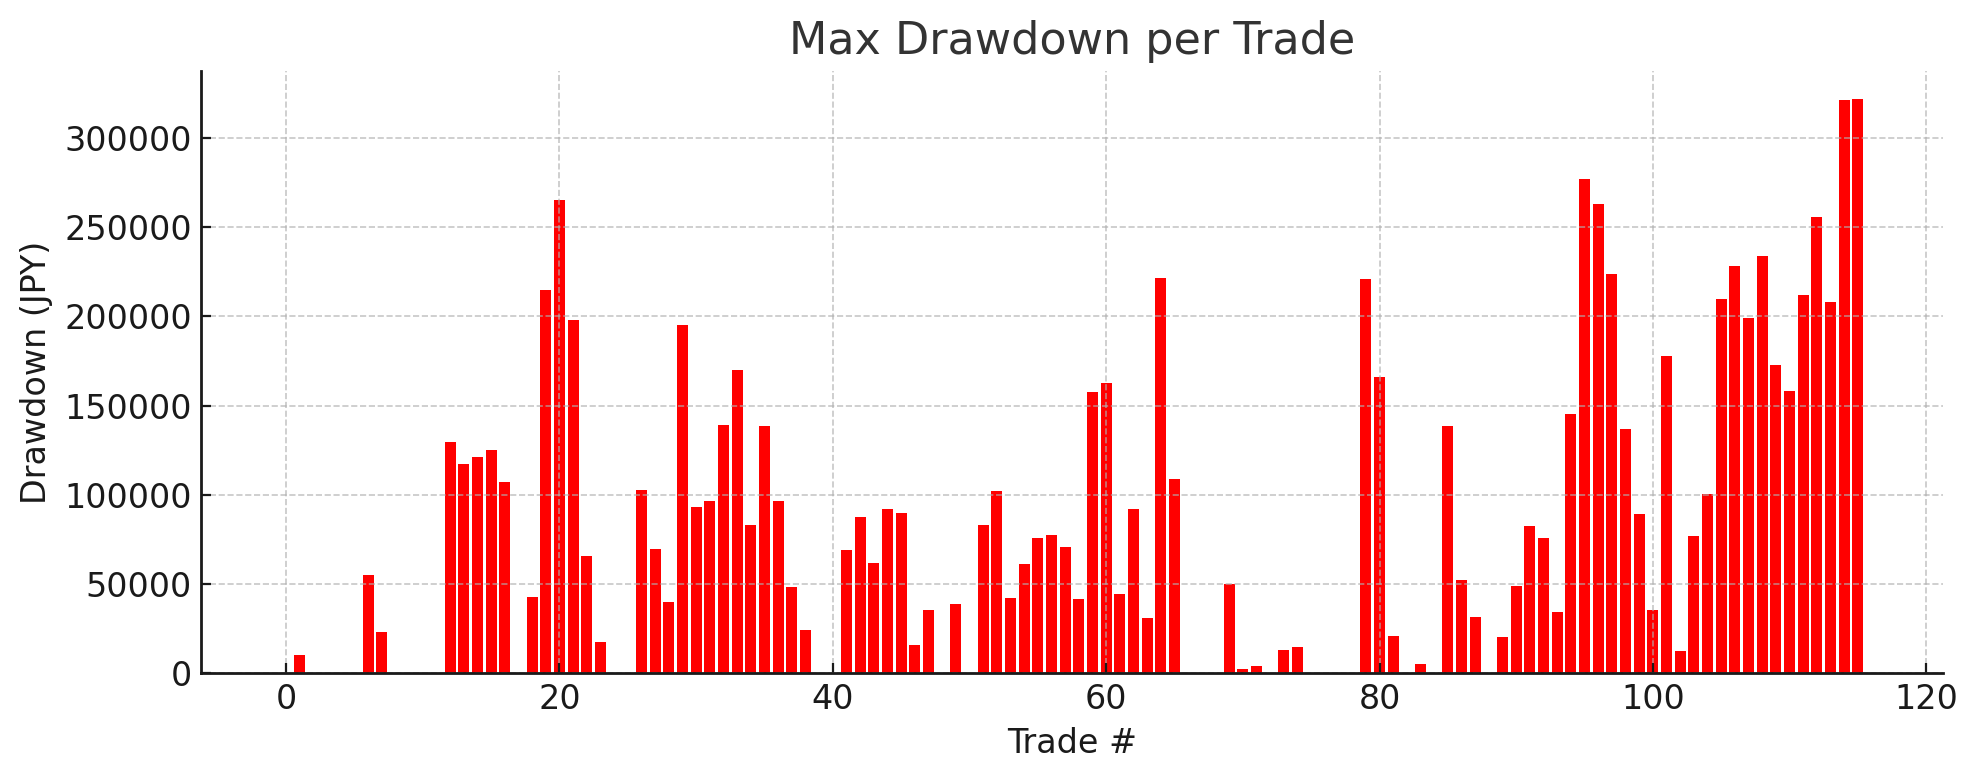
Drawdowns occur at regular intervals, yet recoveries are observed. Risk management is generally good.
Step 3: AI Judgment
| Evaluation Item | Score | Comment |
|---|---|---|
| Win-rate stability | B | Win rate shows consistent stability, but there is room for improvement. |
| Volatility adaptability | A | Can pursue larger profits while keeping losses in check. |
| Risk management | A | Profit factor is high and drawdowns are controlled. |
| Overall evaluation | A | A superior system with stability, adaptability, and risk management. |
Step 4: Issues and Improvement Proposals
| Issues | Content | Improvements |
|---|---|---|
| Slight fluctuations in win-rate stability | Overall win rate is above 50%, but stability is lacking, with potential capital decline from drawdowns. | Identify timings when win-rate declines and consider strengthening filters or logic. |
| Occurrence of maximum drawdown | Maximum drawdown is relatively large at -321,600 yen (-16.91%). | Dynamically suppress risk by introducing trailing stops and position size limits. |
| Profit/loss swing in some trades | Large winners and losers are mixed, causing high variance in expected value. | Maintain average risk-reward while avoiding extreme risk-reward ratios by adjusting strategy. |
Also, the results presented here are just one example.
Results can vary greatly depending on market conditions, signal settings, and period, so please view this as a reference.
Details page for One-Click FX Arrows