

Utilization of the “Visualization Indicator” (Part 210)
Use of the "Visualization Indicator" (its210)
1. Further evolve the "28 Currency Pair List Indicator" into an indicator
"8CPVisualization Indicator"to drawUSDCHF.
The "8CPVisualization Indicator" includesOceania version,London version,NewYork version,AnyCP version. This time, we used theNewYork version.
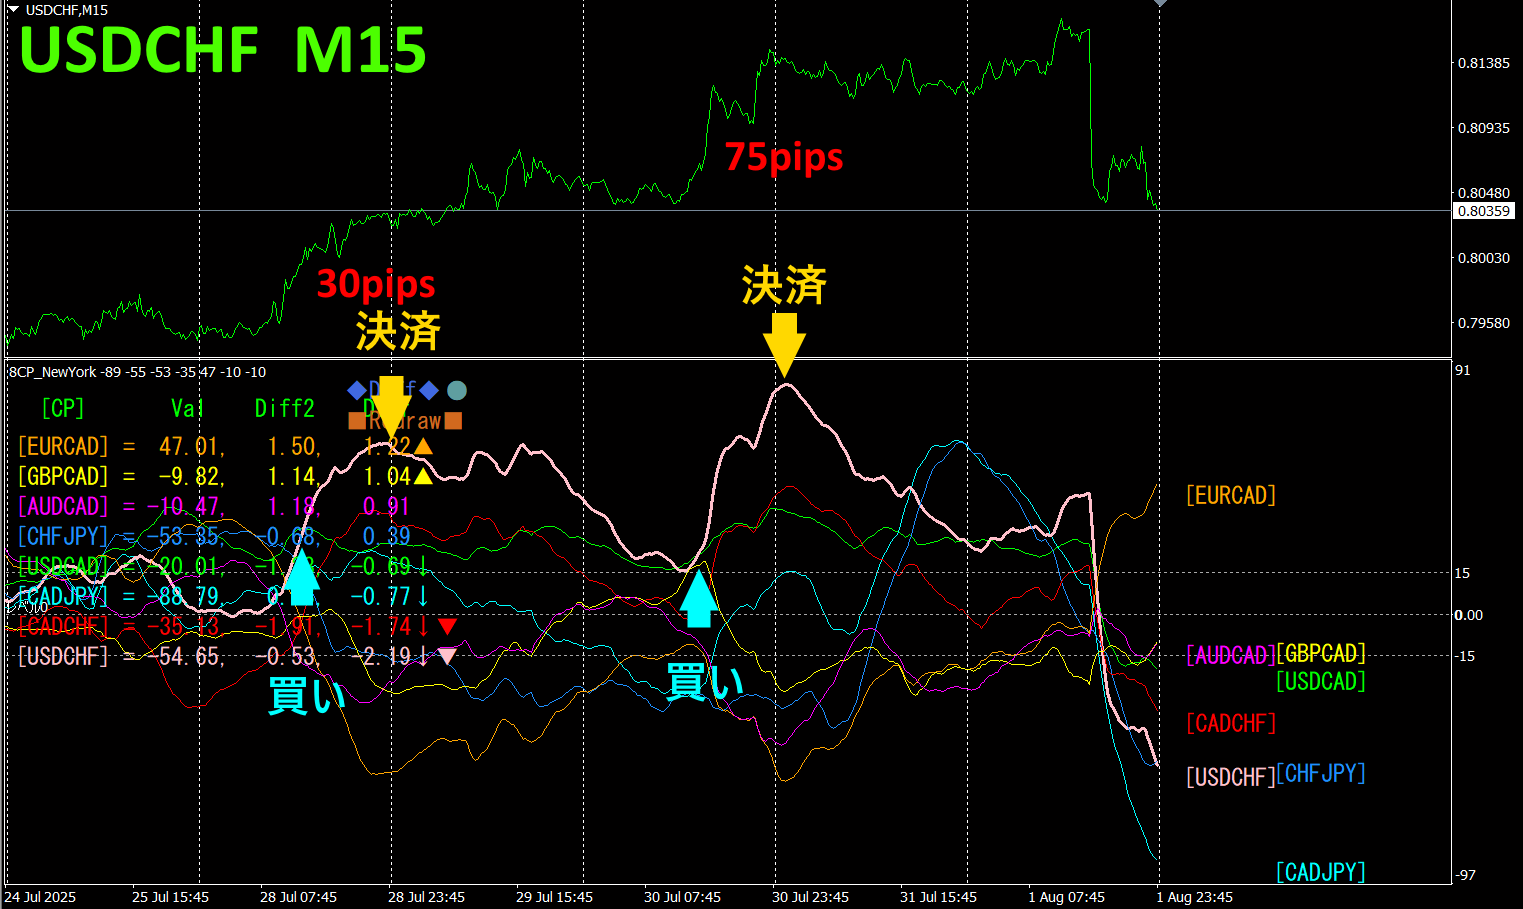
The top half is theUSDCHF 15-minute chart. The bottom half is from the “8CP Visualization Indicator”; the pink bold line graph corresponds toUSDCHF.
On Monday and Wednesday, the USDCHF graph rose above the other graphs, so we bought. We will close at the peak. Each roughly30pips and about75pips, for a total of about105pips profit.
Currency Strength Gap Graph
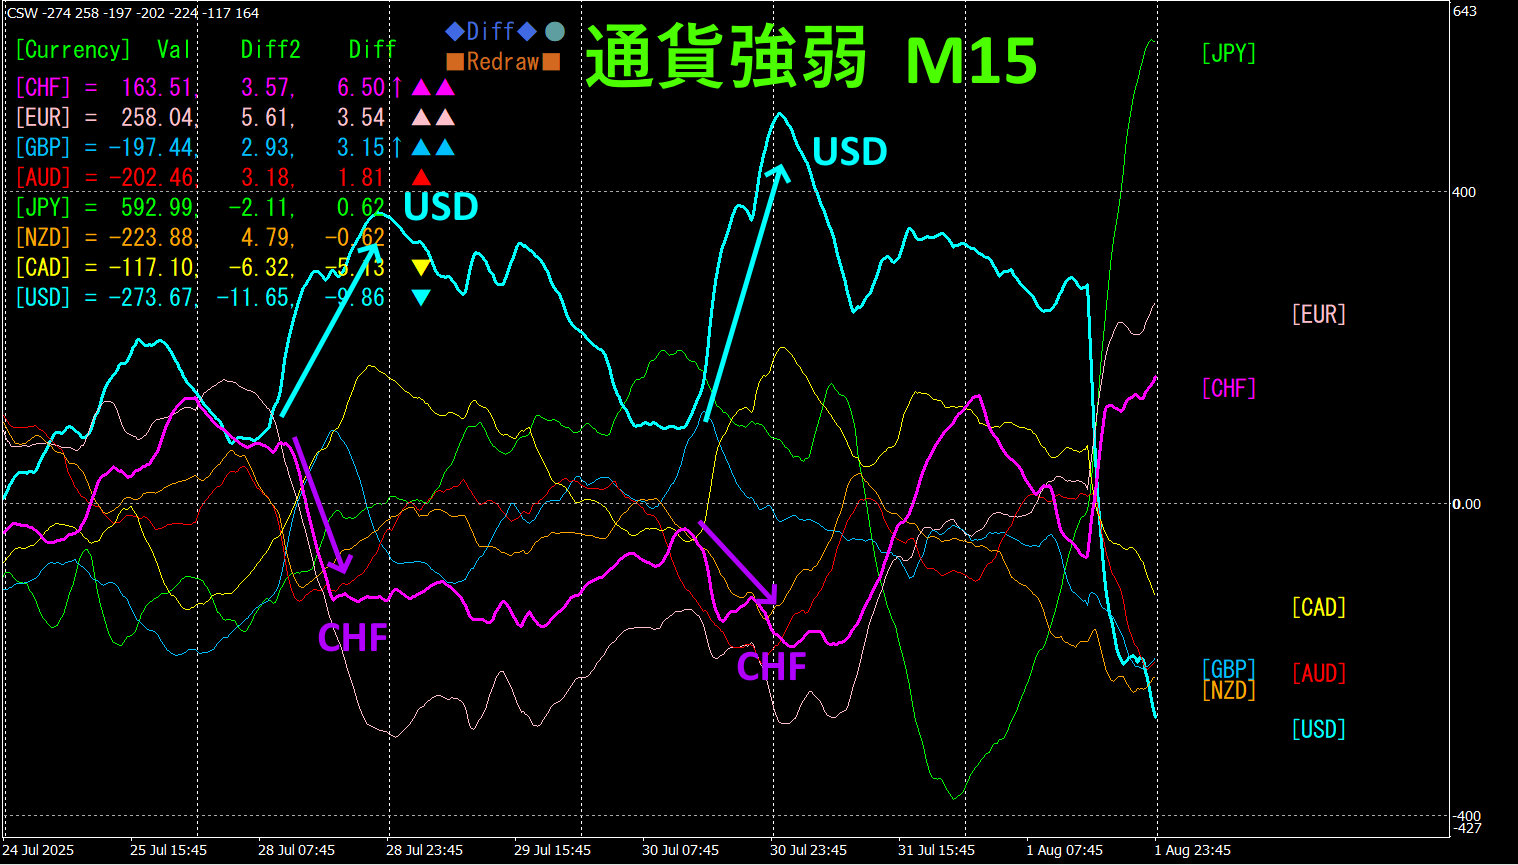
Looking at the 15-minute currency strength graph,USD andCHF show a remarkable inverse correlation. The currency pair that is currently growing the most and has an inverse correlation can be traded to naturally achieve results.
"Aim for currency strength inverse correlation!" isFX's iron rule.
If you use theTrendLine-EX, you can automate entry and exit when a trend line is broken diagonally. You can leave it as is, enabling easy trading. TheTrendLine-EX is a semi-automatic EA that can automatically sell when a trend line is broken downward and automatically close when a trend line is broken upward.
2. Best SelectTry the Indicator
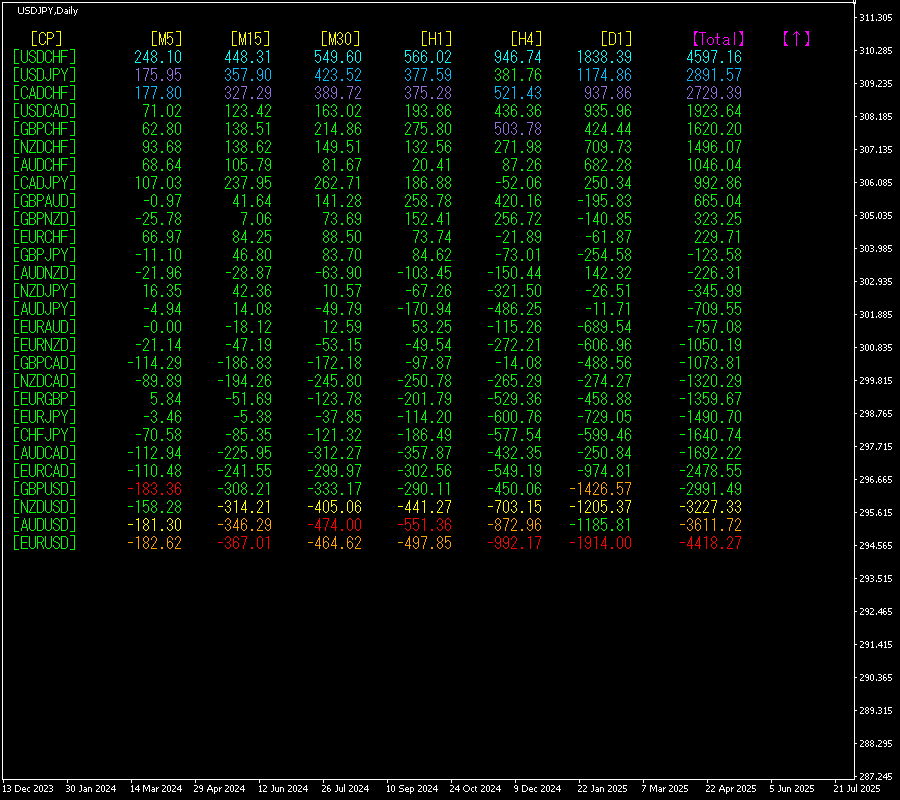
The figure below is a screenshot taken on2025 year7 month30 day22:22 (JST).
Total]Sequence is sorted in descending numerical order. The top currency,USDCHF, appears blue across all timeframes.Total value is +4597.16, a large positive figure.USDCHF shows a significant uptrend.
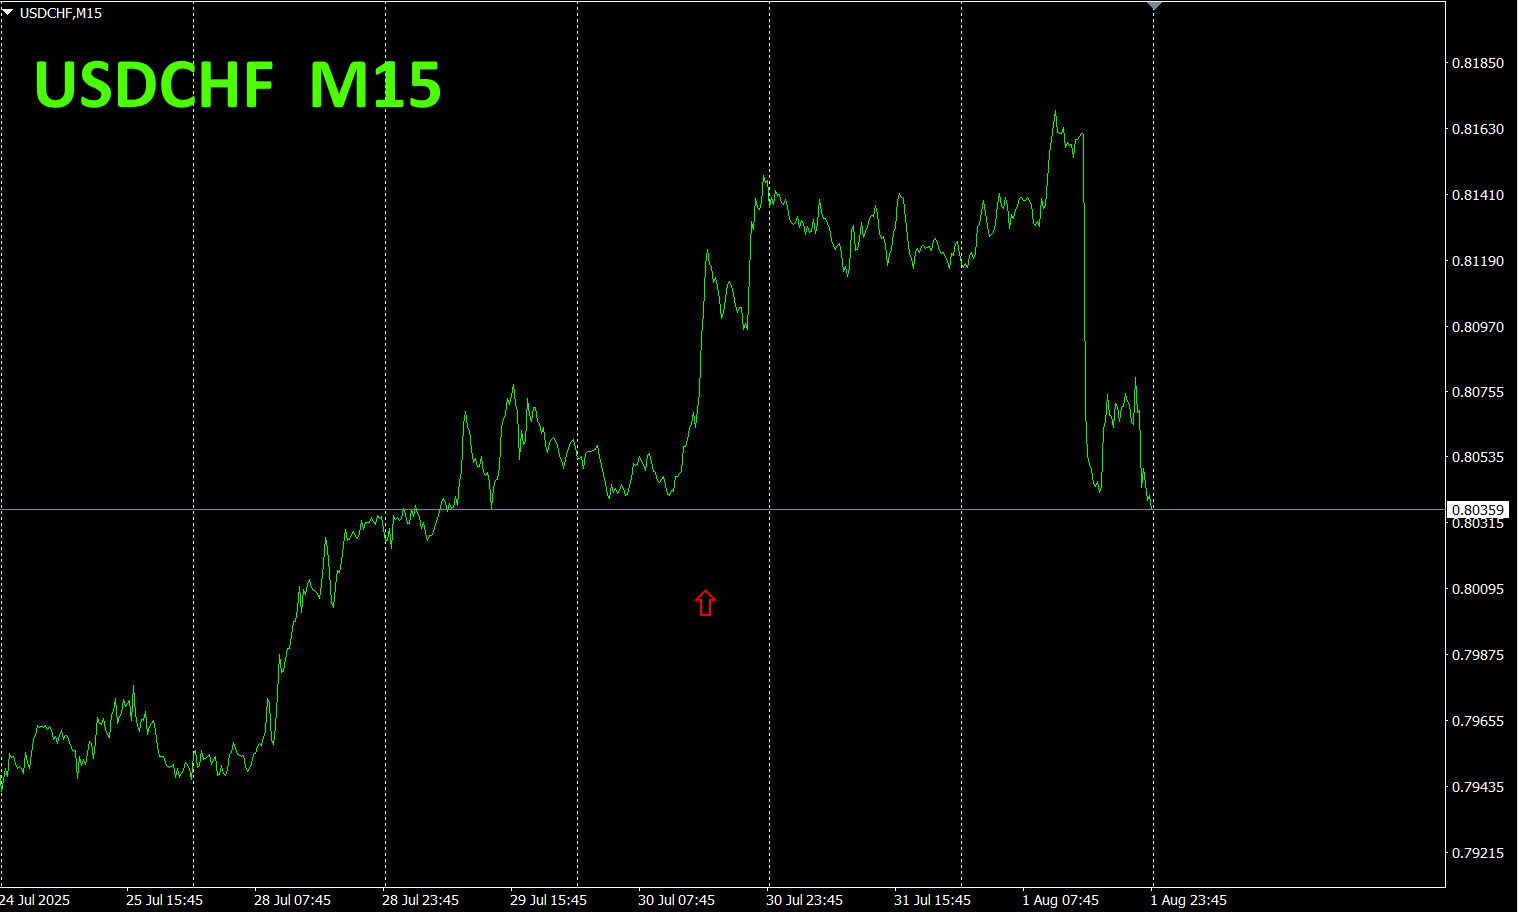
Next, let's look at the USDCHF chart.
The red arrows indicate the point at which the screenshot was captured. It corresponds to a steep rise in the middle of an uptrend.
The28 currency pairBest Select
The28 currency pairBest Select indicator
https://www.gogojungle.co.jp/tools/indicators/35128

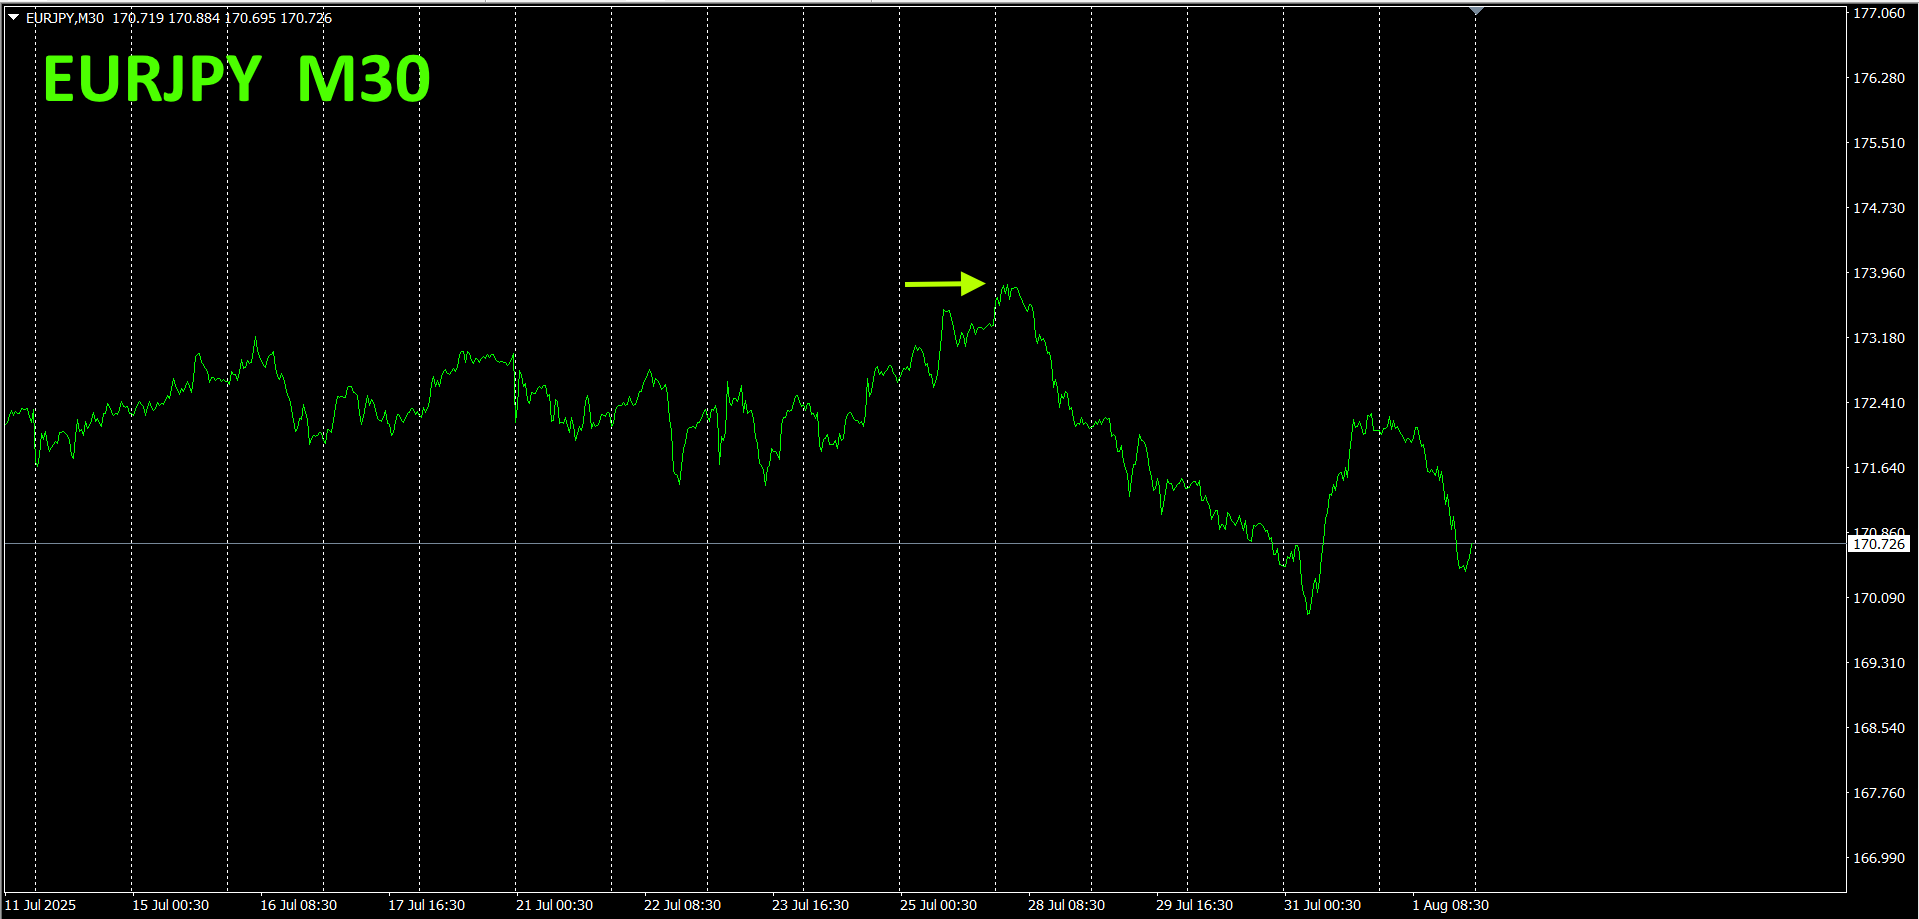
3. 2021 year5 month to dateEURJPY
In year month,EURJPY movements are being tracked.
To view the overall trend, we are plotting about30 weeks of the last minutes.
Previously, it was written as follows.
Pink indicatesEUR, green indicatesJPY. EUR andJPY
Going forward,EURJPY is expected to trade in a range for a while.
It seems to be dampened.
30 minutes currency strength chart.
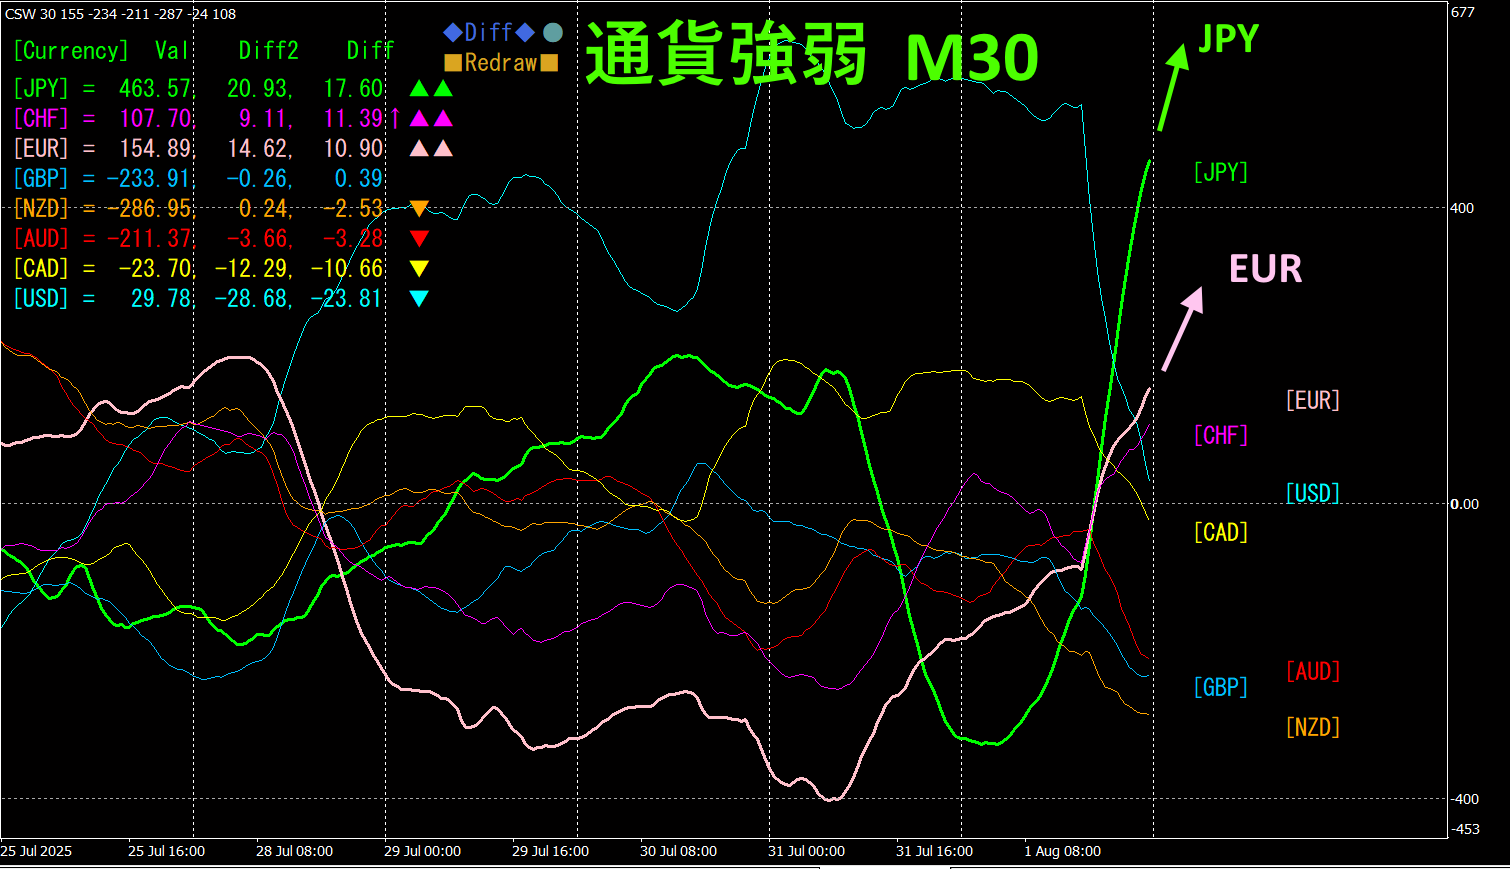
Pink indicatesEUR, green indicatesJPY. On the chart,EUR andJPY are both rising steeply. Since, EURJPY would head downward, but this weekend's movement was too rapid to read. For now, I will assume a downward direction.
4.
New Indicator "Dual_MACD_Trend_Indicator" please see below.
MT4 version:https://www.gogojungle.co.jp/tools/indicators/62199
An indicator that clearly shows the trend direction with colors. If the color bar is Lime, it's a buy; if Red, it's a sell. It is easy for beginners to use. If the bar color is green, it's an uptrend; red indicates a downtrend; no color means no trend. Because it is color-encoded, you can grasp the trend state at a glance.
I implemented this indicator on theUSDCHF 1-hour chart.
USDCHF shows an upward trend with an increasing slope, so when the indicator color turns green, buy, and when it turns red, exit, repeatedly. Until the rate breaks above the uptrend line, you simply repeat to gain profit.
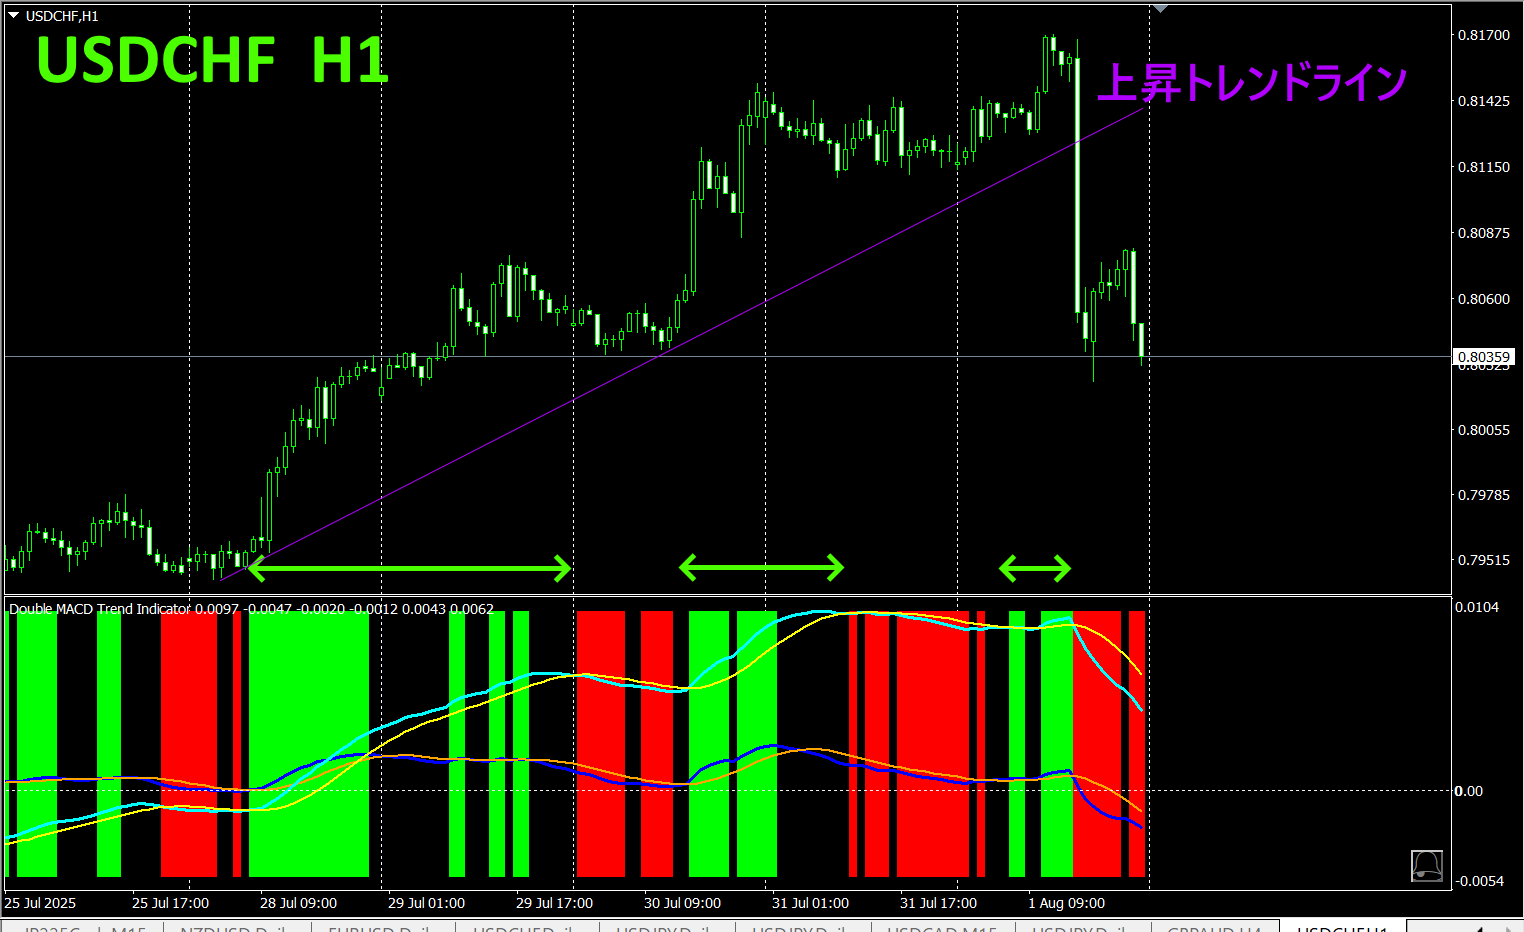
WithDual_MACD_Trend_Indicator, buy in green zones, sell in red zones, and do not trade otherwise—this is the simple rule.
UsingDual_MACD_Trend_Indicator eliminates any doubt about trade direction.
5.
"Hyper-CSW" has been released
“Hyper-CSW is a high-performance indicator that visually shows the strength of the major8 currencies at a glance. It records the strongest currency and score for the past10 timeframes on the displayed timeframe, and captures trend persistence and turning points accurately. Furthermore, it offers multi-timeframe analysis showing currency strength rankings (top44 currencies) across multiple timeframes such as
For details, please see the following link.
https://www.gogojungle.co.jp/tools/indicators/65082
※ Recommended indicators
"Toretore Indicator"
https://www.gogojungle.co.jp/tools/indicators/50115
“TrendLine-EX”


https://www.gogojungle.co.jp/tools/indicators/42257
“8C Currency Strength Visualization Indicator” please refer to the following page.

MT4 version https://www.gogojungle.co.jp/tools/indicators/39150
MT5 version https://www.gogojungle.co.jp/tools/indicators/39159
【My current listed products】


