
[EA Creation & Verification] How to Find a Competitive Advantage
Hello. This is 2pay.
Recently, a secret weapon (indicator) has been completed, so I will introduce the secret weapon and how to extract the points with an edge.
Having an edge in trading is extremely important for speculative trading.
Assuming RR1:1, even a small difference such as a loss rate of 49% and a win rate of 51% can increase assets simply because the winning rate is higher.
This is because repeatedly accumulating small wins can be explained mathematically by the law of large numbers.
One approach to finding points with an edge is to examine whether there is an edge at different times.
The method is very simple: on the backtest, every time a new bar appears, close the position and then take a new position again.
Fix the holding time to one bar. If the scale is H1, then at every hour 00 minutes you will close the position and open a new one.
Then at the end of testing, for each time, minute, week, month, business days, occurrence of Gotō dates, beginning and end of month, holidays, events, etc., aggregate the results and output results for Buy and Sell respectively.
I feel results would come out extremely fast if I used a python API, but I’m still studying and not handling it well, so I’m thinking of turning it into an indicator using MQL.
A rough explanation of how the indicator works is as follows:
① Read long-term four-price data from the past toward the present.
② When the specified entry time arrives, enter, and when the specified holding time elapses, close it (pseudo backtest).
③ After finishing one backtest bar, change the entry time and holding time and repeat step ②.
④ Output the results as a heatmap so you can visually confirm the distribution.
The variation of condition ③ is automated, and you test by brute force across all combinations like 0–23 hours × holding time in 1-hour steps.
The bar is M1 as the smallest, so even if you aggregate by day, you can test up to 1440 minutes × 1440 minutes = 2,073,600 combinations.
With a test period of about 15 years, each bar can be tested in about 10 seconds, so testing 2 million times would take about 240 days.
Since you need to change internal conditions and currencies many times, I plan to roughly map the distribution in 30-minute steps (48×48=2,304 combinations) and then examine only the good points in detail.
Reducing it this much makes it possible to thoroughly examine a whole currency in 3 days by varying dates and indicator conditions.
In addition, I will vary the spread by time and measure the effect of having an SL or not, so you can see the trend differences caused by its presence or absence.
Later I will EA it and run a regular backtest, so to minimize deviation from real tick data, I will push the verification phase from the outset.
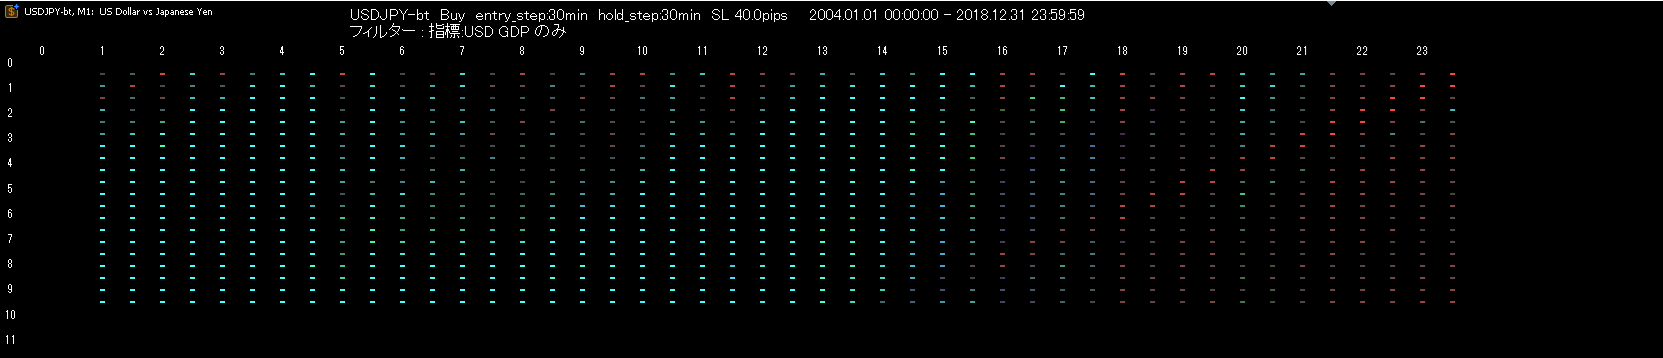
Below are the results of running the indicator.
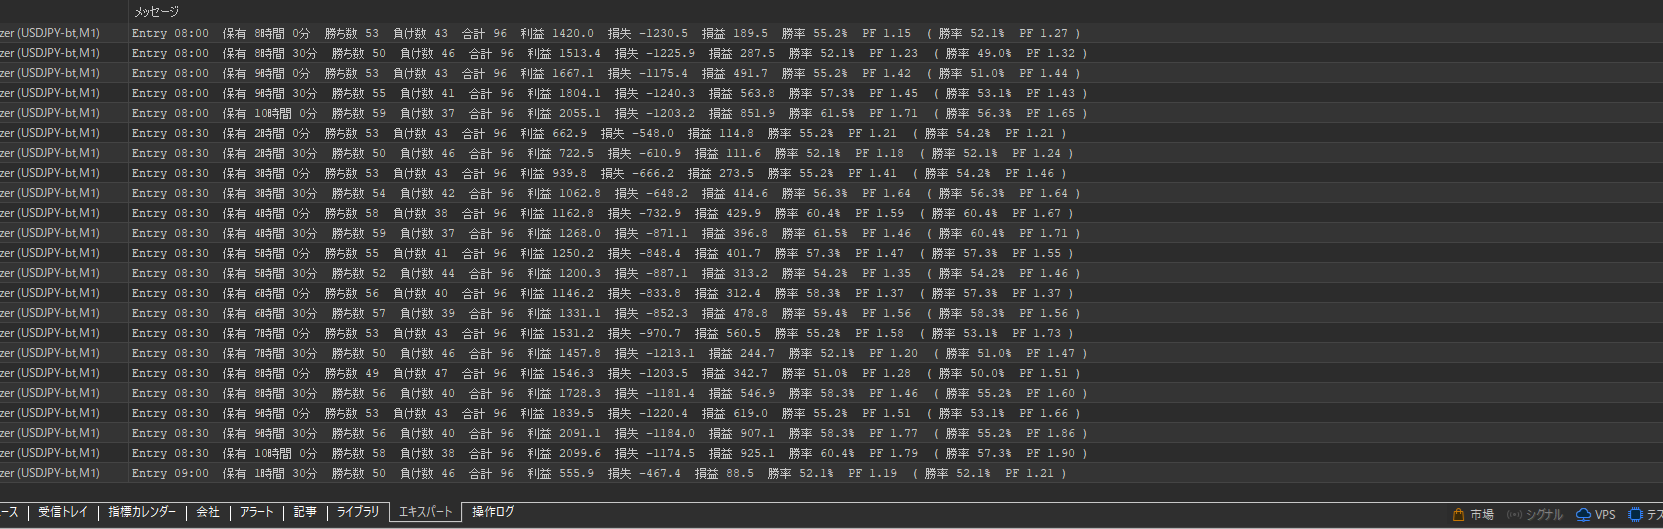
On the chart screen, the dots lined up neatly are each button objects; clicking them reveals detailed scores.
The horizontal axis is entry time (h), the vertical axis is holding time (h), and the data is obtained in 30-minute steps (the 0 o’clock hour is excluded from validation due to wide spreads).
Colors are shaded based on the PF; gray is the break-even point (=1.0), red indicates stronger losses, green indicates higher profits, and blue indicates higher profits when a stop-loss is in place.
Green and blue mix to light blue when both show favorable results.
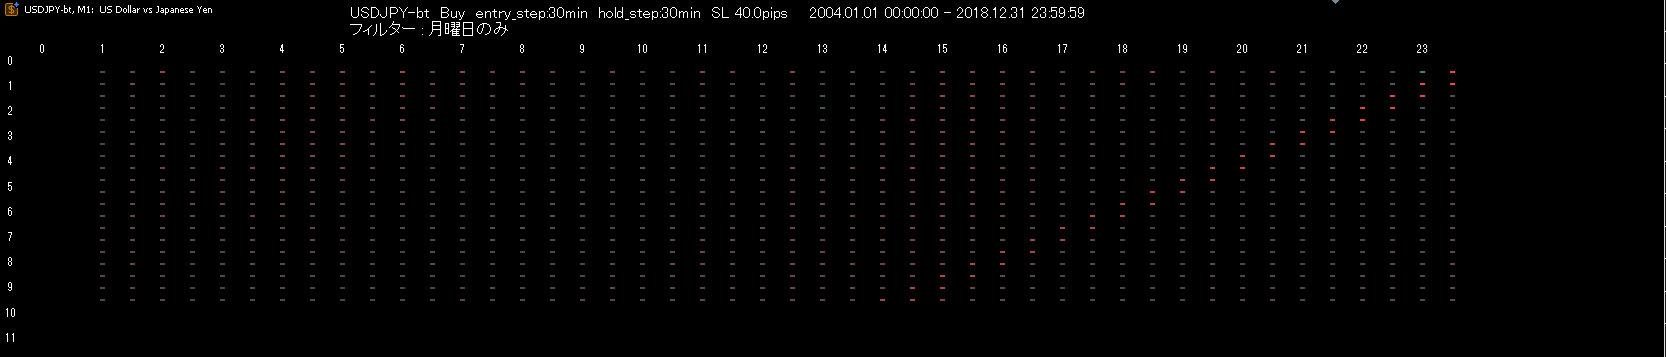
The condition below is "Monday only," and no remarkable edge is found. It is barely possible to gain profit if holding for 30 minutes from 23:00.
On the right, a red diagonal line runs, indicating red when the timing crosses into the wide-spread 0:00 hour.
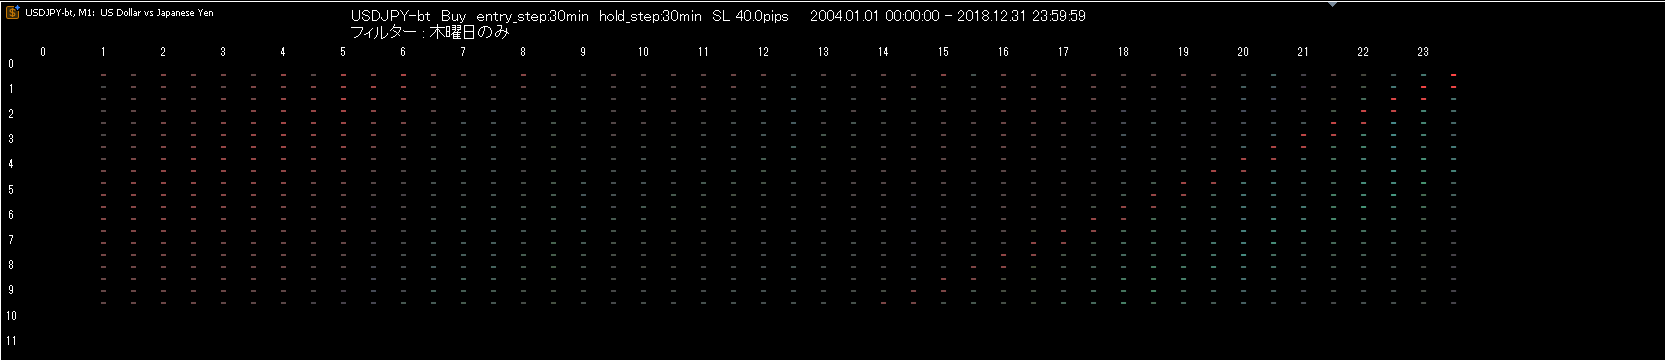
Similarly, we compare "Thursday only."
Compared to Monday, the light blue area expands, indicating more favorable results.
If the area below the red diagonal line (0:00 range) contains better results, it suggests winning on Friday.
This is due to Gotō dates; the edge concentrates on Fridays due to scheduling ahead, as shown by the weekday filter.
Also, the range with high edge (blue-tinted) is wide, indicating that many funds and many investors are paying attention.
Small, slight advantages like Monday 23:00 likely reflect hedges by hedge funds or individual investors closing positions for risk avoidance (or hedging), or other trading actions.
Depending on the magnitude of that edge, you may need to adjust the upper limit of the positions to be placed.
Along with heatmap output, I added a feature to log good results as well.
Set the indicator and just leave it; you will accumulate hundreds or thousands of favorable results.
From these, you can statistically determine significance (not random), select the truly outstanding ones, balance risk with portfolios, and pick ones that fit a trading schedule (when money is idle) as well.
In other words, you can freely choose and combine truly effective results that suit you best.
Even if a result is excellent but the trading frequency is low, bundling 10–20 such results should form a decent portfolio.
// ---
This time, I shared the topic of finding an edge.
This model is still quite simple, but quants funds analyze big data with this kind of procedure.
In the industry, they automate a series of steps by applying machine learning to weigh seasonality and environmental factors and integrate them into portfolios.
I cannot implement at that level, but I believe approaching professional methods leads to success.
Thank you for reading until the end.
// ---
Bonus
A filter limited to the U.S. GDP release date.
Compared with the weekday filter, it is overwhelmingly better (the range where light blue is dark exceeds PF2.0).
Indicator values differ by organization that publishes them, and the type of investors reacting also changes.
By detailing each item rather than lumping them together, market noise is reduced and cyclicality emerges.
Various types of investors trade in their respective cycles, and the effects of overlapping or non-overlapping timings accumulate to make the market appear random.
Sovereign and real-demand players act according to irregular calendar rules, so simple frequency analysis like Fourier transforms does not reveal a clear edge.
// ---
Bonus 2
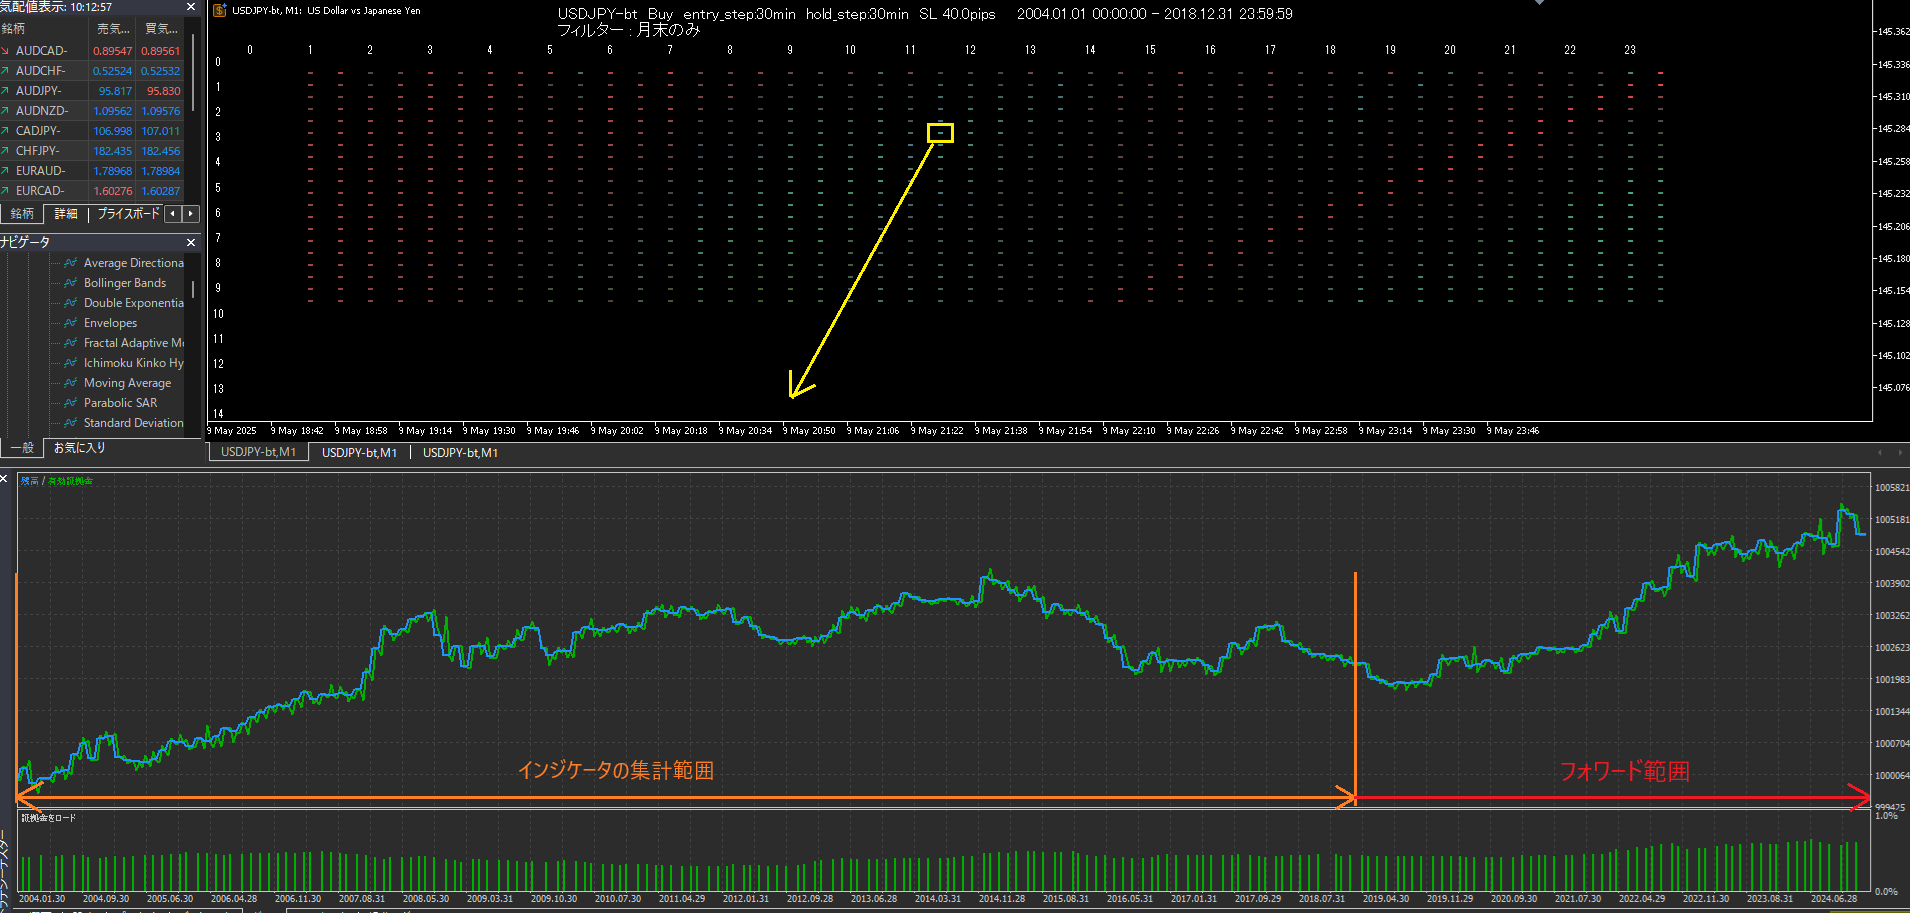
A filter limited to month-end.
There is a selling tendency during Tokyo time and a buying tendency during European time.
I want to check the roughness of the equity curve, so I will create one EA and run backtests.
The indicator is deliberately not aggregated to the very end, leaving the remaining period as a forward period.
There are down periods from 2015 to 2021, but overall it shows an increase.
At this analysis stage, it is enough that there is a trend (edge recognized).
In short, this time period has a tendency to rise, so not entering short positions, buying on pullbacks, and buying when the indicator's GC signal appears will tend to align well.