

July 28, 2025 (Mon) EURUSD +about 11 pips, EURUSD +about 12 pips, USDJPY +about 12 pips
This is my first post.
This is Systra10.
Today I traded using the hedging tool I am selling, so I will post the trade results.
I will not describe anything that touches the logic of hedging, but I plan to include the initial entry, approximate exit points, and pips.
The rationale for entries may be weak, but I hope to show places where I am still winning.
Having endured countless losses that nearly made me faint in the past, I keep Buffett's rule of not losing in mind, and focus on trades aimed at steadily increasing assets day by day, even if not explosively profitable, even by as little as one yen per day.
That said, today I entered on EURUSD and USDJPY and exited successfully.
Today I closed at a profit without any issues, and although there was no scenario that would become hedged, it wasn’t a trade that particularly showcases the tool’s effectiveness, but it may still serve as a reference for whether this level is acceptable.
Generally, I target situations where the trend is indicated by five simple moving averages on the 1-hour chart.
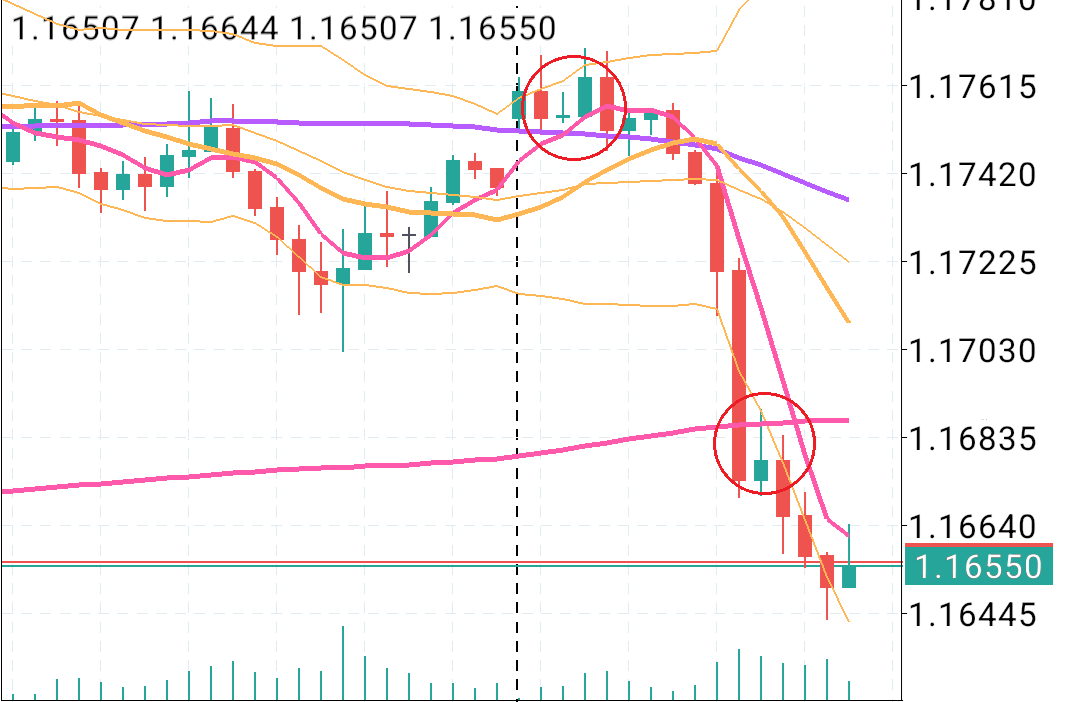
The figure below is a screenshot from Android MT4.
This is the EURUSD 1-hour chart, and I was aiming at the spot circled in red.
The first red circle is a morning trade, and at the start of the week when there isn’t usually a strong trend, I felt forced to trade. Honestly, I wouldn’t recommend it, but since I was aligned with the five moving averages, I managed to get a rebound.
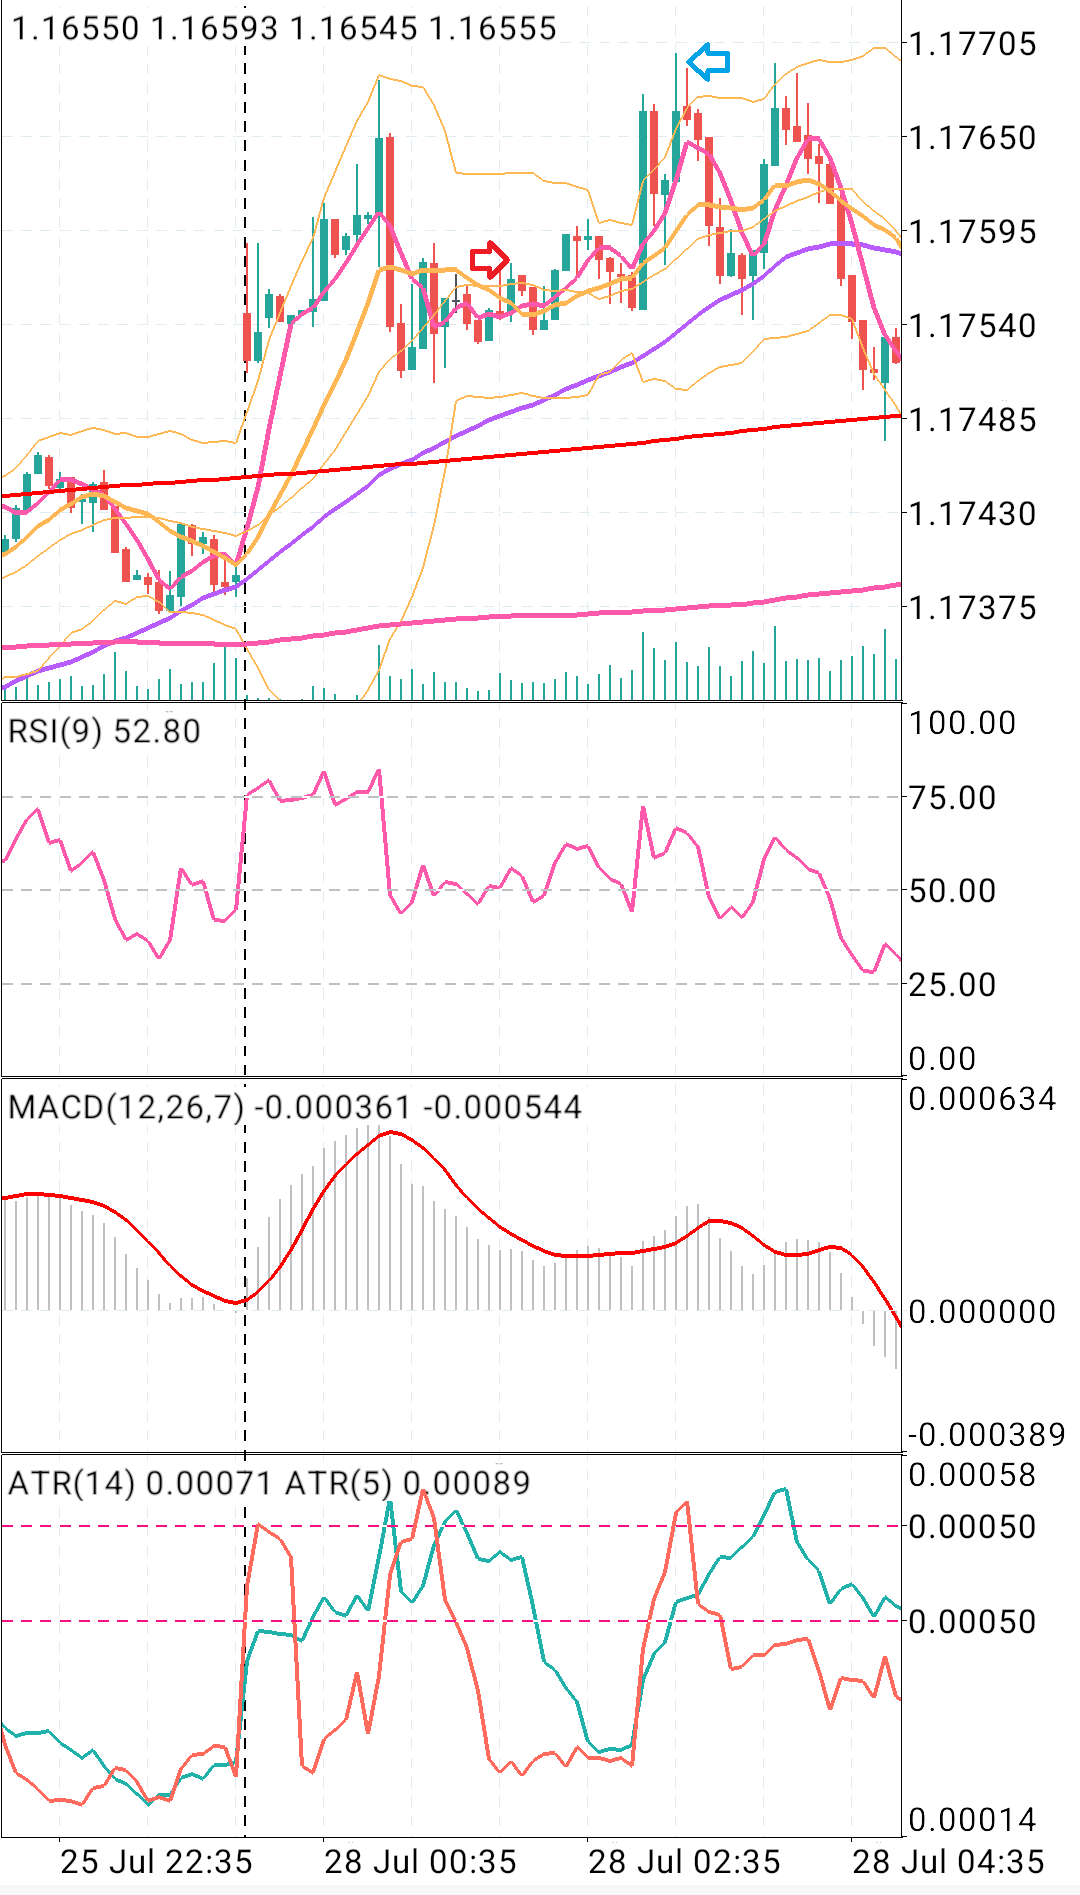
Please look at the next figure. It shows EURUSD on a 5-minute chart at the time of the first red circle mentioned above.
I entered with a buy indicated by the red arrow and exited with the blue arrow. The purple moving average line is the 50-period simple moving average, representing a line close to the five 1-hour simple moving averages. It has a certain slope and is in an uptrend, so around 8 a.m. I somewhat casually entered, but even now it isn’t a trade I’d praise too highly. I was glad to secure the profit smoothly.
Next, the following figure shows the second red circle on the 1-hour chart, a 5-minute chart scenario.