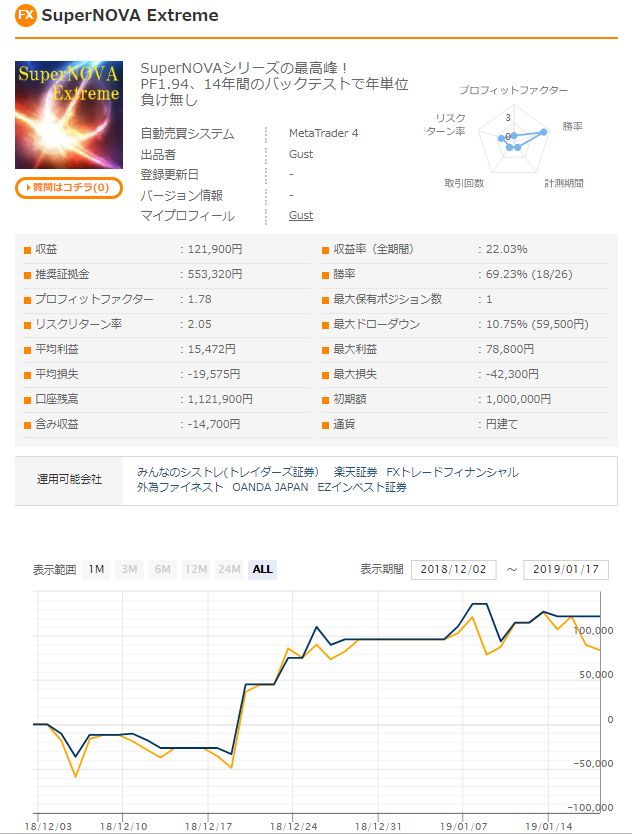
Investable from 100,000 yen, with an expected annual rate of return of over 50%, 'Super Nova Extreme'
【EA Overview】
Currency pair: [USD/JPY]
Trading style: [Day Trade][Scalping]
Maximum positions: 1
Maximum lots: 50
Used timeframe: M5
Maximum stop loss: 146 (will be closed by internal logic)
Take profit: 200 (profits taken by internal logic)
【Features】
〇USD/JPY 5-minute chart-only scalping and day-trading EA.
〇Monitors multiple timeframes to determine trend direction and timing, and enters on counter-trend.
〇Exits are based on a comprehensive analysis of several technical indicators to maximize profits and lock in gains.
〇Stops losses using internal logic to minimize losses.
〇Trading hours are 20:00–10:00 Japan Time.
〇No hedging, no averaging down or martingale logic used.
〇Being a single-position EA, money management is easier and beginner-friendly.
〇This EA automatically handles adjustments for GMT and daylight saving time, etc. It can operate without being affected by broker server times.
〇14 years of backtesting with a steadily rising equity and no annual losses.
【Backtest Analysis】
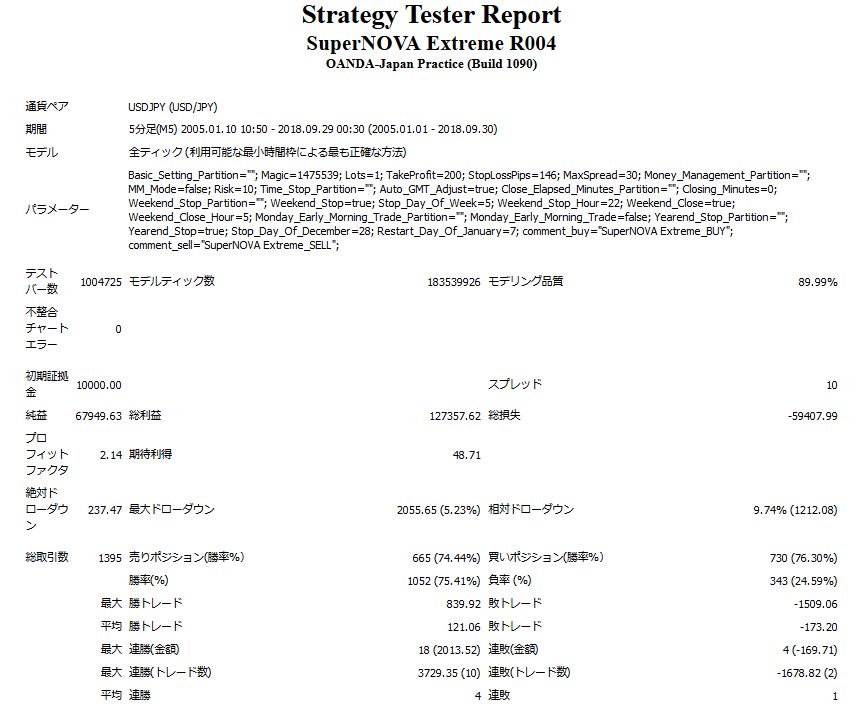
2005.01.01-2018.09.30 Spread 1.0Lot 1.0 (100,000 units) Net profit +$67,949 (annual average $5,350) Maximum drawdown -$2,055 Total trades 1,995 (annual average 157) Average win $121 Average loss -$173 Win rate 75%
This is how it turned out.
Since the lot is 1.0, using a 0.1-lot basis, the maximum drawdown is quite small at -$205.
■ About Recommended Margin
Recommended margin per 0.1 lot is,
(4.5)+(2.1*2)=8.7(万円)※1 USD = 110 JPY
This amounts to about 100,000 JPY, which should be safe to operate.
The expected annual return at a maximum drawdown of 50% is 67%.
Annual return of over 50%is achievable; a very excellent EA.
■ Monthly and Annual Profit/Loss
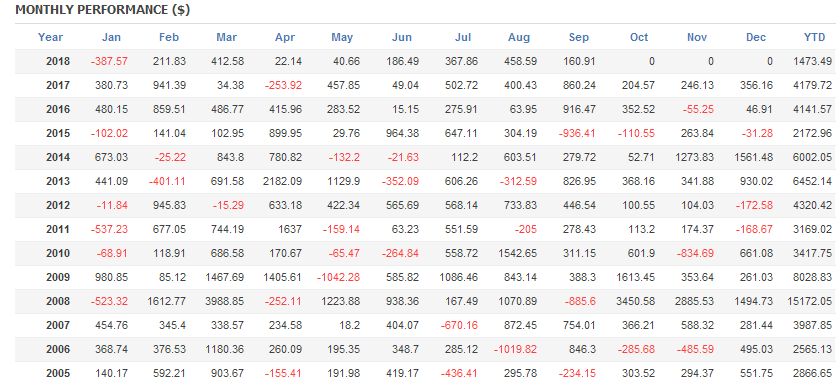
Even on a monthly basis, negative months are few.
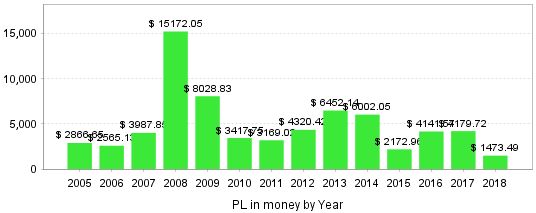
Looking at the yearly basis, profits in 2008 stand out, indicating strength during volatile market periods.
In the last five years, the average annual return has been around 20%.
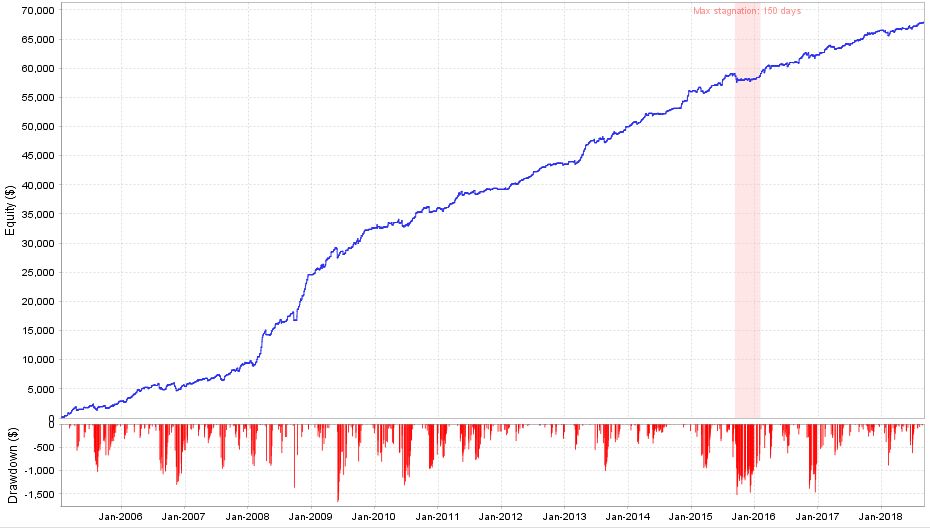
What I find remarkable in the backtest profit/loss chart is that in the past 13 years of backtesting, the stagnation period is short, and profits are continually updated. In the image, the "Max Stagnation" shows the longest duration from a drawdown to the next profit update, which at most is 150 days.
In other words, theoretically if operated for more than half a year, you will surely be in profit.
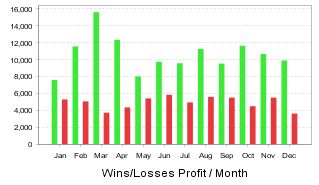
The monthly profit and loss graph is as shown! Profits are more than twice the losses, so as you trade more, profits accumulate.
【What kind of trading method is suitable?】
Trading frequency is about 10–13 trades per month, so by following the recommended lot size (0.1 lot per 87k–100k JPY margin)
we want to operate efficiently.
Also, since it performs well in strong trending markets, if building a portfolio, EA that performs well in range-bound markets or those with higher trading frequency would be good choices.
An EA designed for small losses and large gains, providing peace of mind!