

Utilization of "Visualization Indicators" (Part 209)
Use of the “Visualization Indicator” (its209)
1. Further develop the “28 Currency Pair List Indicator” into an indicator
“8CPVisualization Indicator”to drawGBPUSD.
There are versions of the “8 CP Visualization Indicator”: Oceania, London, NewYork, and AnyCP. This time, we used the London version.
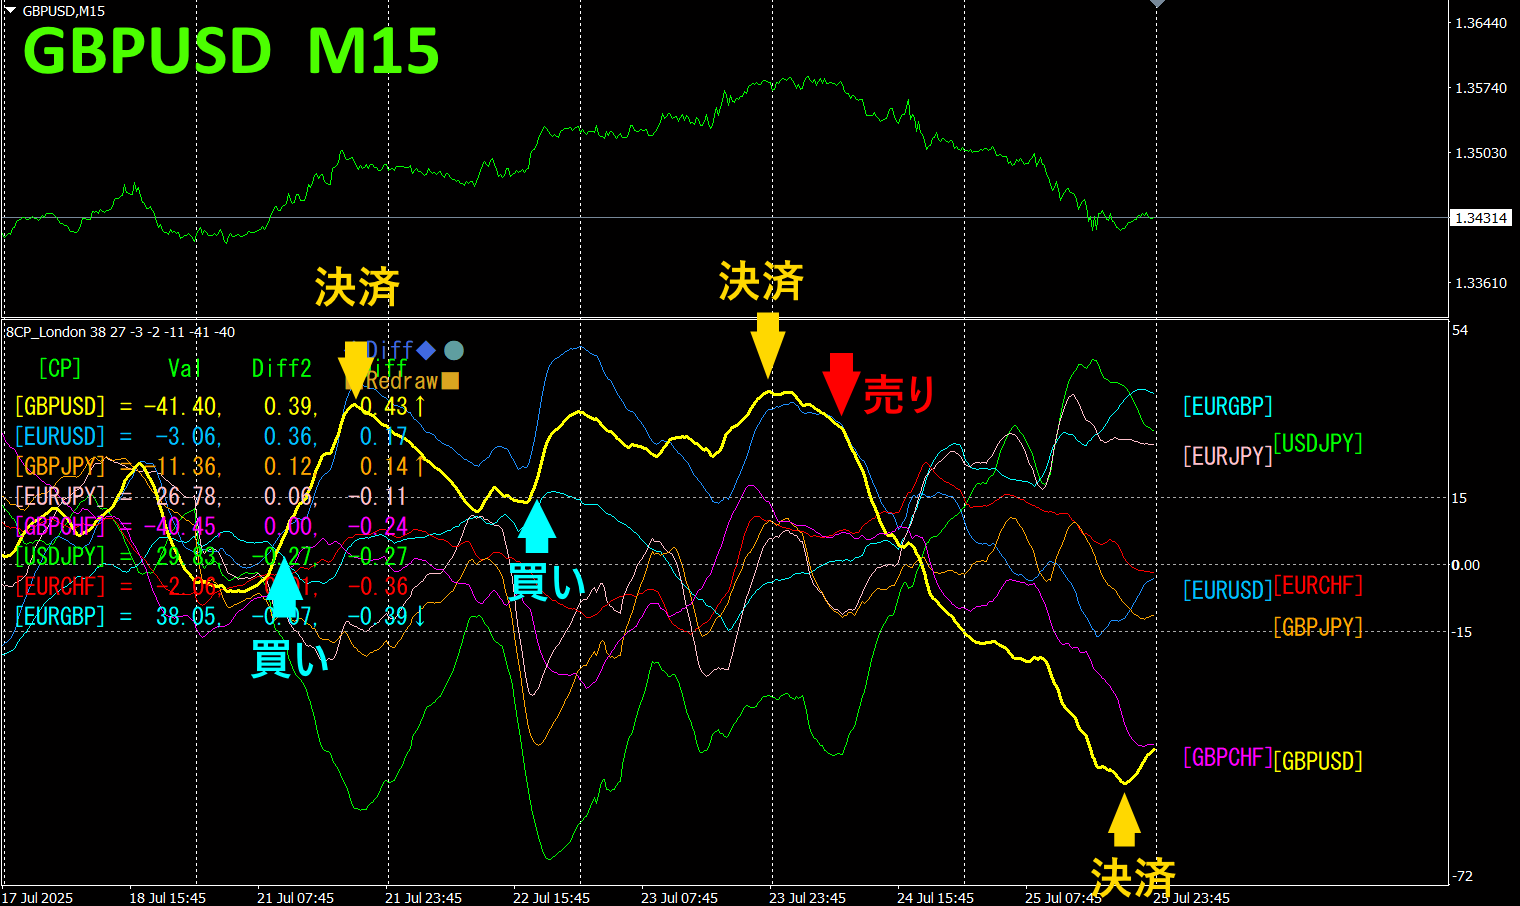
The top half is GBPUSD’s15-minute chart. The bottom half is from the “8 CP Visualization Indicator,” and the yellow bold line chart corresponds toGBPUSD.
On Monday, the GBPUSD chart broke above other charts, so I bought. I exited at the peak the same day, for about50 pips profit. On Tuesday, the chart formed a W bottom and rose, so I bought again. On Wednesday, I exited at the peak for about80 pips profit. On Thursday it began to fall, so I built a short position and held to Friday’s low for about150 pips profit. In three trades, total profit was about280 pips.
Currency Strength Graph
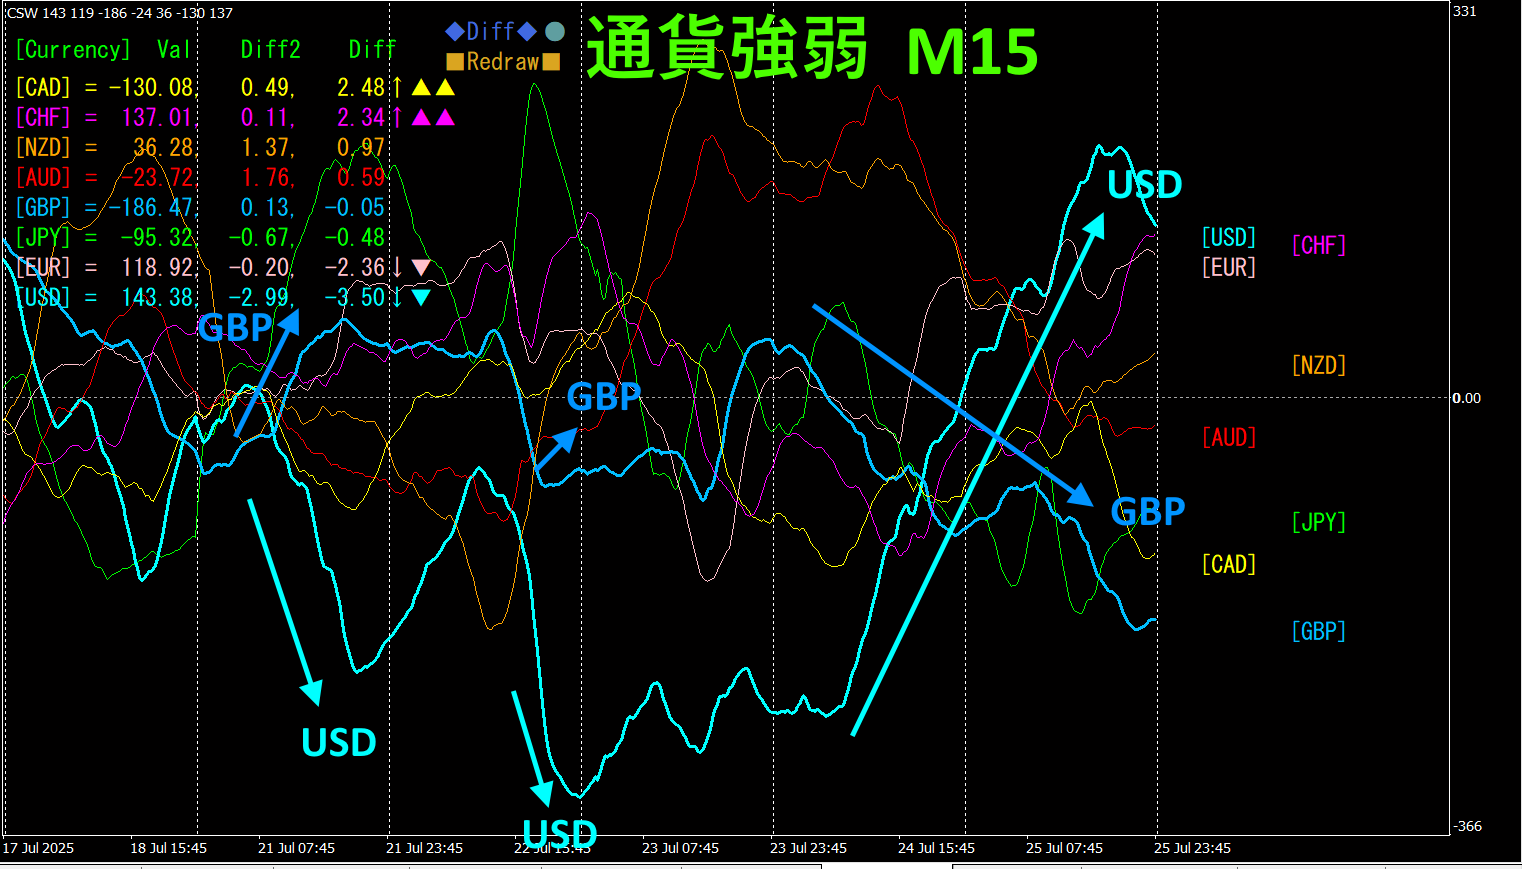
Looking at the 15-minute currency strength graph, GBP and USD show a remarkable inverse correlation. The currency pair currently rising the most in inverse correlation is the one to trade, and results will follow accordingly.
“Aim for currency strength inverse correlation!” is FX’s rule of thumb.
Using “TrendLine-EX” allows automatic entry and exit when a diagonal trendline is broken. You can leave it running as is for easy trading. “TrendLine-EX” is a semi-automatic EA that sells automatically when the trendline is broken below and exits automatically when the trendline is broken above.
2. Best SelectTry the indicator
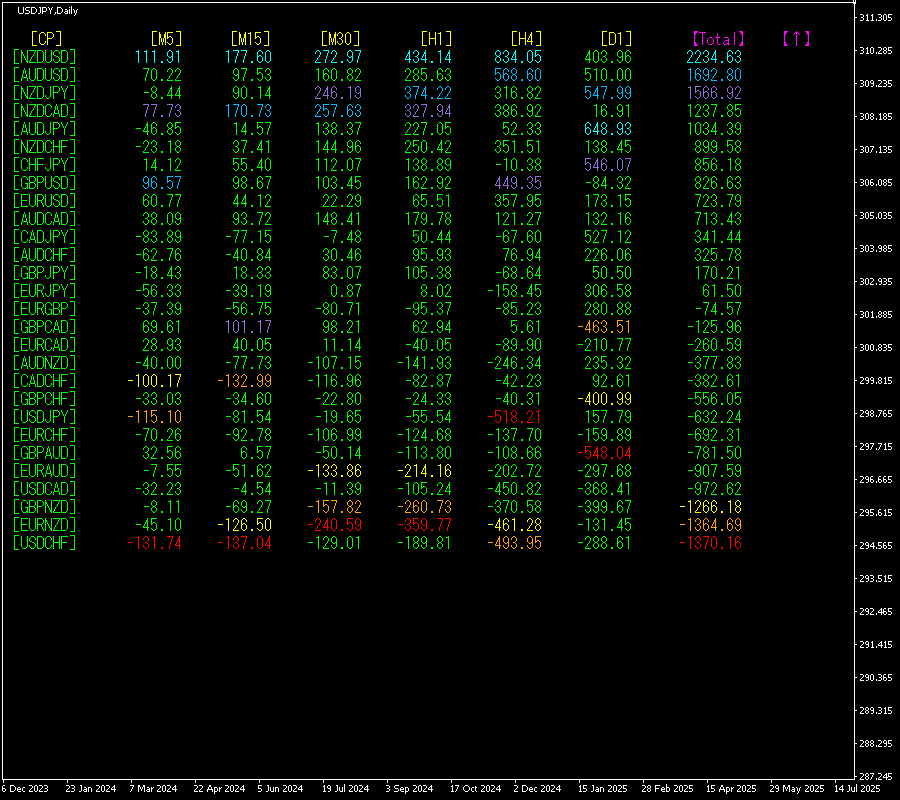
The figure below is a screenshot taken on2025 year7 month23 day 16:22 (JST).
Total]Sort by descending values. The top one,NZDUSD, shows blue on all timeframes except [D1].Total value is +2234.63, a large positive figure. It shows an upward trend forAUDJPY.
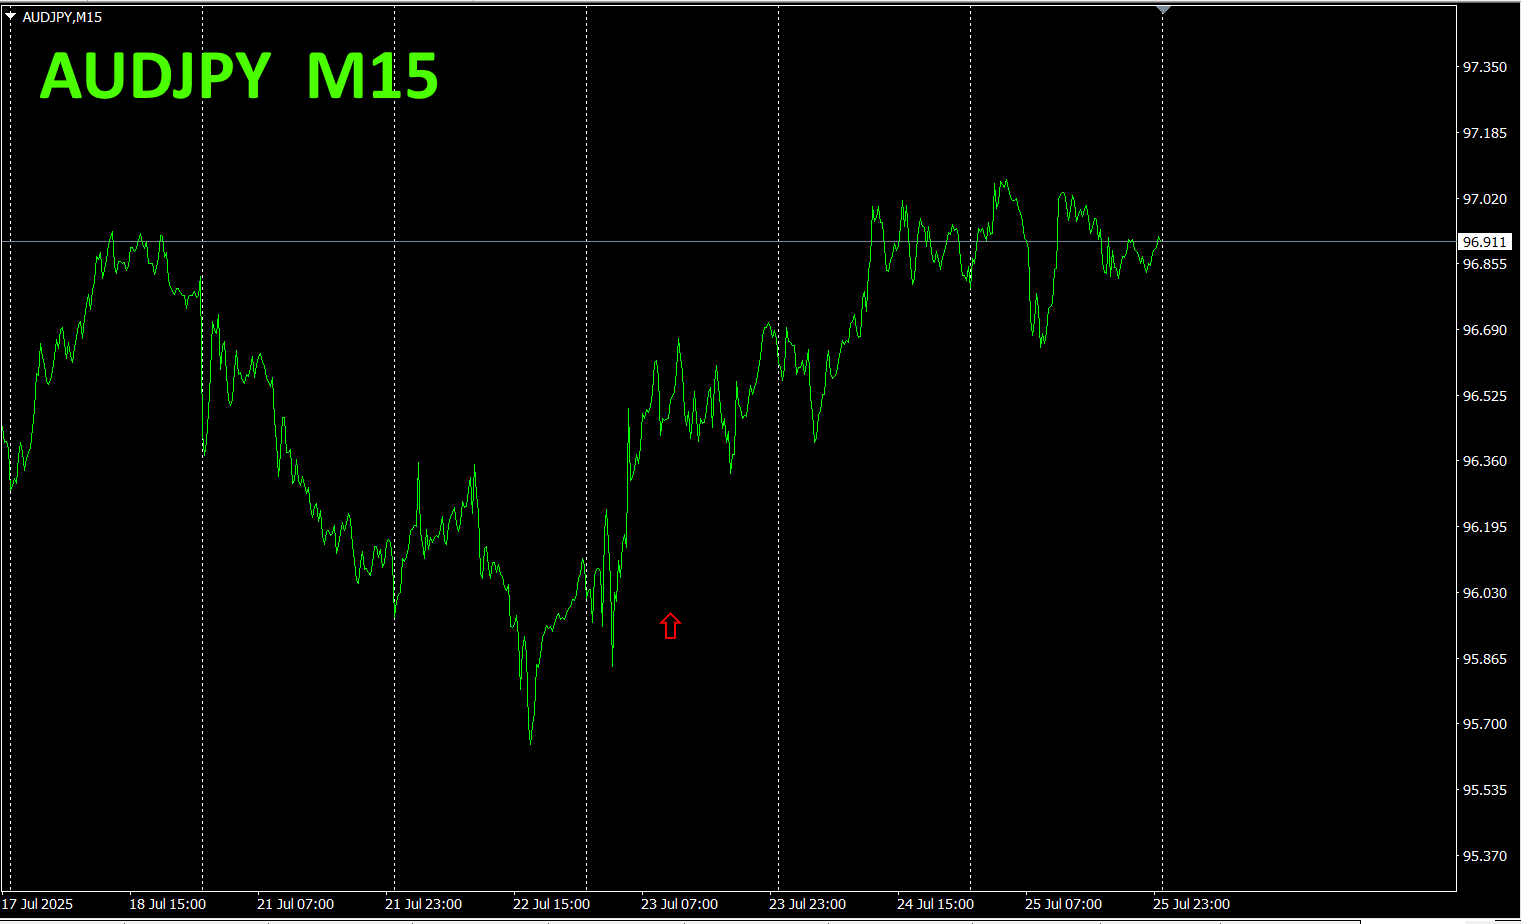
Now, let’s look at the chart forAUDJPY.
The red arrows indicate the point at which the screenshot was taken. It corresponds to a rising period within an uptrend.
“28 currency pairs Best Select
“28 currency pairs Best Select indicator”

https://www.gogojungle.co.jp/tools/indicators/35128
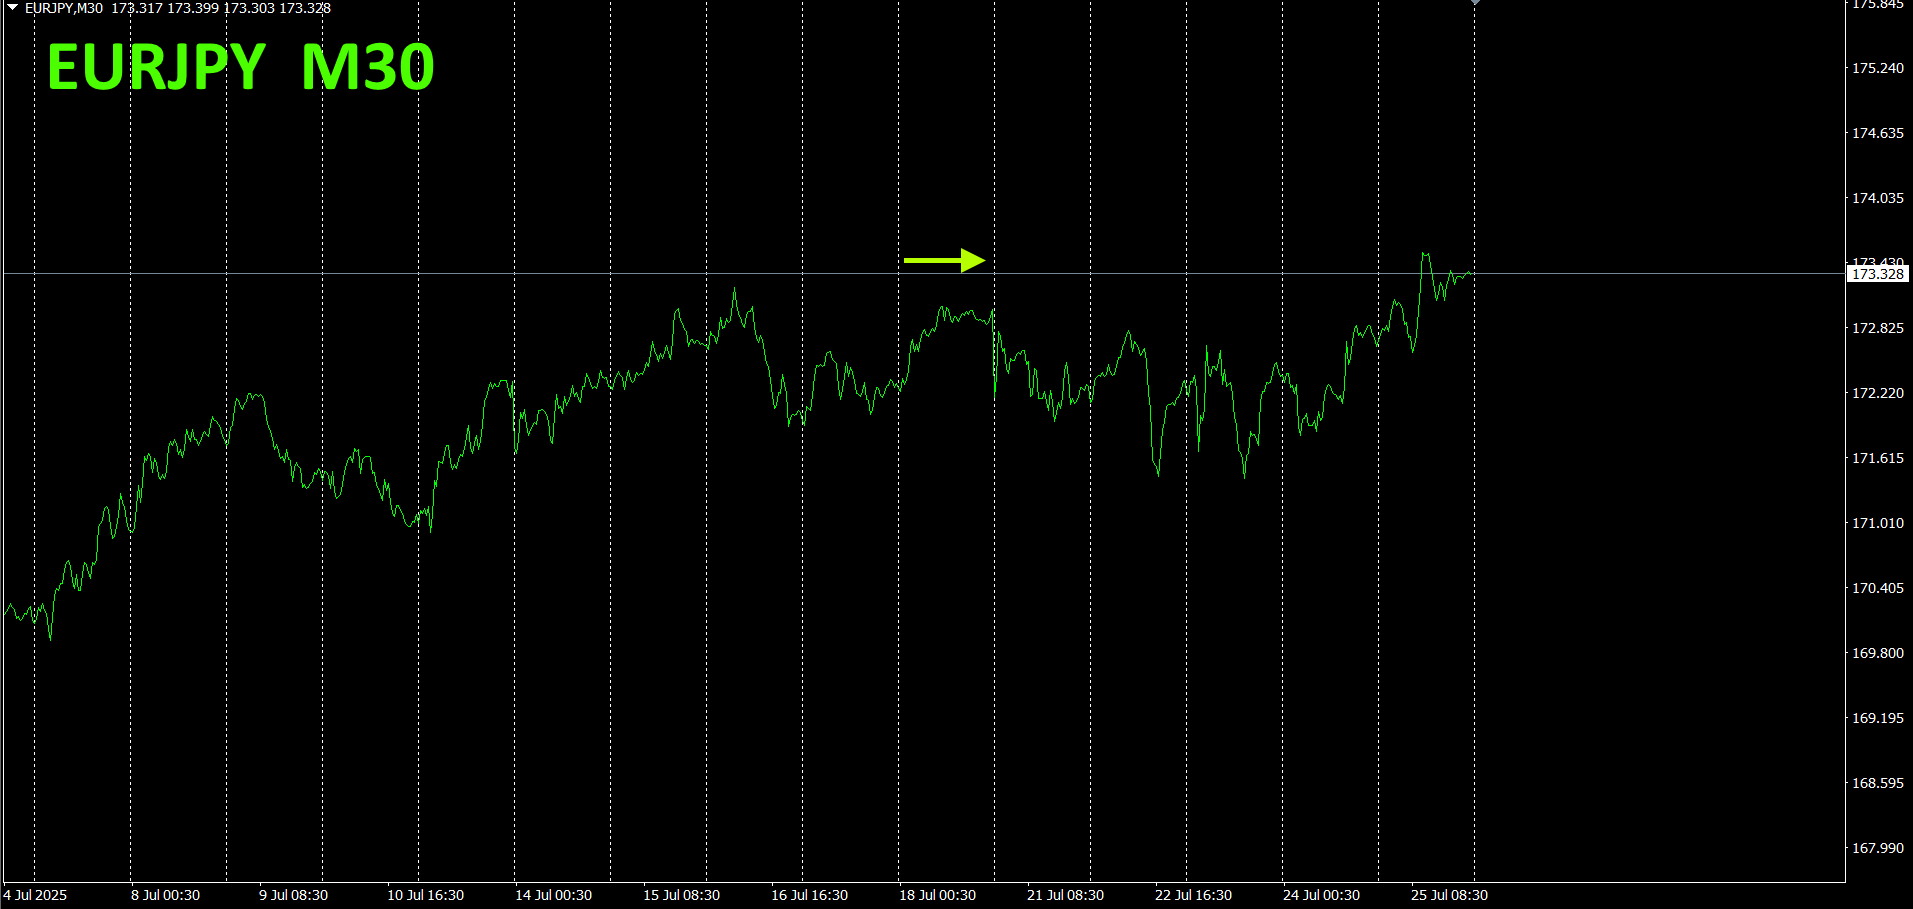
3. 2021 year5 month onward, what happened to EURJPY?
2021 year5 month onwards, the movement of EURJPY is being tracked.
To view the overall trend, a30-minute chart covering about the last3 weeks has been drawn.
Previously, I wrote the following.
In the 30-minute currency strength chart, EUR and JPY are largely horizontal, giving no clear directional bias. Going forward, EURJPY is expected to move in a range.
As predicted, it appears to be in a range with resistance.
30-minute currency strength chart.
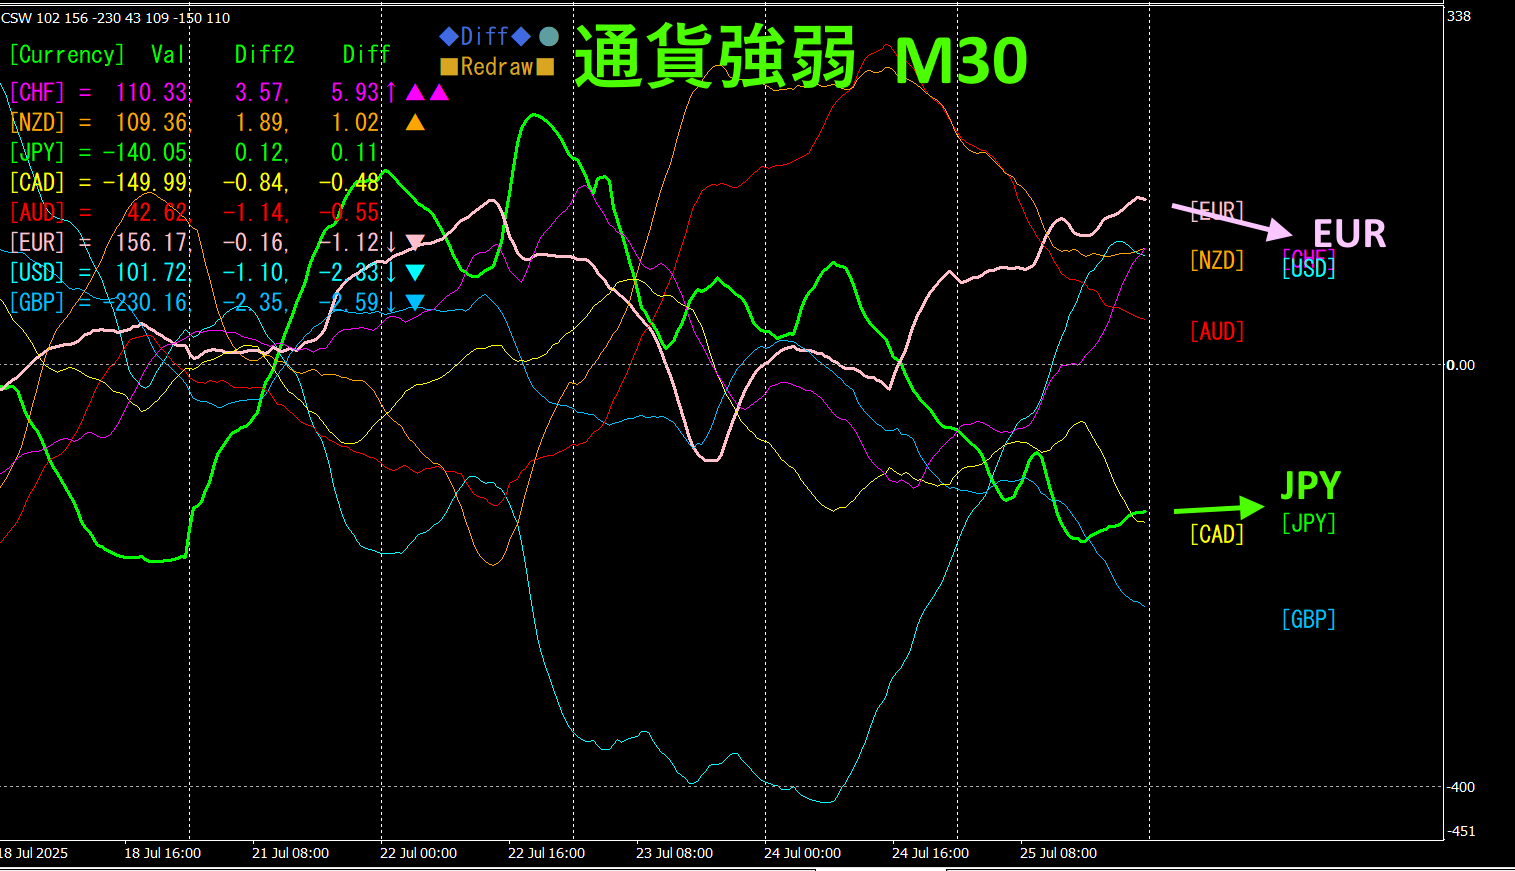
Pink isEUR, green is andJPYJPY. form a graph where two snakes entwine. In the near term,EUR is slightly downward,JYP is slightly upward, with no clear directional bias. Going forward, EURJPY is expected to stay in a range for a while.
4.
New indicator “Dual_MACD_Trend_Indicator” is shown below.
MT4 version:https://www.gogojungle.co.jp/tools/indicators/62199
https://www.gogojungle.co.jp/tools/indicators/62202
It is an indicator that clearly shows the direction of the trend with color. If the color bar is Lime, it’s a buy; if Red, it’s a sell. It’s easy for beginners to use. If the bar color is green, it’s an uptrend; if red, a downtrend; if no color, there is no trend. Because it uses color, you can grasp the trend state at a glance.
I installed this indicator on the GBPUSD1 hour chart.
Once this indicator is installed, buy and sell zones are color-coded, so there’s no hesitation about selling or buying.
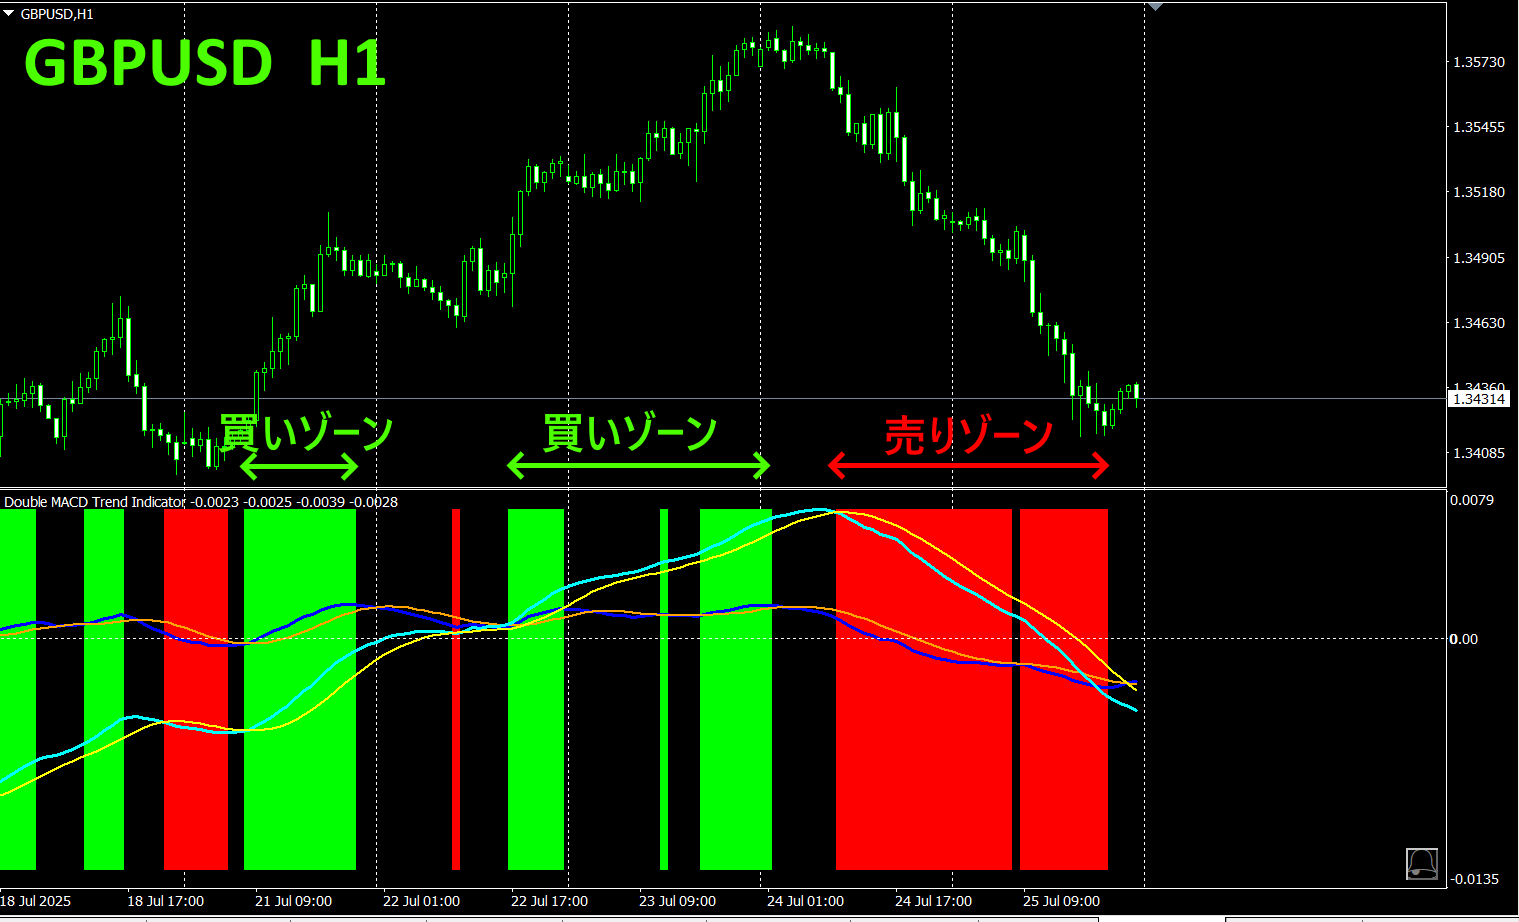
With “Dual_MACD_Trend_Indicator, follow a simple rule: buy in the green zone, sell in the red zone, and do not trade otherwise.
In the above example, buying yielded70pips+85pips, selling yielded135pips, for a total of about290pips profit.
By using theDual_MACD_Trend_Indicator, there is no longer any hesitation about trade direction.
5.
“Hyper-CSW” has been released
“Hyper-CSW” is a high-performance indicator that visualizes the strength of the eight major currencies at a glance. It records the strongest currency and score for the current timeframe, enabling precise identification of trend durability and turning points. In addition, it supports multi-timeframe analysis that displays currency strength rankings (top 4 currencies) across timeframes such as M15, H1, H4, D1, and W1 with scores. Its highly legible color lines and separate window display empower you to gauge the market flow effectively.
For details, please refer to the following link.
https://www.gogojungle.co.jp/tools/indicators/65082
※ Recommended Indicators
“Toretore Indicator”
https://www.gogojungle.co.jp/tools/indicators/50115
“TrendLine-EX”


https://www.gogojungle.co.jp/tools/indicators/42257
“8C currency strength visualization indicator” please refer to the page below.

MT4 version https://www.gogojungle.co.jp/tools/indicators/39150
MT5 version https://www.gogojungle.co.jp/tools/indicators/39159
【My current products for sale】


