2025-7-26 This Week's USD/JPY, Next Week's USD/JPY
【This Week's USDJPY, Next Week's USDJPY】
The image below displays 『Trendline Pro 2』 and 『Next Generation ZigZag Starting from the World’s Smallest』 overlapped.
USDJPY Chart Image【Last Week】
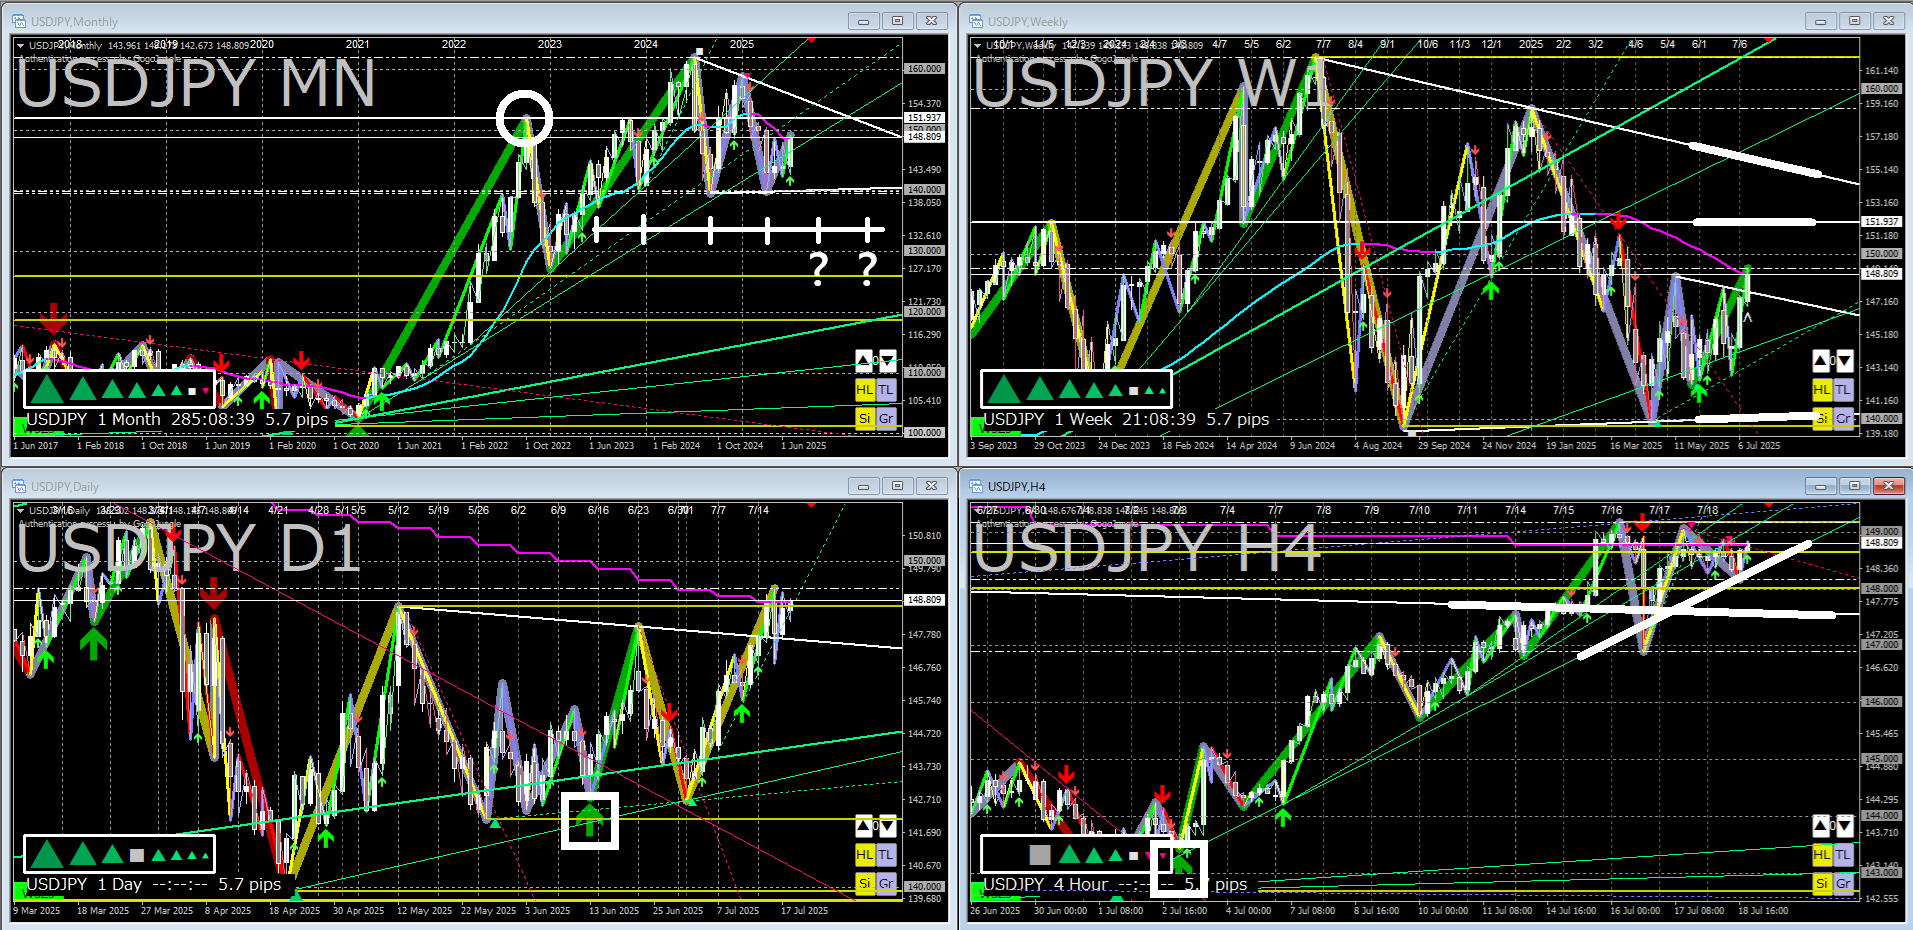
▼ ▼ ▼ ▼ ▼
USDJPY Chart Image【This Week】
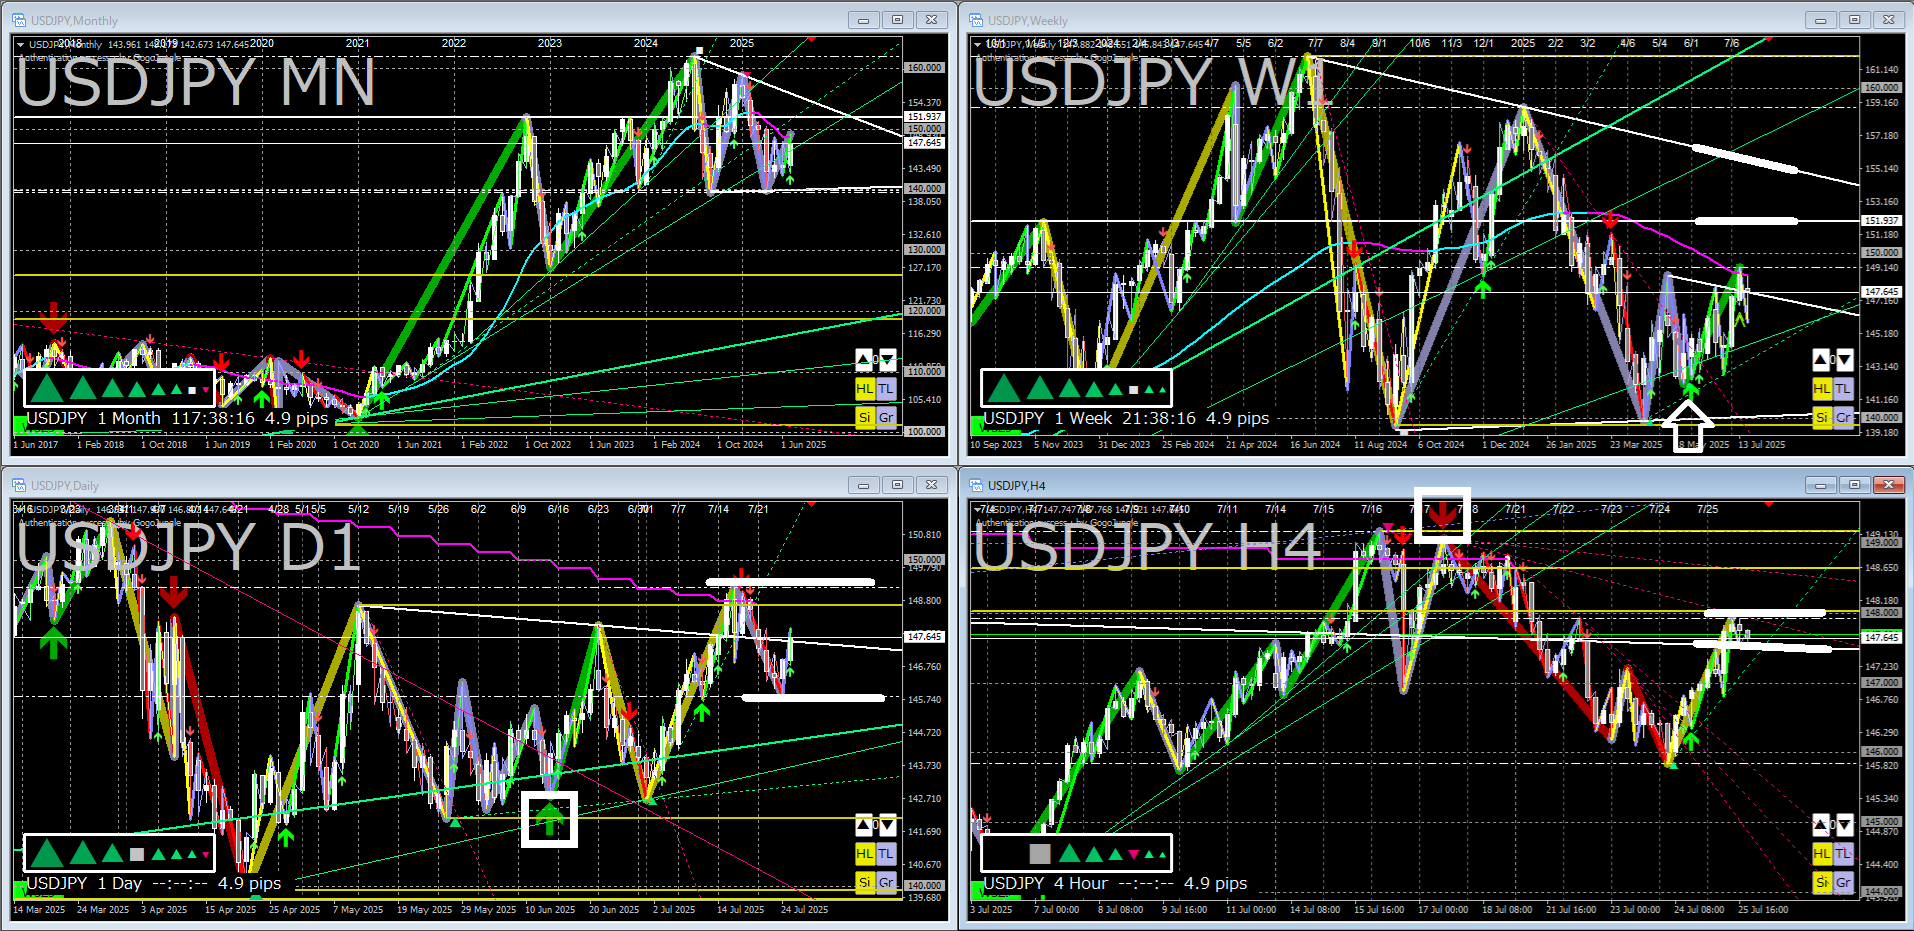
【Long-Term View】
From a bearish three-way pattern on the monthly chart (Descending Triangle), a break below 140 yen is a likely scenario to be mindful of.
However, looking at the frequency of touches around 140 yen on the monthly chart, it seems more days of adjustment are needed before a downside break.
After a temporary rise, it would be natural to test lower levels again.
Noticing this, perhaps due to difficulties with swaps, the number of short positions continues to decrease.
If, after the adjustment in days, a break below 140 yen cannot be achieved, there remains a non-zero possibility of a sharp move toward a weaker yen.
As a premise, at the monthly chart level, the trend is still in an uptrend.
ーーーーーーーーーーーーーーーーーーーー
『 Read More』 ButtonWhen pressed,【Weekly View】will be displayed.
ーーーーーーーーーーーーーーーーーーーー