

How to Use Scalping for 100 Million Traders
Transition to a Winning Trader — Explosive Indicator
Thank you for watching the product promo video.
The first part where I speak honestlyVideo is here
And it includes the story of going long and short
Serious second videoVideo is here
Good morning, everyone.
Last night, the Dollar/Yen dropped sharply due to the Trump vs. Powell issue.
It has currently retraced about 50%.
Tonight, the U.S. data “Retail Sales” is released.
It will likely swing, offering trading opportunities.
The chart I wrote about yesterday
Transition to a Winning Trader — Explosive Indicator Chart
I’d like to review it.
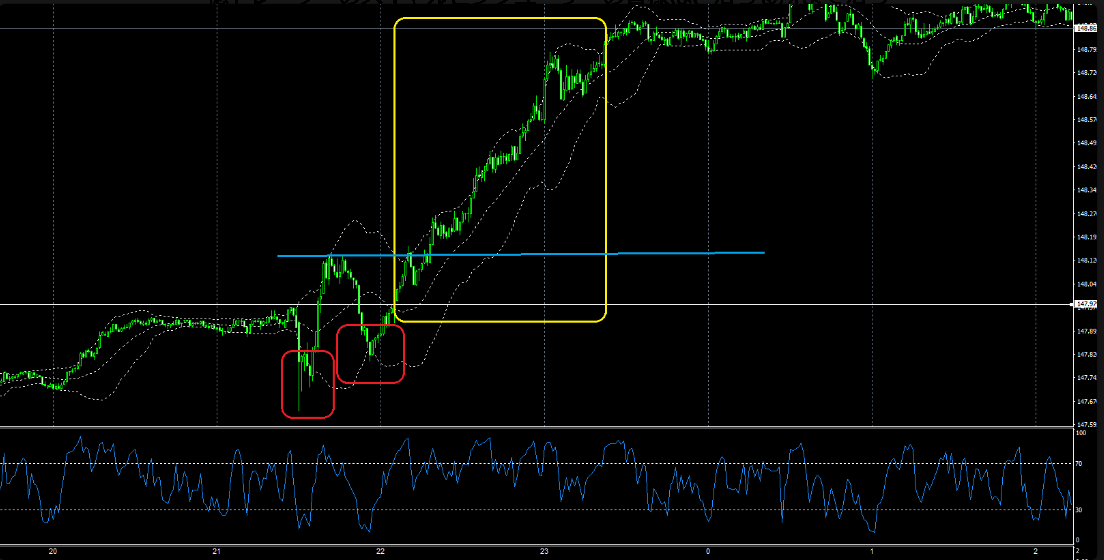

This is a preparation signal for a 1-minute chart, so you can enter calmly when the timing comes.
I also watch this chart every day, but sometimes my own judgment is faster.
Perhaps signals will appear around here?
There are times I wait for signals, but when pullbacks coincide, there’s room to think after the signal appears, which is very useful.
If you enter just because a signal appeared, or do trades like a one-trick pony, you’ll never have enough money to sustain it.
Do you take the signal and go?
If you enter and fail, where will you cut losses?
Where will you take profits?
Will you wait for the next L-signal for profits?
There are many things you need to consider.
If you don’t have the ability to judge in real time, the discussion ends there.
Repeat the cycle of discretionary trading → signal trading → discretionary trading to build capability.
Common sense makes this obvious, but taking a supplement and becoming Otani from tomorrow is impossible.
Trading on signals and continuing to win is another fantasy; if there were a product that made that real, tell me.
I’d buy it immediately.
This morning
New Billionaire Trader Scalping — Volume Plus
I’ll explain its simple usage with a quick review.
Product features
① Determine now if it’s a buy or sell from the chart
② From the Billionaire Trend, you can chase price and chart movements
③ You can enter on the Billionaire Trend
④ You can set profit and stop-loss on the Billionaire Trend
⑤ Easily practice breakout, pullback, and retracement
⑥ On the Billionaire Trend, you know the breakout price in advance
Generally, this is how it works.
Breakout methods are easy to enter but highly affected by volatility.
In simple terms, breakouts are more likely to succeed when volatility exists and more likely to fail when it does not.
Then why not enter only when there is volatility?
This is the idea, but if you understand that, no one would struggle...
This is a common understanding among everyone.
Because it’s a breakout method, you shouldn’t just breakout; you must also position yourself within the sequence leading up to the breakout and prepare for it.
Because trends grow as support and resistance are broken.
Support and resistance are essentially points where a breakout may occur, and with the Billionaire Trend you can know those places in advance; you should think about how to conquer and clear them.
July 14, Dollar/Yen, 1-minute chart around Tokyo 10:00
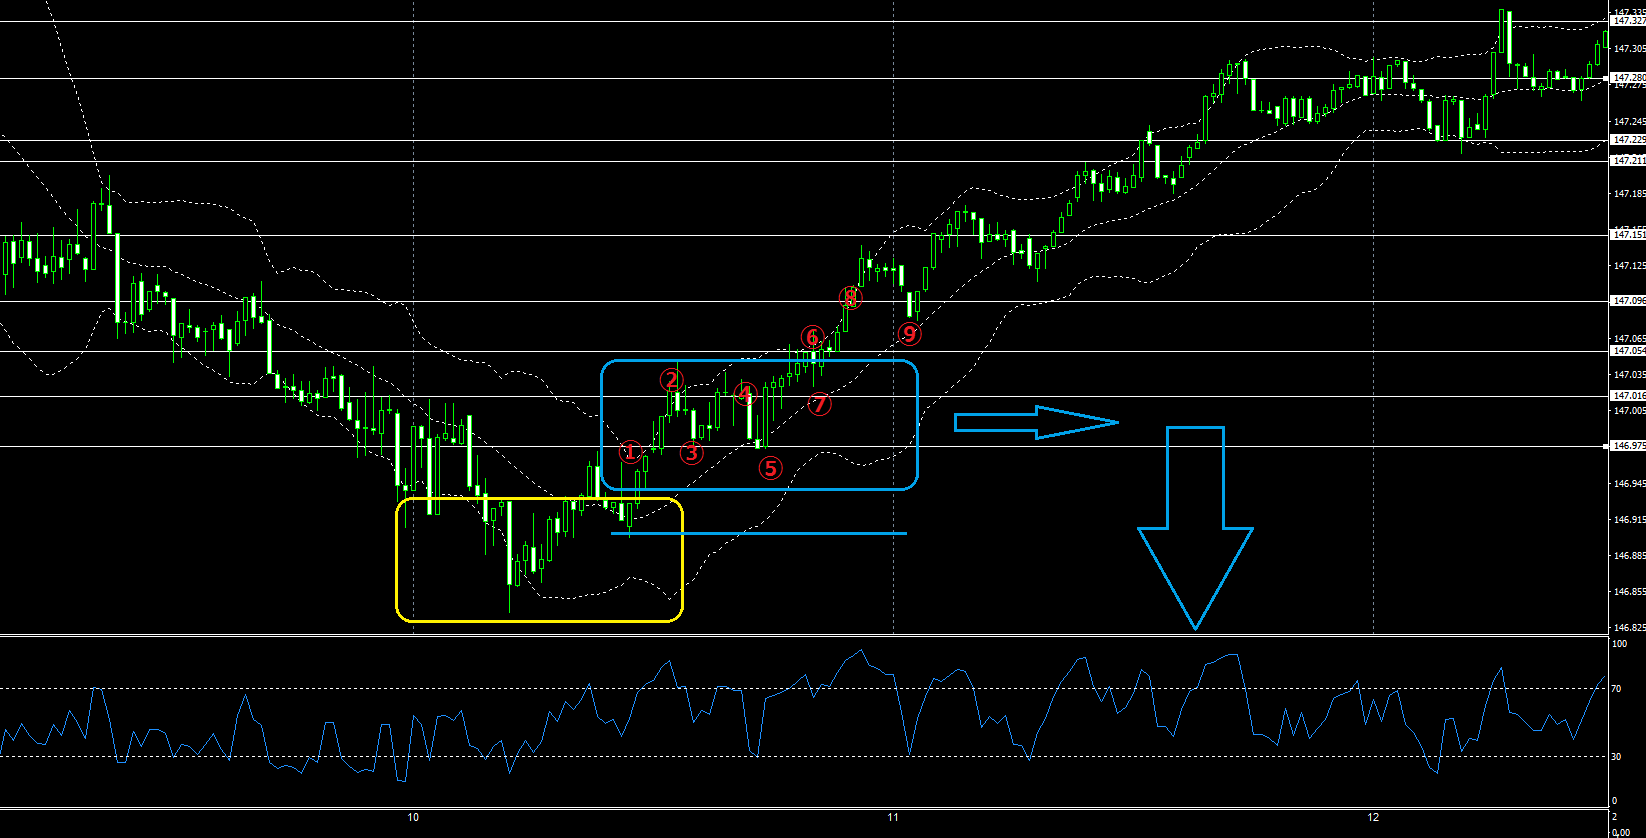
*Please ignore line width here and focus on entry decisions.
About an hour after Tokyo starts, a rough bottom yellow □ appeared.
After that, the Billionaire Chart changes from selling to buying.
From here, L-position standby.
Whether you break on the first Billionaire Trend① depends on your feeling at the moment.
I usually aim for reversals, though.
If you see ①, then break on ② after confirming, but miss the profit and it grows slowly causing a loss.
However, next you may take an L-position on the pullback③ to the first Billionaire Trend① and aim for a break of the line ②.
Subsequent positions follow the same logic, but if the pattern rises with a right-shouldered trend and becomes ⑥⑦⑧⑨, you search for L-position entries by following the manual volume.
Conversely, if the blue □ moves like a blue arrow in a range, and if completely failing, the range turns into a decline.
This is because the chart flows from trend to range to trend; in a complete failure, the original downtrend returns, so L-positions fail.
And a sign of failure is if the initial ① line or the blue horizontal line beneath it is broken downward, in which case you should retreat completely.
Ideally, the price would switch from selling to buying and continue rising, but that doesn’t always happen.
One pattern that tends to occur is during the volatile NY session.
My favorite pattern is starting lower in Tokyo and rising after China opens; I like charts that move like this.
Therefore, I always visualize charts like this when looking at Billionaire Chart.
The highlight of the Tokyo morning session is the Tokyo start, the Tokyo Fix, and the China start.
From today, I think it would be good to view charts with this awareness.
What I recommend immediately for effectiveness are the following three products.
New Billionaire Trader Scalping — Volume Plus
FX Trading That Isn’t Ordinary - Both Sides
Explosive Indicator — Transition to a Winning Trader
There you go.
Thank you for your continued support today as well.