

Utilization of "Visualization Indicator" (Part 207)
Using the "Visualization Indicator" (its207)
1. Further develop the "28 Currency Pair List Indicator" into an indicator
“8CPVisualization Indicator” to plotUSDCHF,GBPCAD,CADJPY on the chart
“8CPVisualization Indicator” includesOceania version,London version,NewYork version,AnyCP version. This time, theOceania version was used.
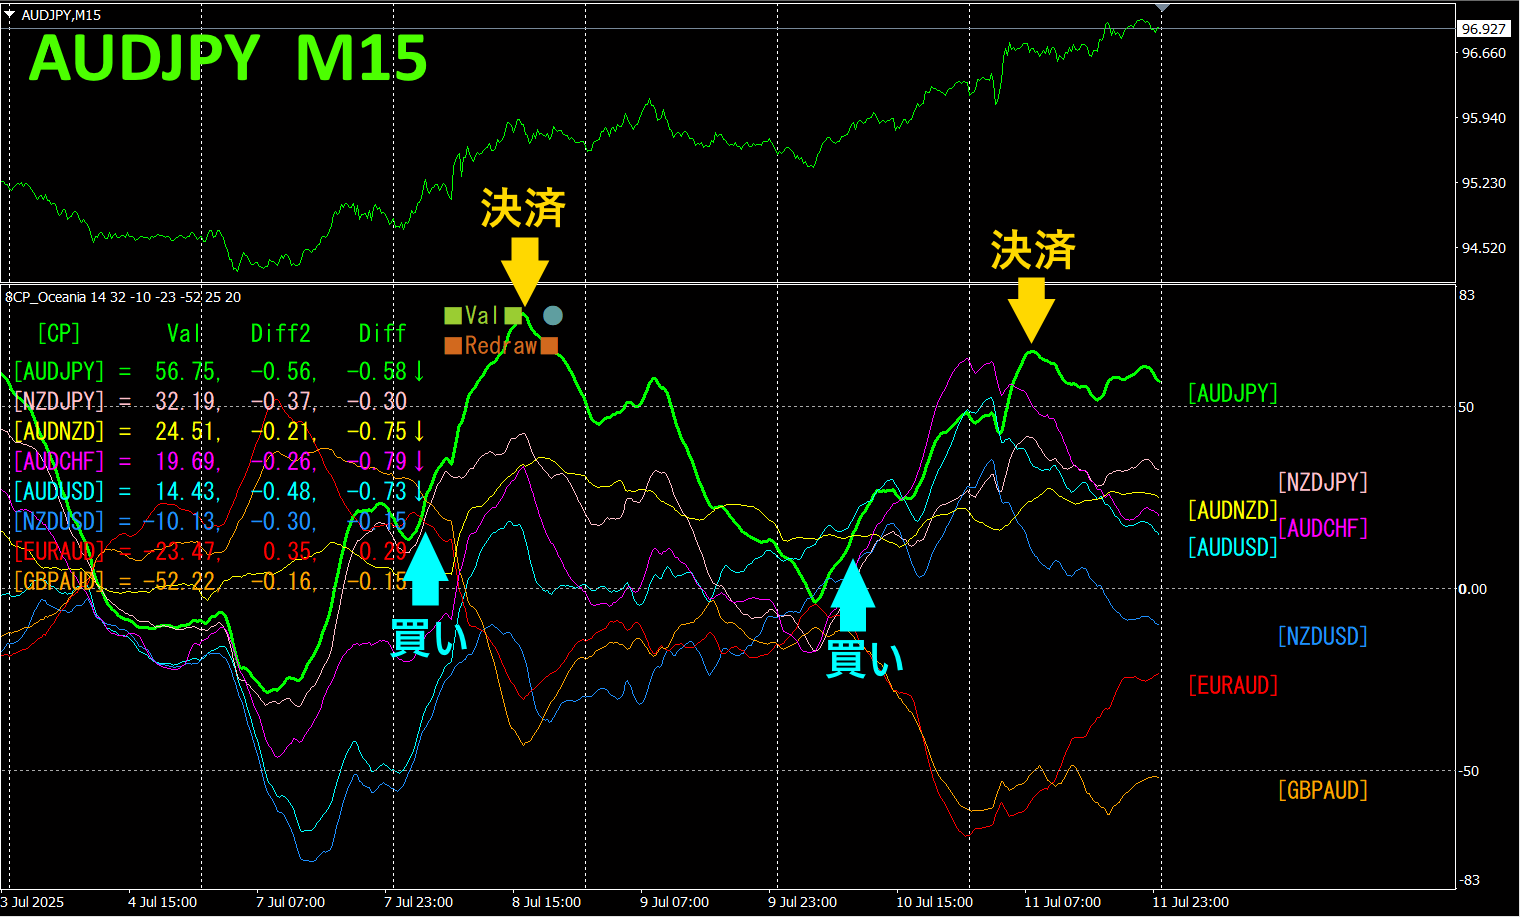
The upper half is theAUDJPY 15-minute chart. The lower half shows the chart from the “8CPVisualization Indicator,” where the chart in green bold line corresponds to.
On Tuesday, theAUDJPY chart broke above the other charts, so I bought. On the same day it reached a peak, so I closed the position. On Thursday, the chart broke above again, so I bought. On Friday it reached a peak again, so I closed the position. for a total of in profit.
Currency Strength/Weakness Graph
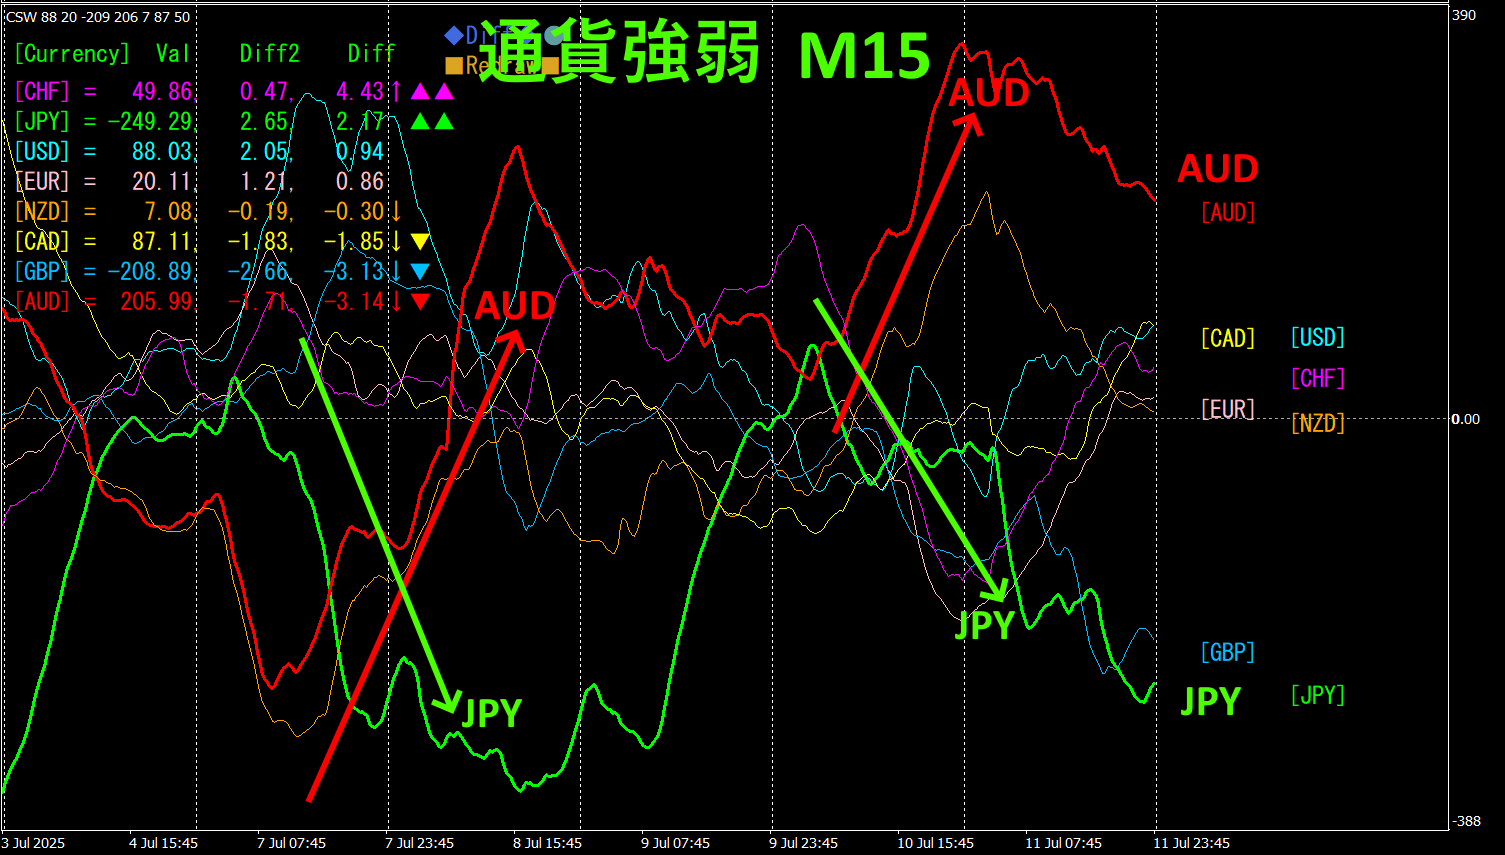
Looking at the 15-minute currency strength/weakness graph,AUD andJPY show a clear inverse correlation. The currency pair that is currently rising the most and is in inverse correlation can be traded to yield results.
“Aim for currency strength inverse correlation!” is FX's fundamental rule.
If you useTrendLine-EX, entrys and exits can be automated when the price breaks a slanted trend line. You can leave it as is for easy trading. TheTrendLine-EX EA that sells automatically on a trendline break below and closes automatically on a break above.
2. Best Select Try the Indicator
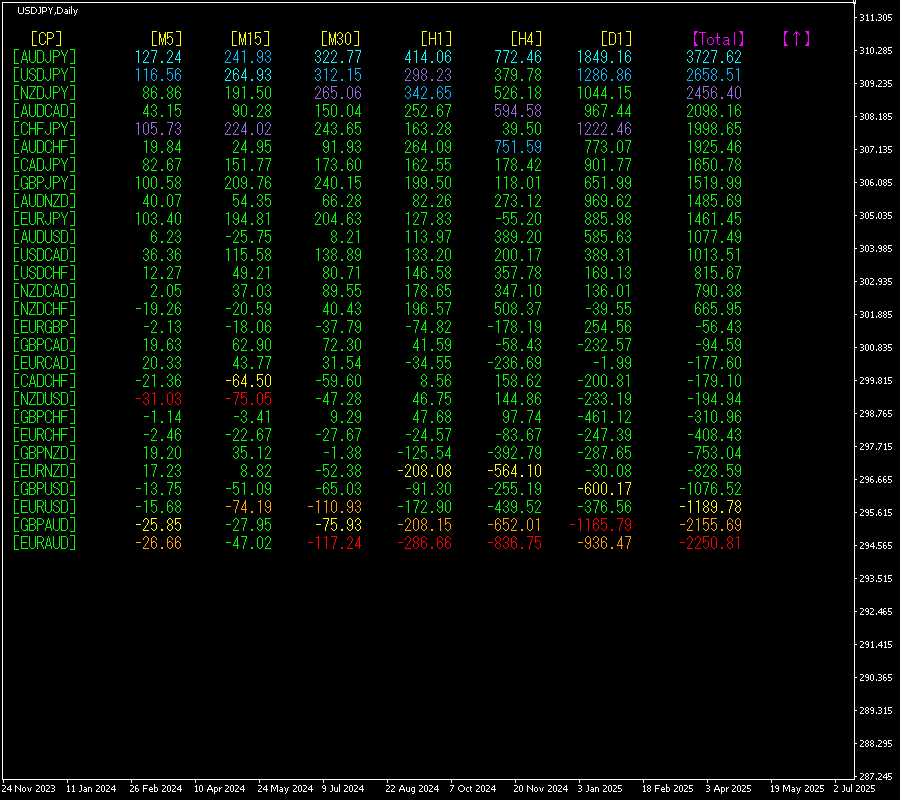
The image below is a screenshot fromJuly,11,, 11:21 JST).
Total]is arranged in descending order. At the very top,AUDJPY appears in blue for all timeframes.Total value is +, a large positive number. Across all timeframes, shows an upward trend.
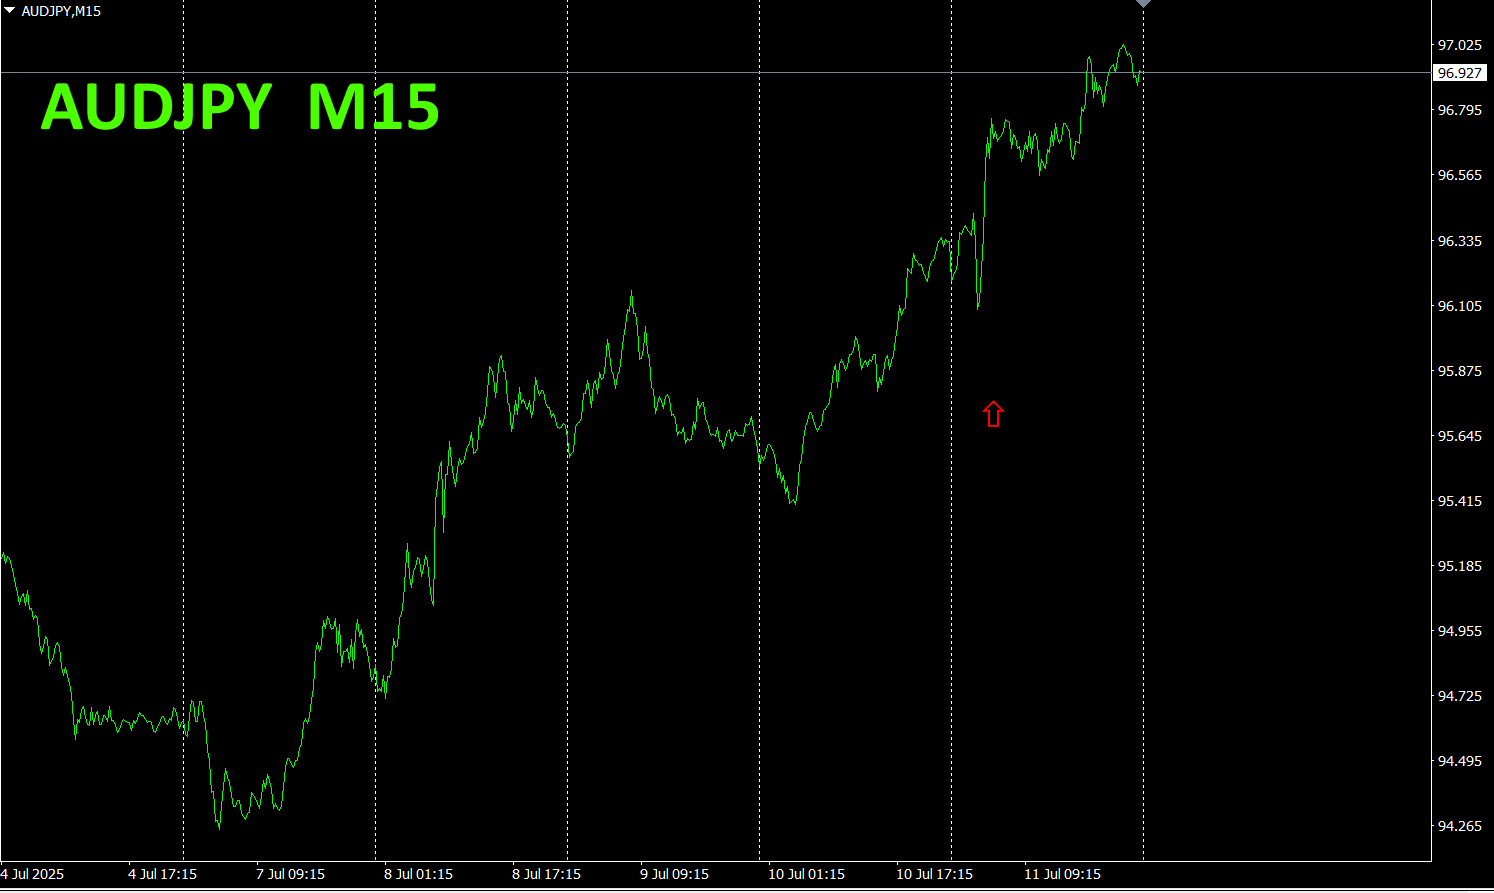
Now, let's look at theAUDJPY chart.
The red arrow marks the point where the screenshot was taken. It corresponds to a strong surge during the middle of an uptrend.
“28 Currency PairsBest Select
“28 Currency PairsBest Select Indicator

https://www.gogojungle.co.jp/tools/indicators/35128
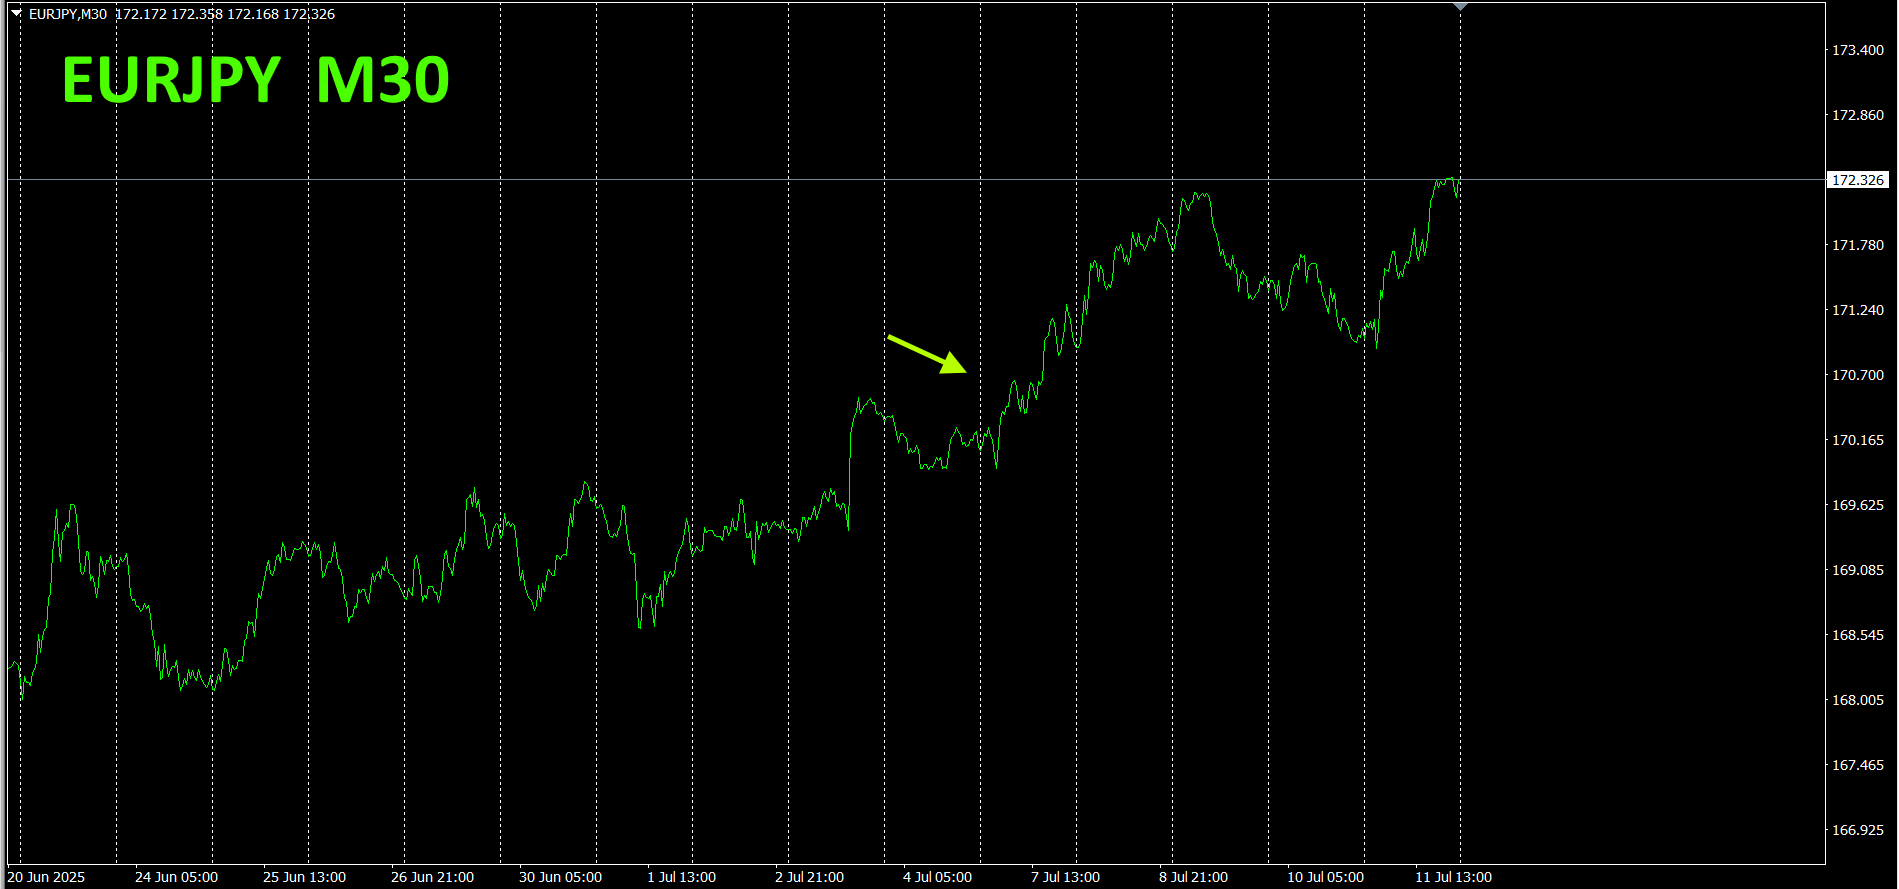
3. 2021 Year5 monthsince the EURJPY movement has been tracked?
2021 year5 monthsince we have been tracking the EURJPY movement.
To see the overall trend,30-minute chart shows roughly the last weeks.
Last time I wrote the following.
Pink stands forEUR, green for. In the currency strength chart, is slightly downward, is upward, so
However, it rose contrary to the forecast.
30-minute currency strength chart.
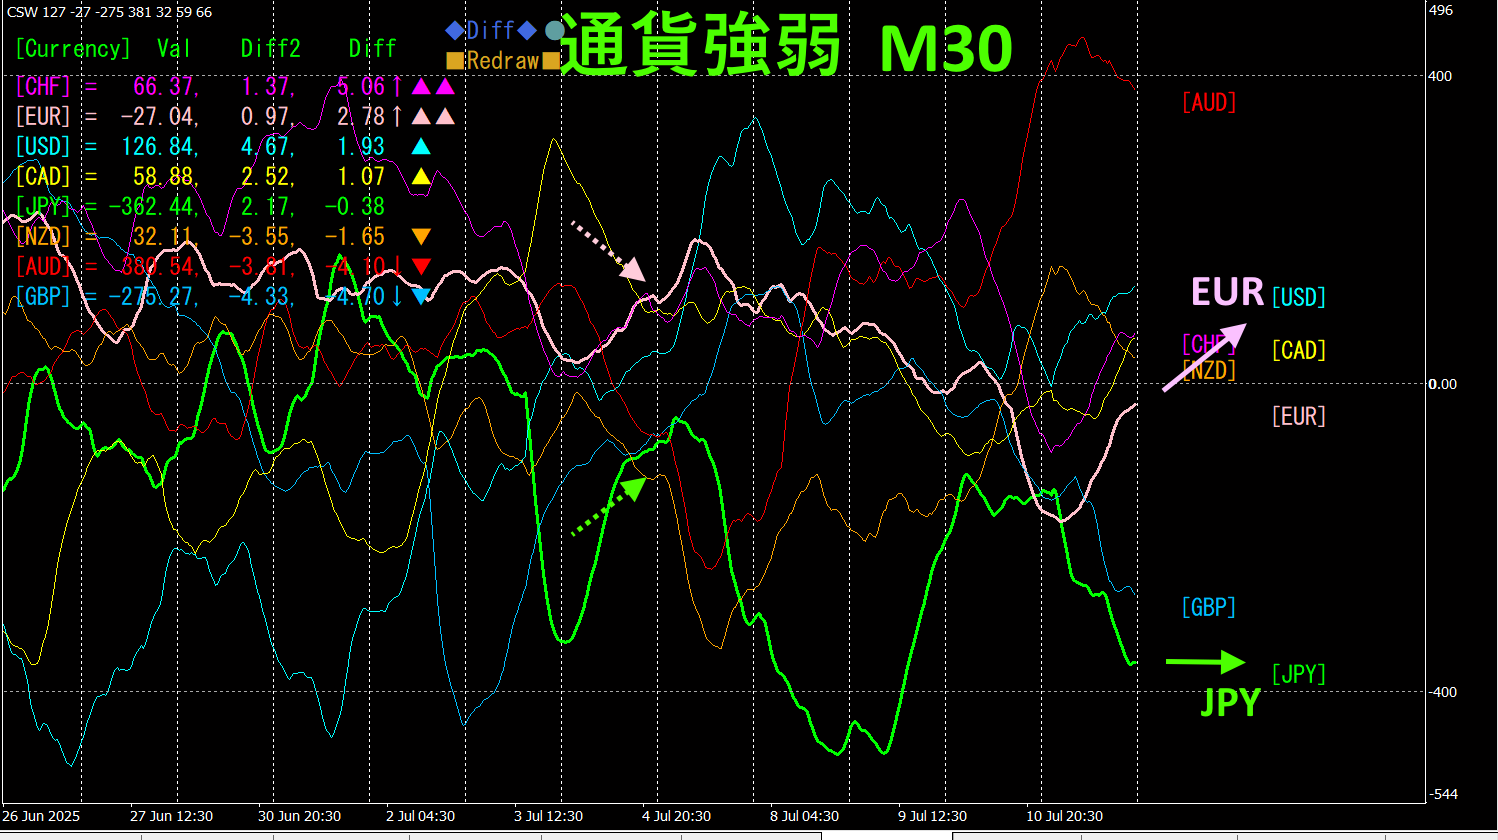
Pink for, green for. The forecast arrows as of the end of last week show that would fall and would rise, but the currency weakened sharply, resulting in rising.
If this is the case (since is significantly weak), would be expected to rise substantially. (Lower 15-minute chart)
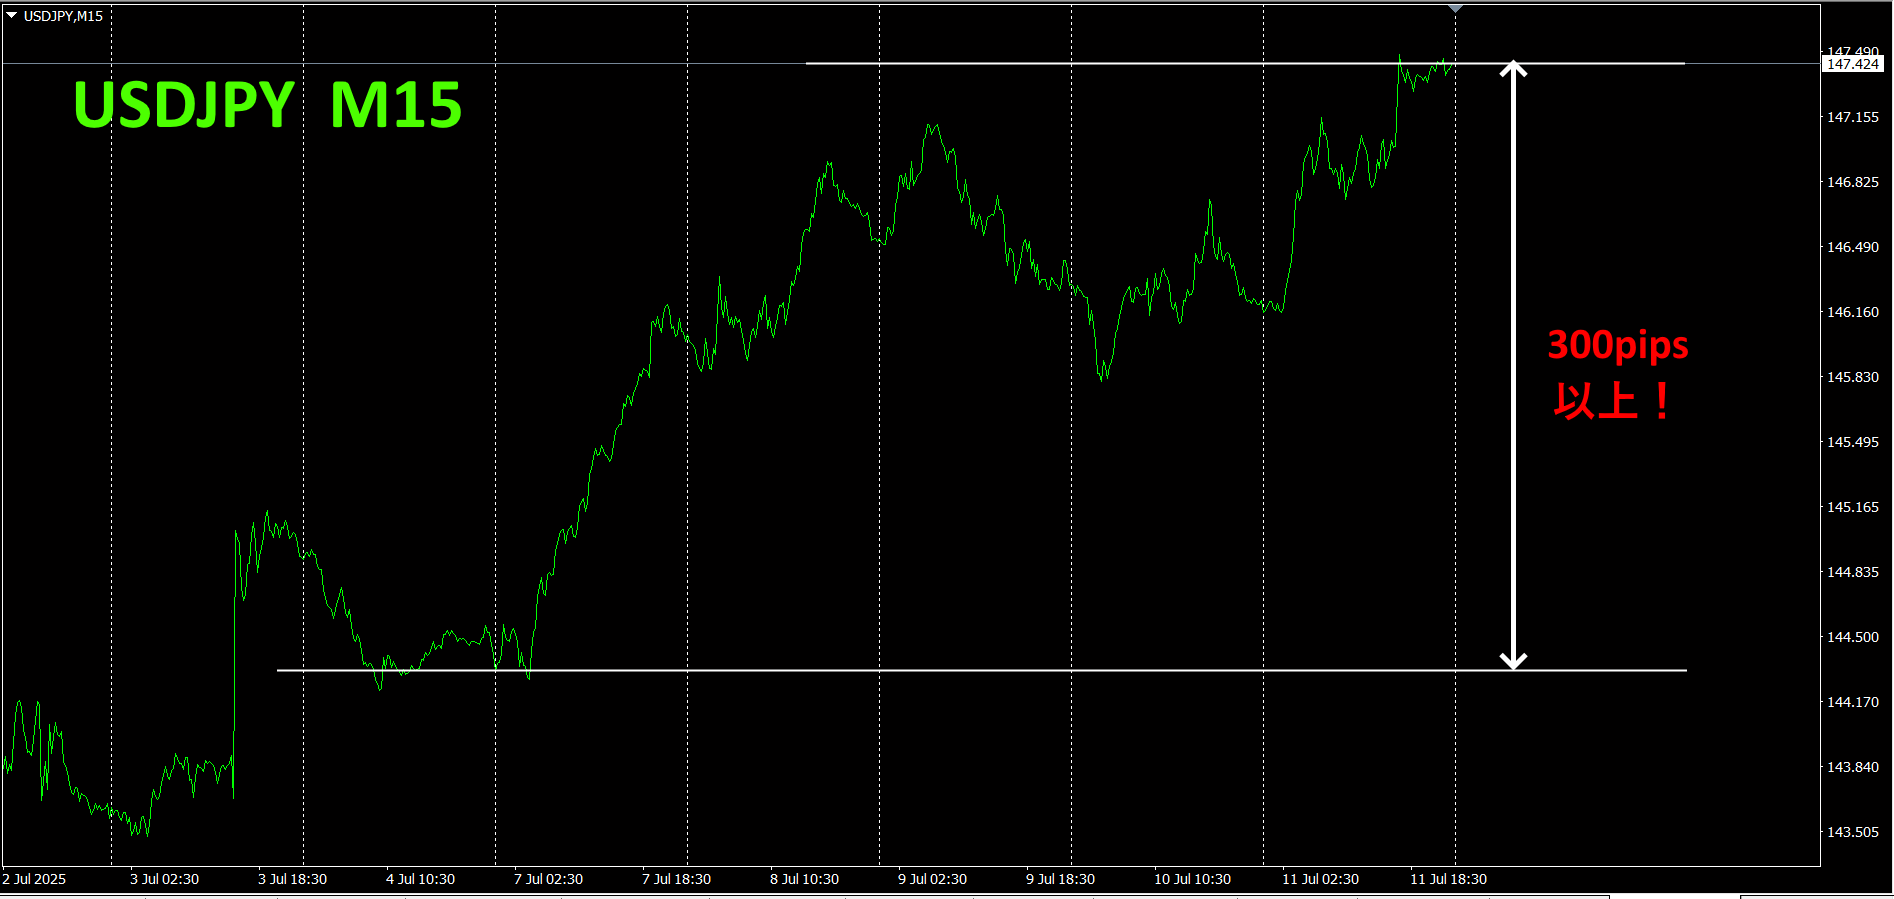
In the currency strength chart, is rising, is slightly downward, so is expected to trend higher in the future.
USDJPY 15-minute chart.
Incredible—over rise. It would have been better to buy earlier; too late now.
4.
New Indicator “Dual_MACD_Trend_Indicator” is described below.
MT4 version:https://www.gogojungle.co.jp/tools/indicators/62199
https://www.gogojungle.co.jp/tools/indicators/62202
A clear, color-based indicator that shows the direction of the trend. If the color bar isLime, buy; if it isRed, sell. It is easy for beginners to use. If the bars are green, the trend is up; if red, the trend is down; if no color, there is no trend. Because it uses color, you can grasp the trend state at a glance.
I have introduced this indicator on theUSDJPY on the1 hour chart.
With this indicator, buy zones and sell zones are color-coded, so there is no hesitation about selling or buying.
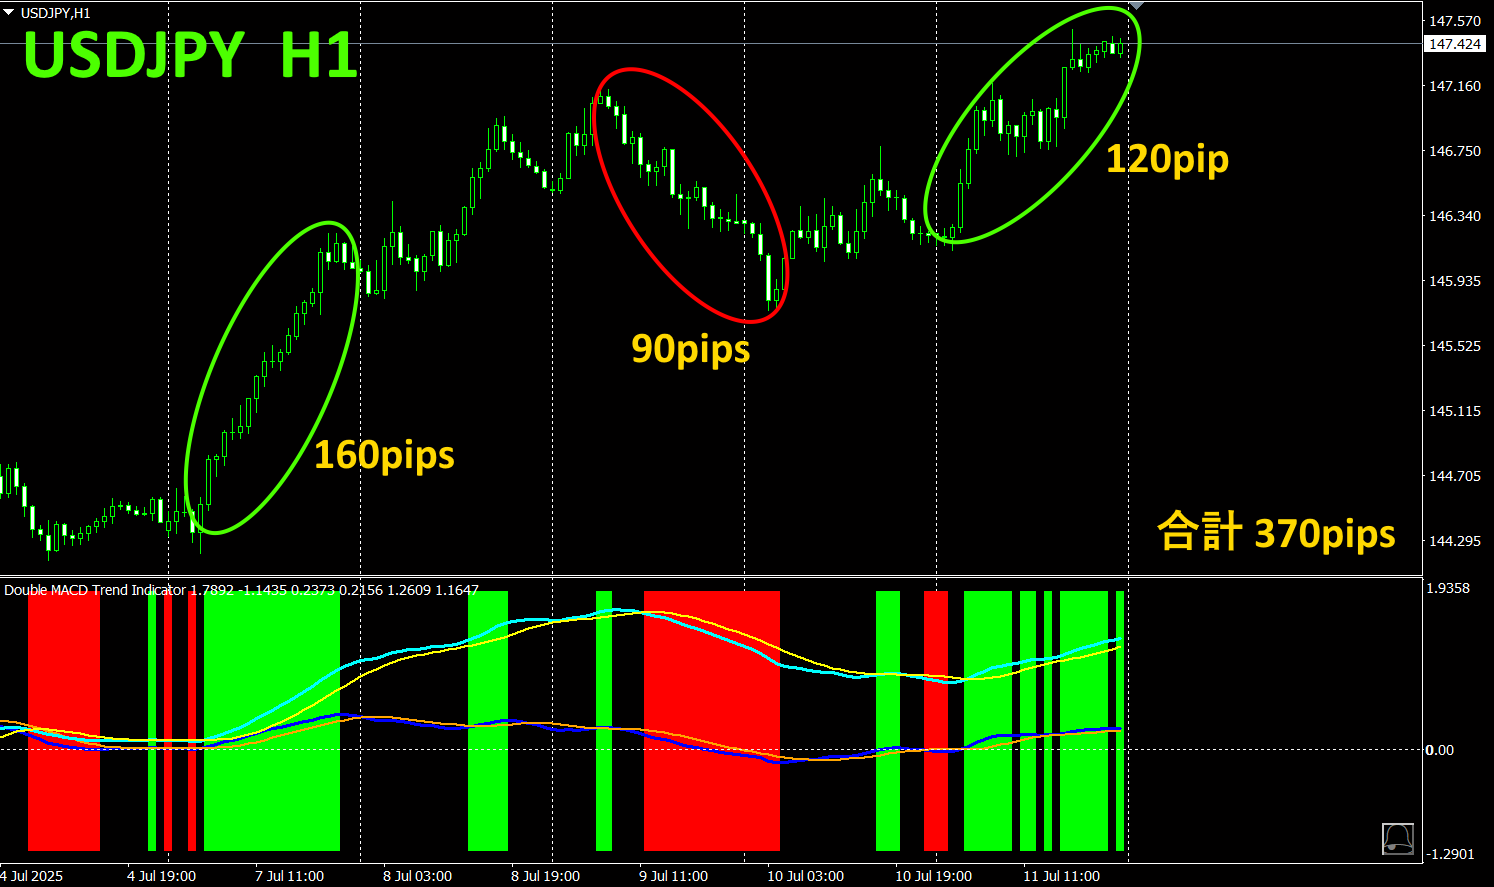
Following the simple rule with theDual_MACD_Trend_Indicator: buy in green zones, sell in red zones, and do not trade otherwise. I gained about in profit in total.
“Only go for the parts that will grow, and don’t trade elsewhere.” This is the way to avoid losses in.
If you use theDual_MACD_Trend_Indicator, you will no longer have to wonder about the direction of trades.
5.
“Hyper-CSW” has been released
“Hyper-CSW” is a high-performance indicator that visualizes the strength/weakness of the major currencies at a glance. It records the strongest currency and score for the current time frame and accurately captures trend persistence and turning points. Additionally,,,,, offer multi-timeframe currency strength ranking (top4 currencies) with scores. It is a powerful indicator with high readability via color lines and a separate window, helping you determine market trends.
For details, please see the following link.
https://www.gogojungle.co.jp/tools/indicators/65082
※ Recommended indicators
“Toretore Indicator”
https://www.gogojungle.co.jp/tools/indicators/50115
“TrendLine-EX”


https://www.gogojungle.co.jp/tools/indicators/42257
“8C Currency Strength Visualization Indicator” please refer to the following page.
version https://www.gogojungle.co.jp/tools/indicators/39150
version https://www.gogojungle.co.jp/tools/indicators/39159
【My listed products】


