

Will Wave Master FX [USD/JPY — Next Week's Latest Forecast] break through 148.028 yen?! *Revealing the three entry points with high win rates!*
Hello! I’m Wave Master FX!
【Limited Time&Limited Quantity】

Lastly‘anyonecandoitandearnthestrongestsuper-simple method’ and ‘Freetojoinan online communityavailablewe will introduce.
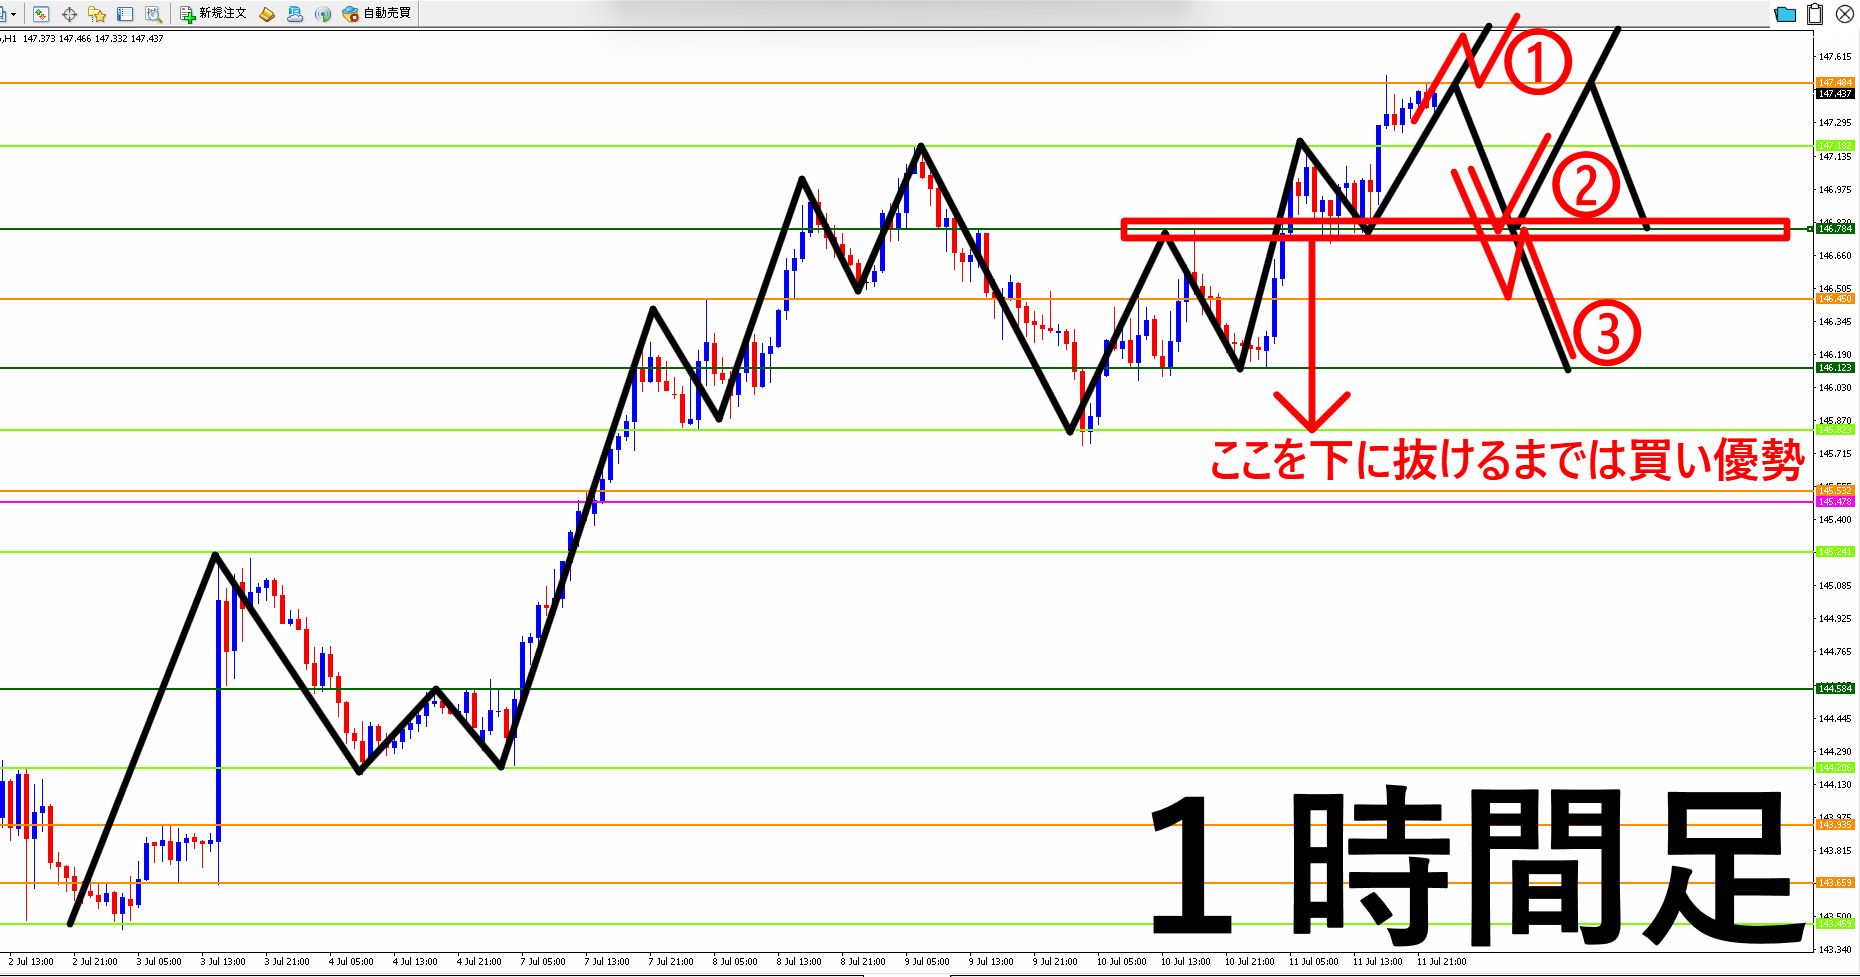
The three high-probability entry pointsare listed on the 1-hour chart below asRed Circle ①・Red Circle ②・Red Circle ③ .
▼ ▼ ▼ ▼ ▼
《 Real-time latest forecast is as follows》July 14, 2025 Monday ~ (with next week's ahead)
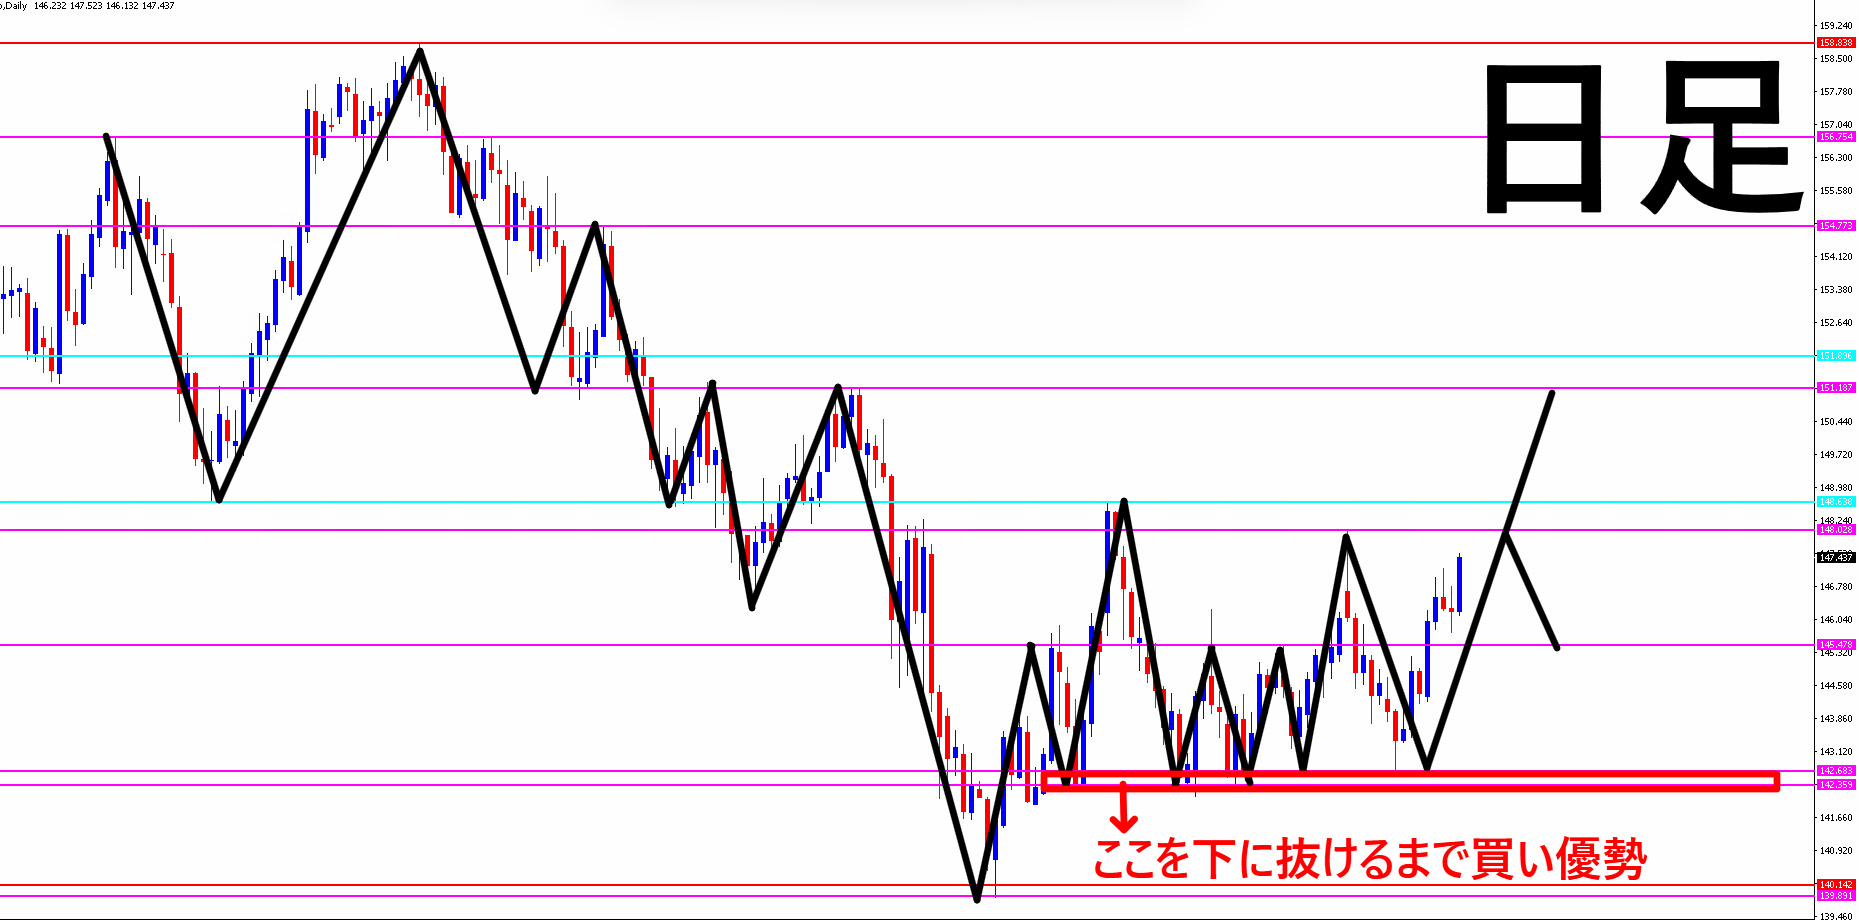
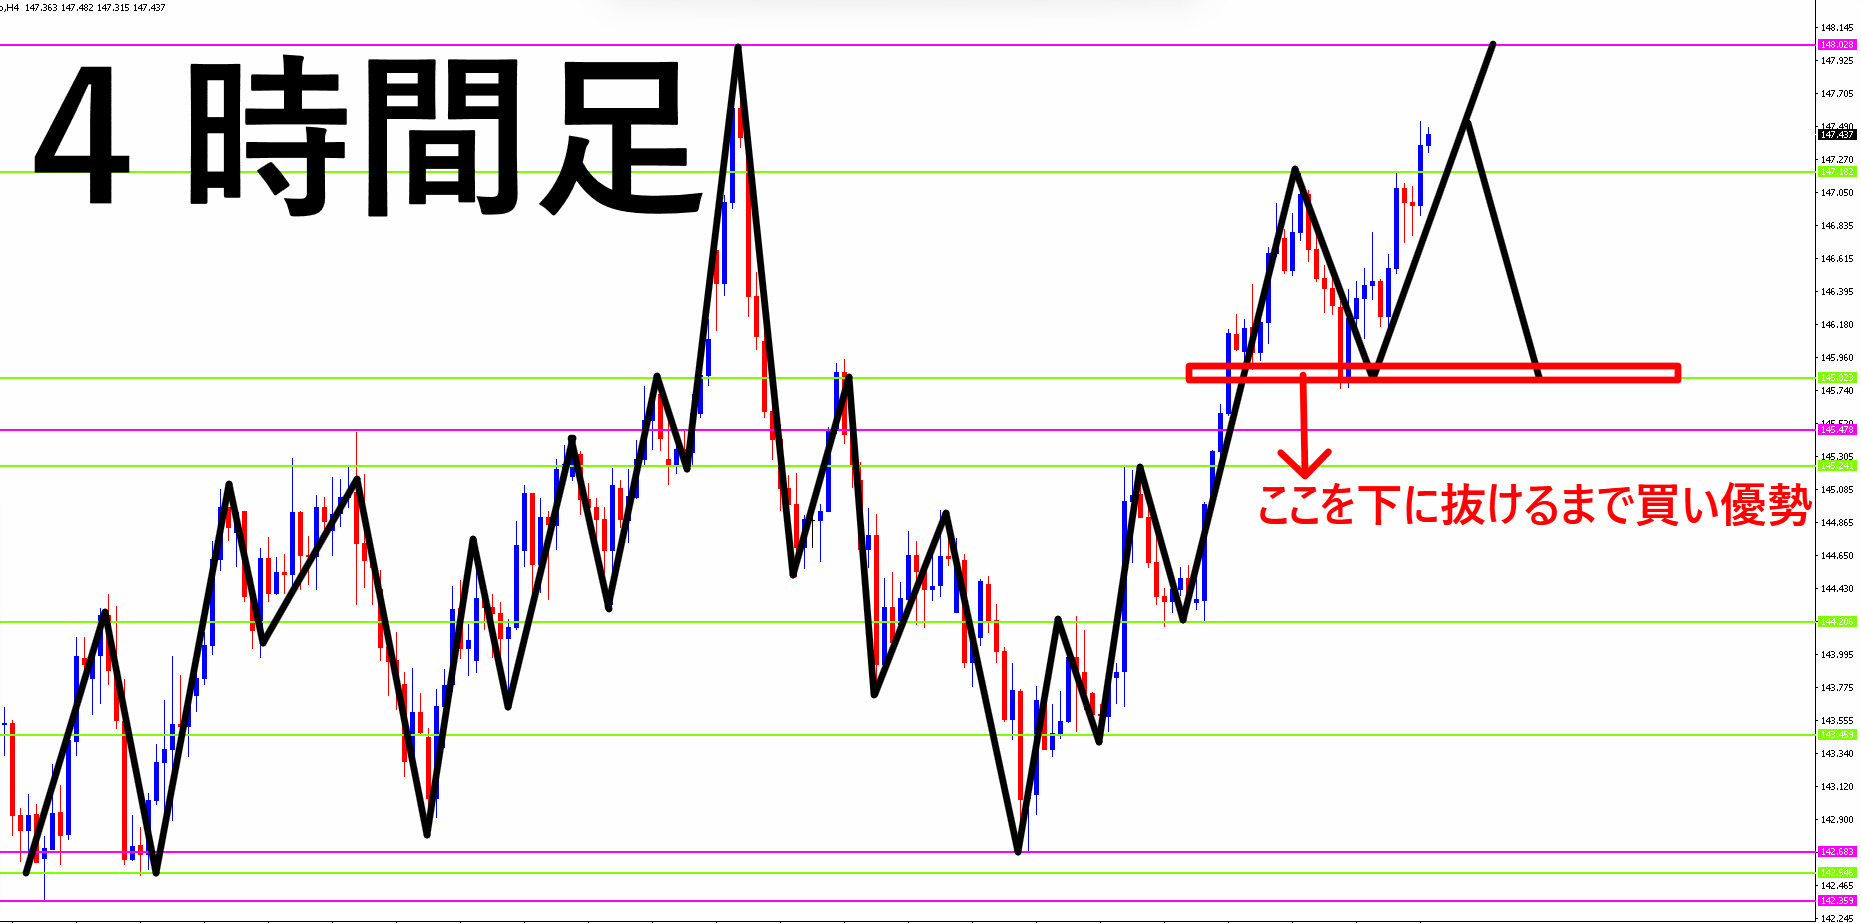
The 4-hour chart shows a buying advantage; will it descend to the range bottom or rise to the latest high on the daily chart (148.028)
There is a buying advantage, will it descend to the pullback low or aim higher to the daily chart’s latest high?
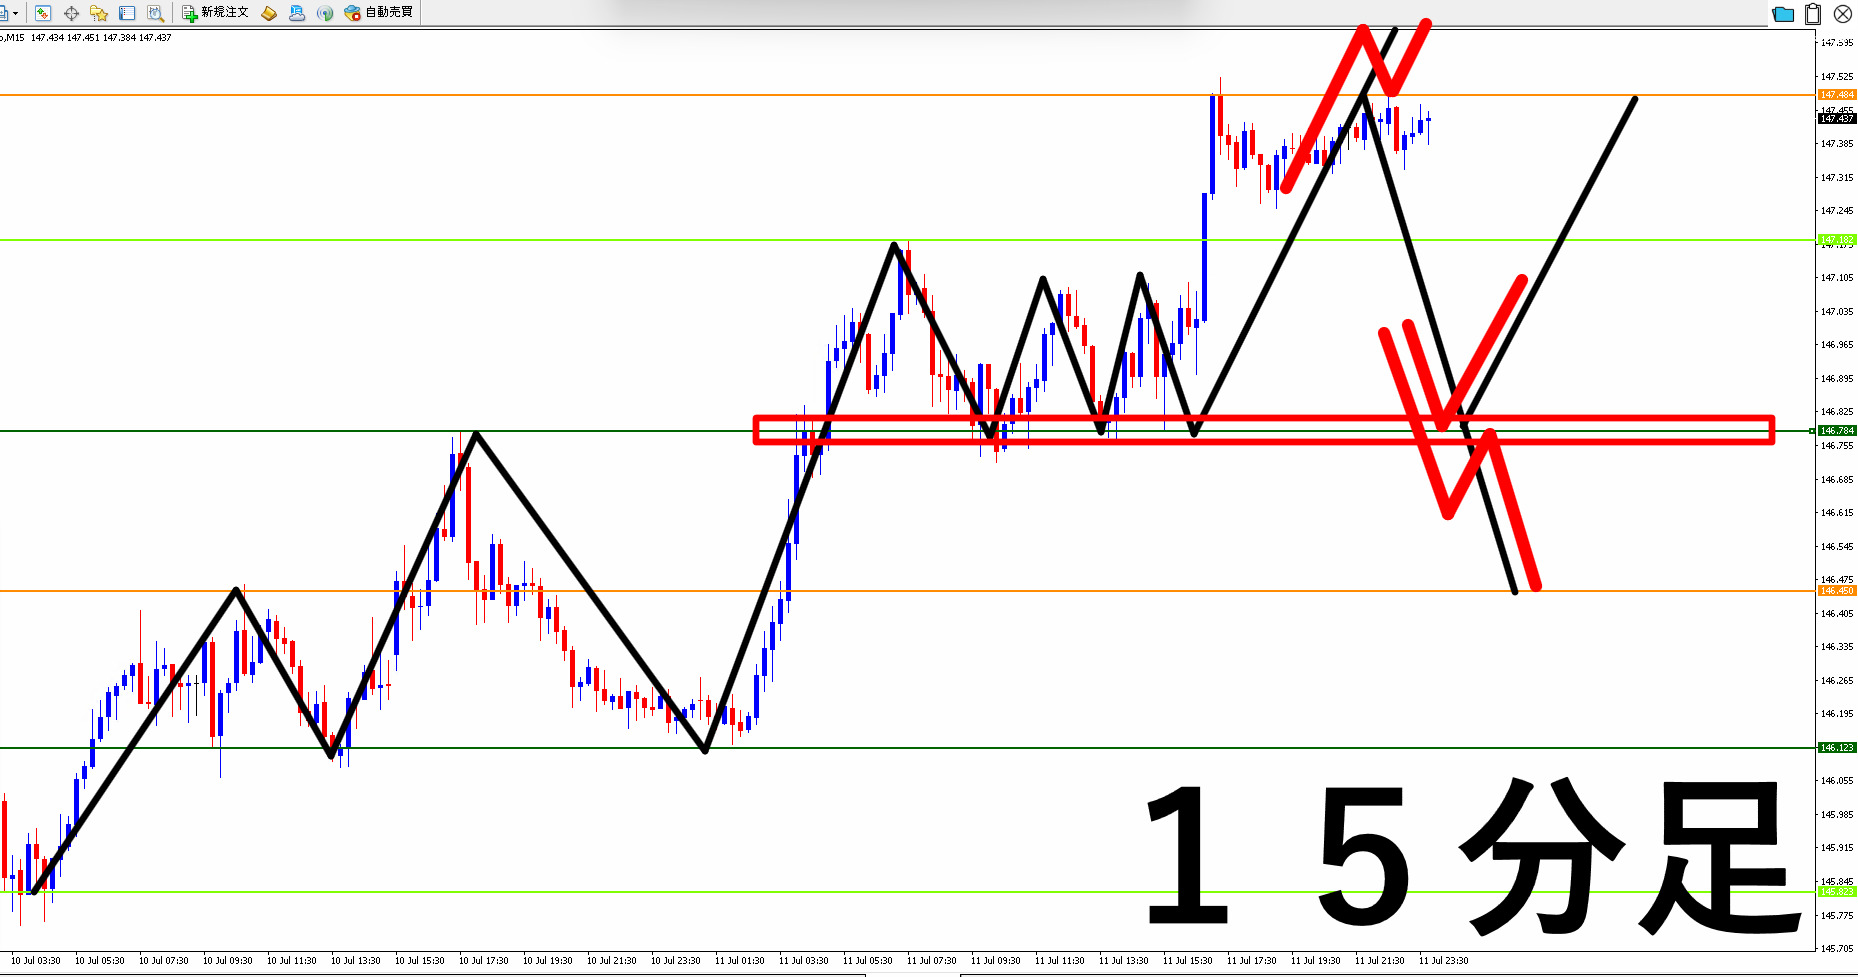
Even at the 15-minute level, buyers are favored
《 Note 》
Although there is a buying advantage from the daily to the 15-minute chart, the price sits near the daily high zone (resistance band), so take-profit and selling pressures may come from there. Plan accordingly.
《 Market forecast summary 》
【Red Circle ①】 Buy on pullback after breaking above around 147.484 yen. 【Red Circle ②】【Red Circle ③】 Sell on pullback after breaking below around 146.784 yen.
To prevent you from wasting time and money like me,Super Simple Method has been created.
I hope more and more people can win using the text I created.
※ Details of the text are at the bottom.
horizontal lineswaves (Dow Theory)situational awareness ‘
● Use horizontal lines and waves (Dow Theory) to understand the market across daily, 4-hour, 1-hour, and 15-minute charts,
Currently【2,956 people】 are applying this‘Super Simple Method
‘’
But,when I really started earningbegan

▼ ▼ ▼ ▼ ▼ ▼