AUD/JPY current status and forecast (target calculation based on assumed rate) (Stochastics, Point & Figure)
Slow Stochastics
Blue line = %K, Pink line = %D, Yellow line = Slow %D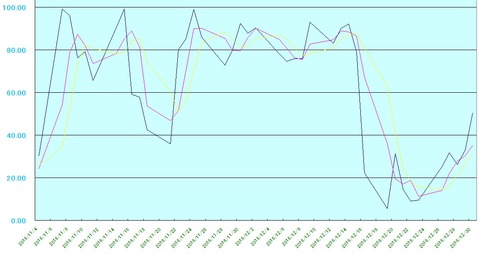
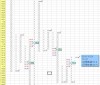
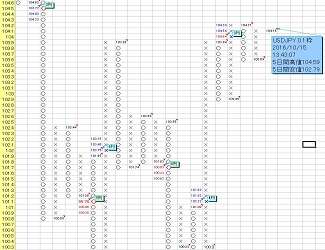
Daily chart 0.05 yen base frame P&F chart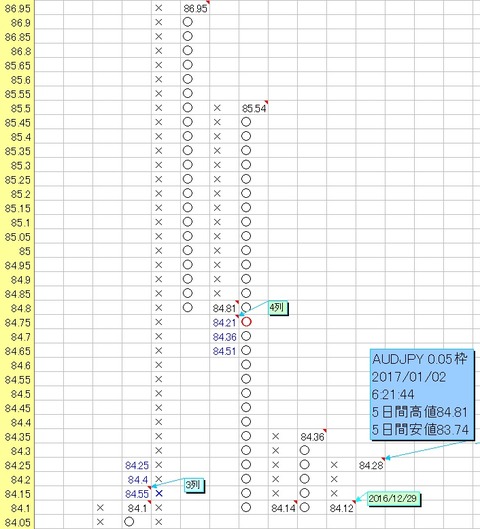
Daily chart 0.05 yen base frame P&F chart (assumed rate)
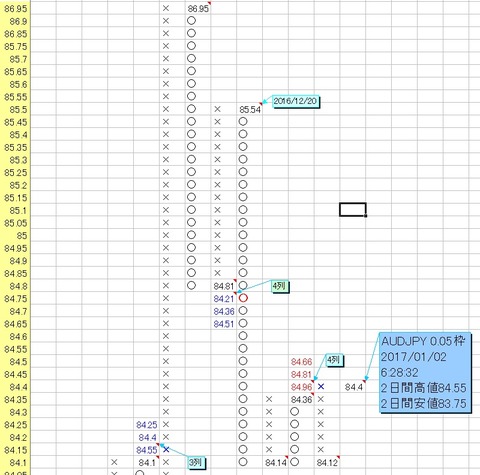
As in the above daily 0.05 yen frame Points & Figures, AUD/JPY will generate a bullish signal if the daily close is at or above 84.4 yen, and will generate an additional bearish signal if it moves below 84.1 yen.
In the above diagram, slow stochastics show a riseis occurring, and a bullish signal is also present()therefore the likelihood of a rise is considered higher.
Assuming the daily close rises to 84.4 yen or more
Using the function to calculate the expected upside target for the daily 0.05 yen frame P&F chart, as shown above, the maximum target is calculated to be 84.96 yen.
From this, as long as it does not clearly fall below 84.1 yen, the near-term upside target is expected to be around 85 yen.
Conversely, if it clearly falls below 84.1 yen, there is a possibility of a decline toward the upper 83 yen region.
Introduction and usage of the "Market Forecast Tool"
Introduction and usage of the "Market Forecast Tool"