
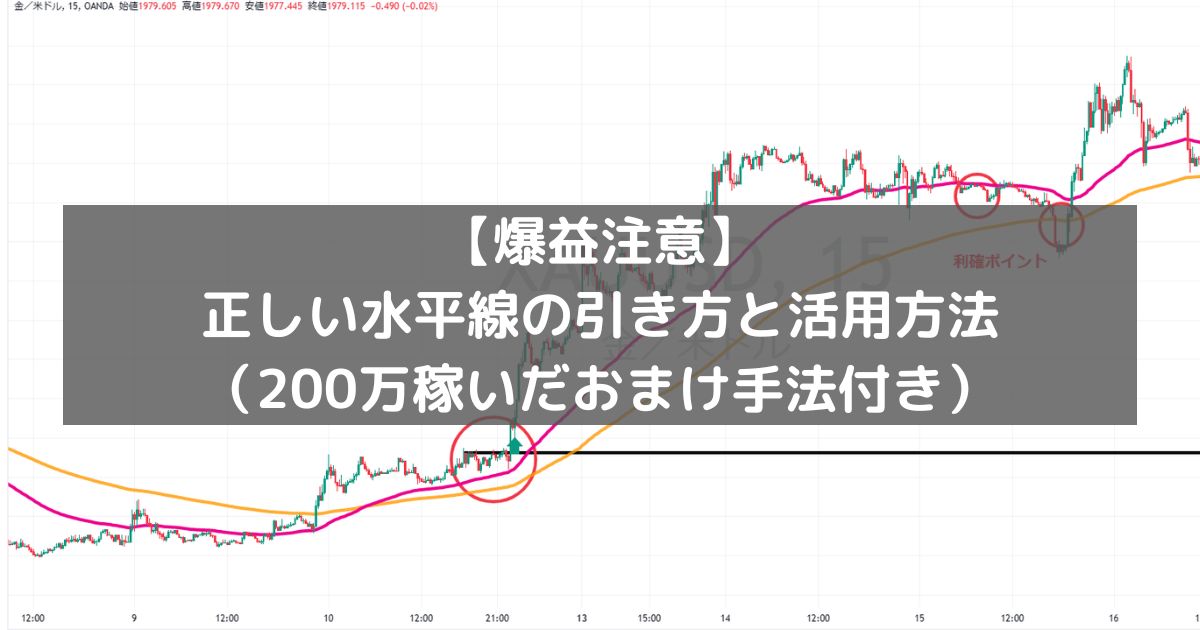
[Huge profits alert] How to draw a correct horizontal line and its practical uses (includes a bonus method that earned 2 million)
This article is for people like this
- “I can’t draw an aware horizontal line”
- “I don’t know where to draw the horizontal line”
- “I don’t understand how to use horizontal lines”
The more you practice horizontal lines, the more they lead you into a labyrinth, right?
You think, “Oh, this will be noticed too!” “Let’s draw one here as well!” and the chart becomes full of horizontal lines, and in the end, ...
【??There are so many lines that you can’t tell which line is being watched!??”
This tends to happen.
This is a common thing for beginners, and even many long-time traders can’t explain it in words, soeven on Google, there are few articles clearly explaining “how to draw horizontal lines.”.
So this time we will explain three things: “how to draw an aware horizontal line,” “how to use horizontal lines,” and “an extra technique.”
Let's aim for big profits by shedding the beginner label!
■ How to think about horizontal lines
Advantages and disadvantages of horizontal lines
Advantages of horizontal lines
From past chart data, you can find points where the market reverses (support lines and resistance lines).
This allows you to determine the timing of trades.
If you break through an often-addressed horizontal line, price tends to move quickly!
Also, horizontal lines are simpler and easier to understand compared to other analysis methods.
By drawing a straight line on the chart, you can grasp the market flow and reversal points.
Compared with other methods like trendlines or moving averages, the chart becomes less complicated, making it recommended for beginners.
Disadvantages of horizontal lines
Horizontal lines can be drawn anywhere unless you establish clear rules, which can make the chart messy.
Even drawing a horizontal line that the public doesn’t notice can lead to,simply being satisfied with having drawn a horizontal line.
Also, during highly volatile market periods or when new news affects the market, horizontal lines alone can be difficult to predict.
Rates may differ depending on the chart app or the brokerage, so drawing in the wrong place may result in a line that means nothing at all.
The chart is full of lines and you can’t tell which ones are being watched...
First, let’s think about “Why draw horizontal lines?”
The relationship between support and resistance
First, the definitions of terms.
Support line: a line where you think the price will not fall further,the lower boundand it is also called thesupport linefor the lower prices.
Resistance line: a line where you think the price will not rise further,the upper limitand it is also called theresistance linefor the higher prices.
I’ve made this easy to understand with images.
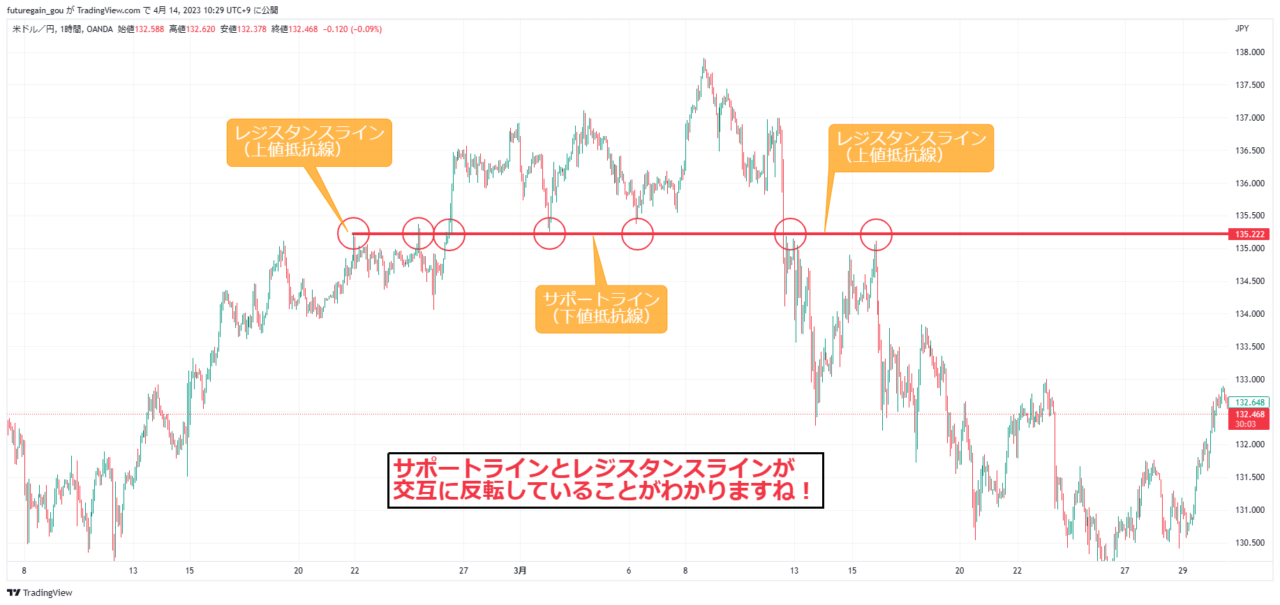
This is USD/JPY (Dollar/Yen) on an hourly chart, and this horizontal line is working quite well, isn’t it!
Also, after breaking the resistance line, you can see it acting as support next.
This is called “resistance-turned-support or “role reversal.
Using Dow Theory and Elliott Wave
It would be lengthy to explain Dow Theory and Elliott Wave in depth, so I’ll keep it brief.
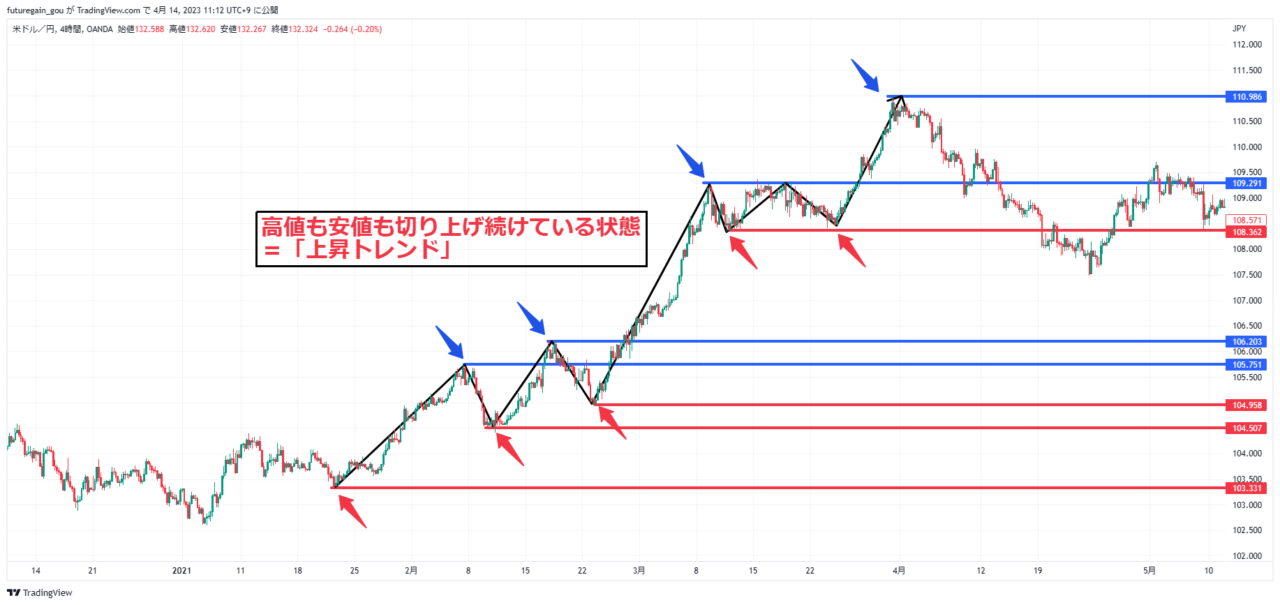
- Dow Theory... A theory that defines an uptrend as a condition where consecutive highs and lows are higher than previous highs and lows. Uptrend
and a downtrend as a condition where they are lower, Downtrend.
- Elliott Wave... The idea that market price movements follow a cycle of five rising waves and three falling waves.
Because this is difficult to understand with text alone, I will explain with images.
Dow Theory
- Uptrend
- Downtrend
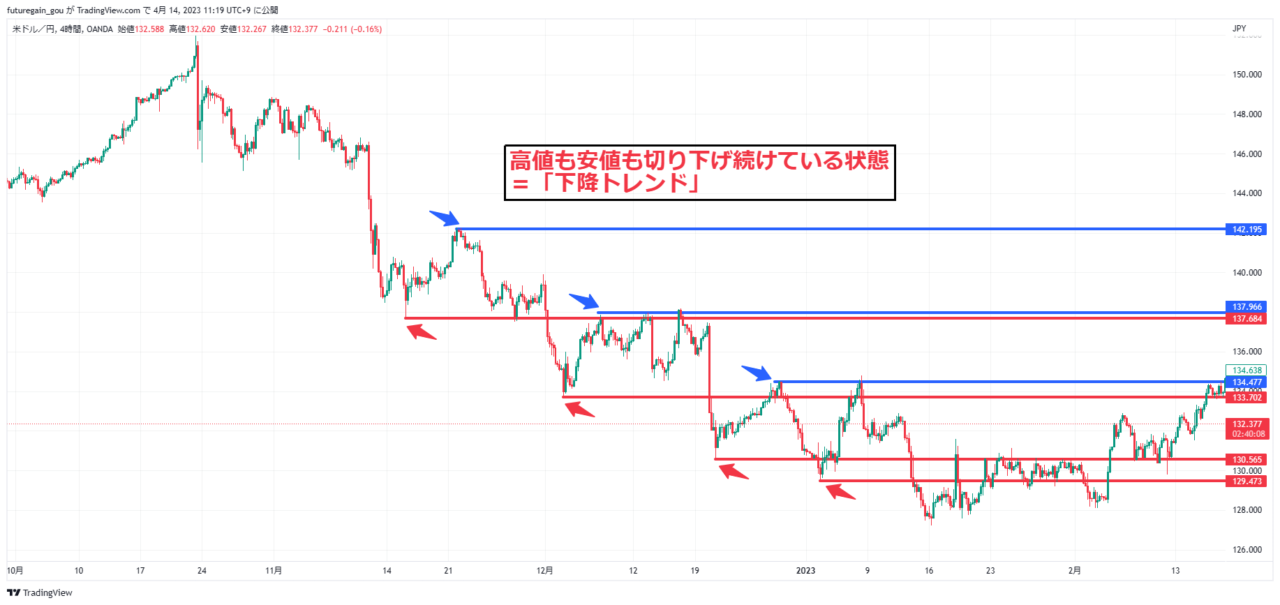
This“Uptrend” and “Downtrend” continue until the definitions are brokenaccording to Dow Theory.
There are also trends called “consolidation” or “boxes,” so clearly it iscomposed of three types: “Uptrend,” “Downtrend,” and “Consolidation.”.