[Learn the Basics of FX] Dow Theory [Easy-to-understand with images]
This article is for people like this
- "I don't really understand Dow Theory well"
- "I want to know Dow Theory properly"
- "If I know Dow Theory, will I start winning?"
Many books and blogs touch on "Dow Theory," right?
【?? Reading just characters won't help me understand, huh~ ??】
Some explain with diagrams or videos, but I would like to revisit and discuss Dow Theory as a way to organize knowledge once more.
■ What is Dow Theory
Dow Theory is a set of ideas about stock price movements proposed by Charles Dow, and it is used not only for stocks but also in FX.
Dow Theory is mainly composed of six principles,
- The averages discount all events
- There are three kinds of trends
- Primary trends consist of three phases
- Averages must confirm each other
- Trends must be confirmed by volume
- Trends continue until a clear reversal signal occurs
That is.
In FX, principle 5, "Trends must be confirmed by volume," doesn't offer much advantage, so you don't need to pay it much mind. (This article also omits the explanation.)
Do all winning traders understand everything?
Even among those who win, I think very few fully understand Dow Theory.
This is because you don’t trade using Dow Theory alone; rather, many people use it as one method to view the market from a certain perspective.
Also, many people use only the principles that are important to them.
Which principles are important
In FX trading, I personally consider that6. Trends continue until a clear reversal signal occursis the most important.
Understanding this changes the approach of the methods you use in the market (for example, staying with a trend vs. counter-trend trades).
Therefore, understanding Dow Theory can lead to using your methods more effectively.
Now, I will explain step by step.
■ The averages discount all events
All information related to supply and demand—from government economic statistics and corporate earnings to unpredictable events like natural disasters and even statements by important figures—gets discounted into market prices. The market price reflects all fundamentals, which also aligns with the efficient market hypothesis in that sense.
That sounds difficult, doesn’t it.
To break this down in my own words,
「All events are reflected in the chart」
That’s how it is.
Employment statistics, disasters, remarks by officials—all information is reflected in the resulting "chart."
Based on this idea, I stick to a purely technical analysis trading style.
■ There are 3 kinds of trends
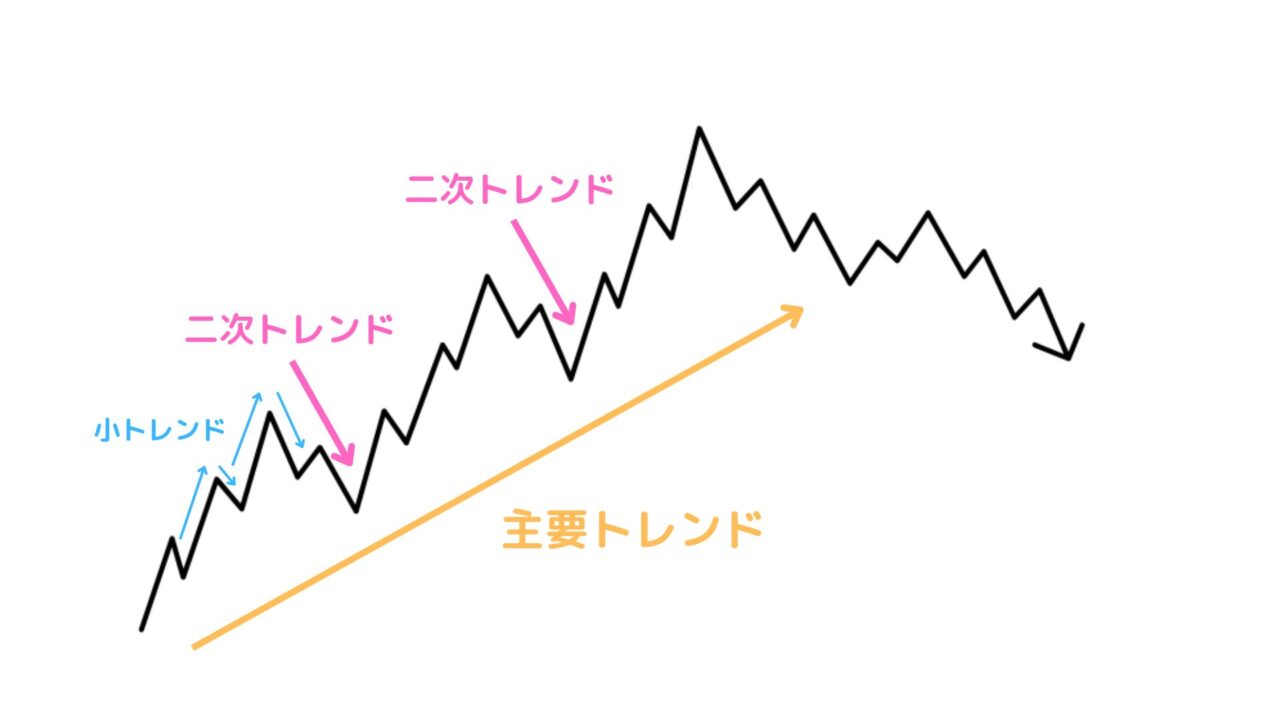
In Dow Theory, price movement analysis emphasizes market direction (trend). That trend is divided into these three kinds.
- Primary trend: a cycle of about 1 year to several years.
- Secondary trend: a cycle of about 3 weeks to 3 months.
- Minor trend: a cycle of less than 3 weeks.
These trends are not independent of each other; the secondary trend is a corrective phase of the primary trend, and the minor trend is a corrective phase of the secondary trend.
In simple terms, it’s three types of "short-term trend," "mid-term trend," and "long-term trend," connected fractally rather than independent.
This is what it looks like explained with an image.