
[Amida-style: Mastering the Market with Volume Profile] Lesson 18: Shapes of Volume Profile and Practical Applications
"If you understand the shape, you can read the intentions of institutional investors"
? continuation of the previous article
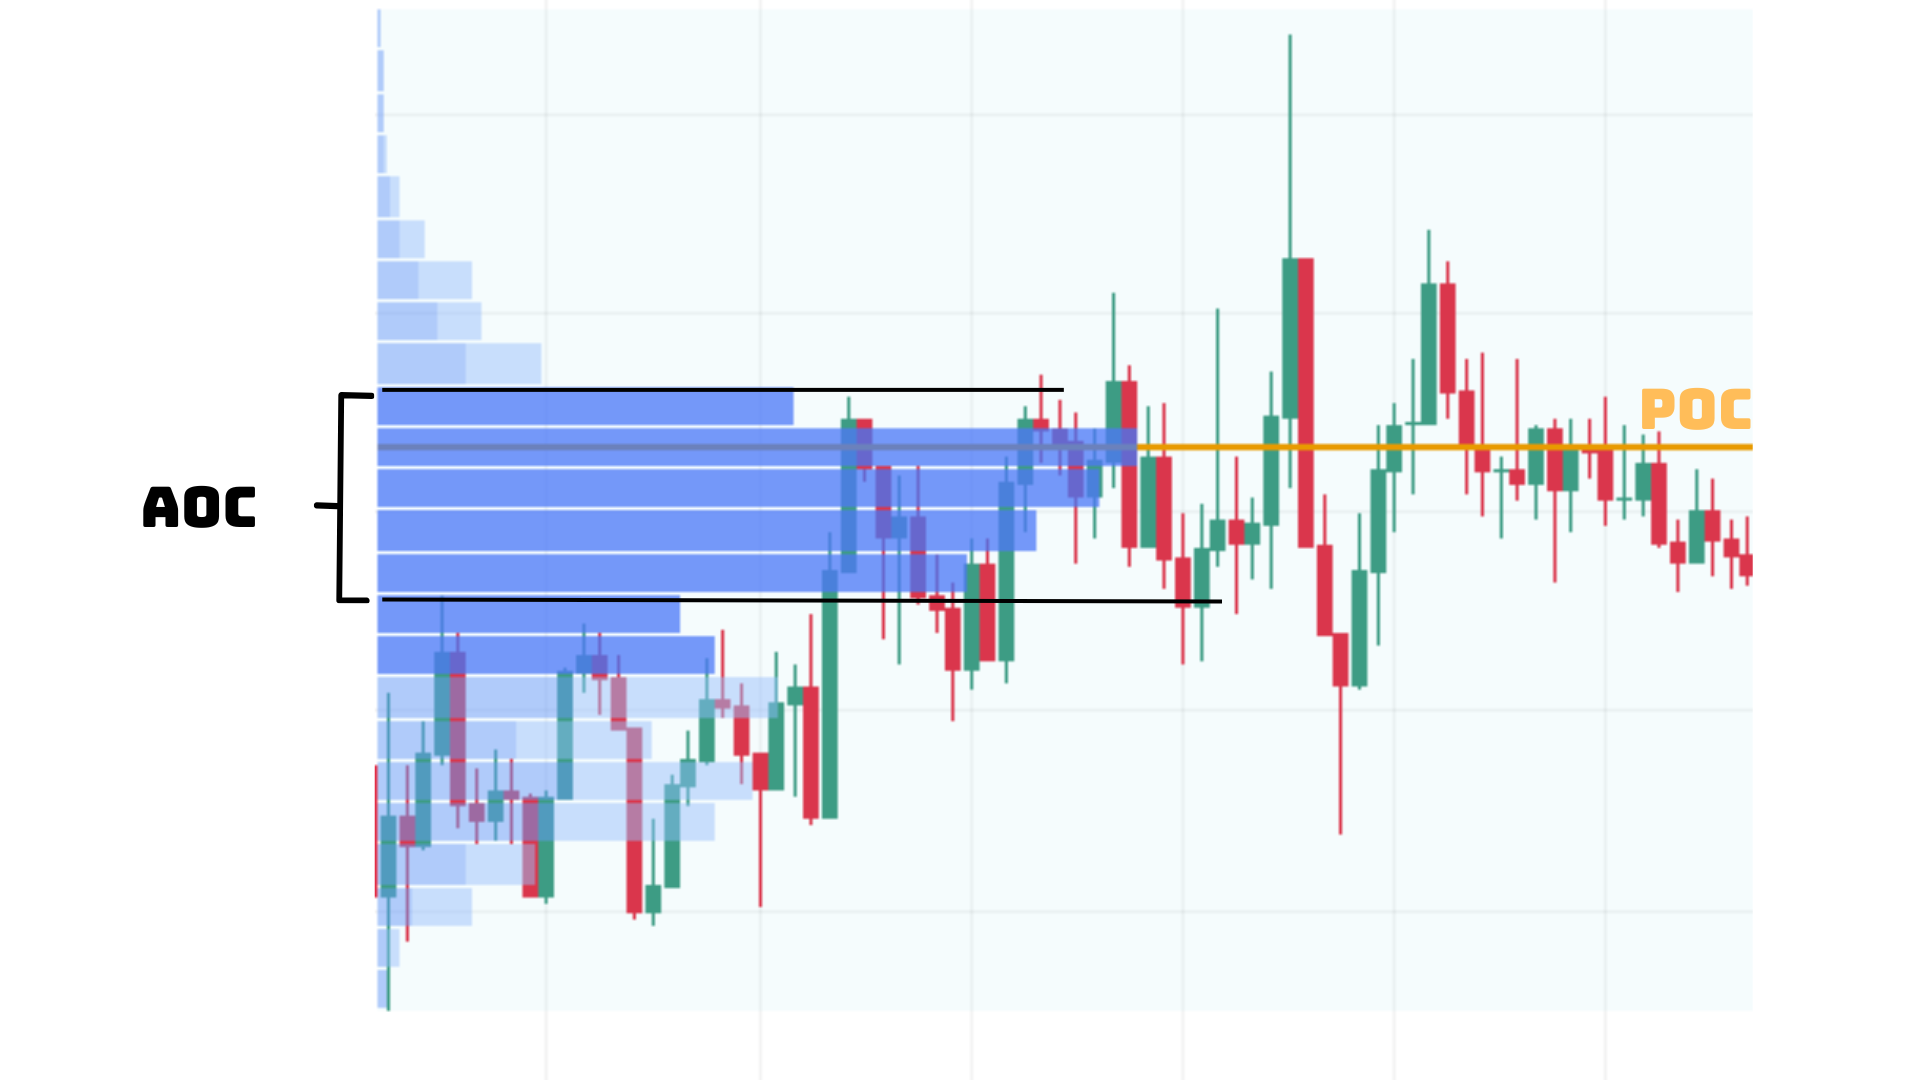
In the previous lesson, we explained in detail the central concept of Volume Profile, POC (Point of Control) (Lesson 16).
POC is the price range where the most trading has concentrated in the market and serves as an important basis for trading decisions.
Furthermore, we also explained the concept of Area of Control (AOC) that expands around the POC, and learned how market participants perceive trading zones (Lesson 17).
AOC is not just a numeric volume; it is a very important flexible price band where actual market battles occur.
This time, let's study the two representative shapes of Volume Profile — D-profile and P-profile.
? 1. D-profile – Signs of Accumulation Phase
D-profile is the most commonly seen shape, resembling a sideways letter "D".
This profile appears when the market is in a balanced state (where buyers and sellers are evenly matched).
? In this phase, institutional investors quietly accumulate or distribute positions.
Because market volatility is low, it is an optimal time to act without drawing attention.
D-profile characteristics:
Prices move in a narrow range with little volatility
Volume concentrates around the POC
There are small High Volume Clusters at the upper and lower range edges

? D-profile trading strategy:
If Price Action confirms at the range boundaries, trade reversals (short at the upper boundary, long at the lower)
Take profits at the POC, as price tends to revert toward the center of balance
If the profile breaks in one direction, consider a trend-following strategy in that direction (enter after breakout confirmation)

? 2. P-profile – Indicates Buying Dominance
P-profile resembles a vertical "P" and signals participation by aggressive buyers.
⚠️ When this pattern appears, common observations are:
A large bullish candle and high volume emerge
Subsequently, the price either consolidates or makes a temporary high
Cases where P-profile forms:
An clearly emerging uptrend
Or during the final stages of a downtrend, when buyers enter

? P-profile trading strategy:
POC becomes an important support zone on pullbacks
The lower, thinner, deeper volume clusters indicate price ranges where buyers are strongly engaged → price tends to rebound strongly when it returns
If this rebound is confirmed, consider a long entry

✅ Summary
By discerning the shapes of Volume Profile, you can read not just numbers but the intentions of money flowing in the market.
D-profile: institutional investors accumulating positions – preparation for a breakout
P-profile: signs of aggressive buying – potential beginning of an uptrend
? By combining POC, volume clusters, Price Action, and market context, you can make more precise and safer trading decisions.
? Next time, we will explain the other two shapes of Volume Profile — b-profile and Slim Profile (Thin Profile) in detail, so
stay tuned!