
[Amida式:ボリュームプロファイルで市場を制す] Lesson 15: What is Volume Profile? – "The flow of funds never lies"
As mentioned in Lesson 1, in modern financial markets, prices do not move randomly, but are moved by large-cap, well-funded investors.
In fact, it is said that about 80% of the total market trading volume is generated by ten major financial institutions.
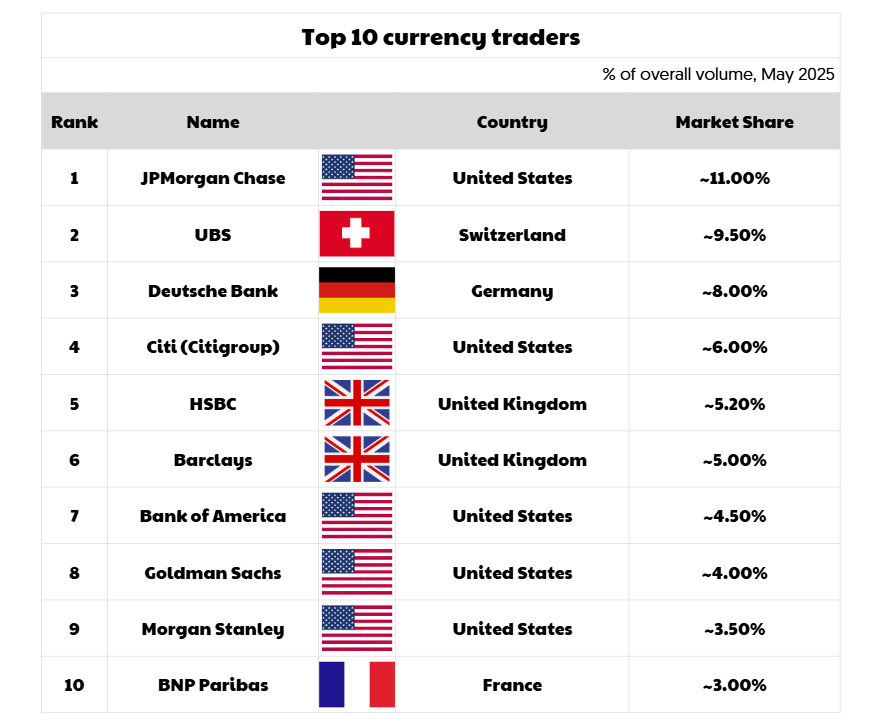
In other words, if you really want to understand what is happening in the market, you should追追 the footprints of the big players.
? So this time, we will introduce a powerful tool to interpret these “big footprints,” Volume Profile
.Volume Profile: What is it?
Volume Profile is a tool that visually displays volume by price. While common indicators show volume over time, Volume Profile focuses on “how much trading occurred at each price range.”
? In other words, it answers not “What was the volume during this time period?” but “At which price did the most orders accumulate?.”
This is precisely information that big investors pay attention to.
Big players cannot place large orders all at once, so they tend to split and gradually place orders, concealing their intent.
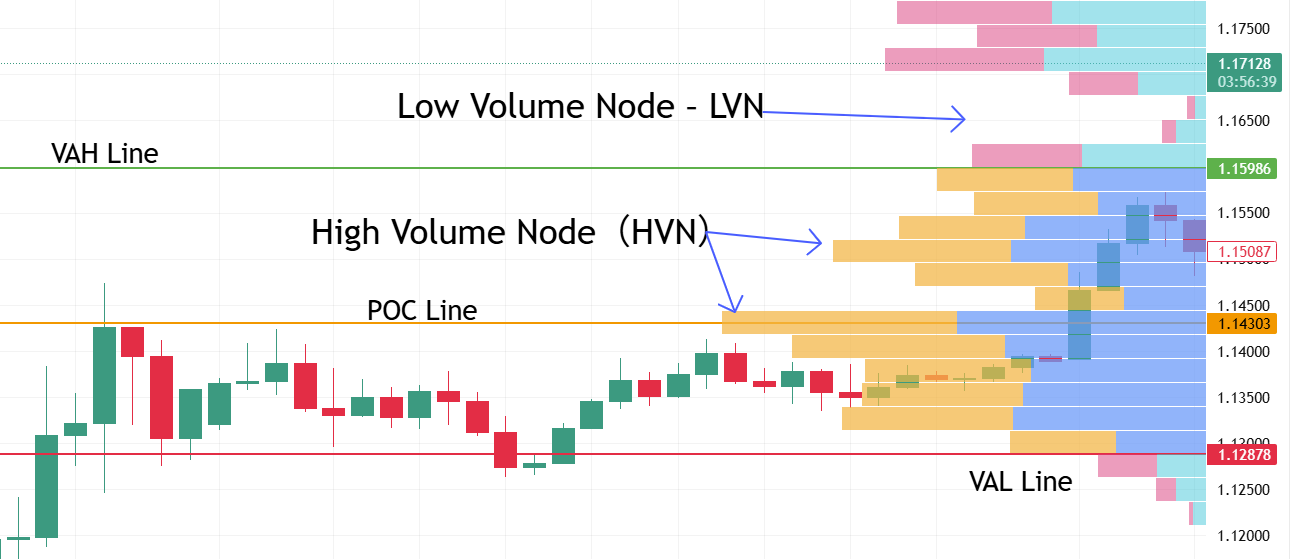
As a result, trading concentrates in certain price ranges. This is an important price band called High Volume Node (HVN), which tends to become support or resistance in the future.
On the other hand, price ranges with low volume (Low Volume Node – LVN) are areas where the market can pass smoothly and breakouts are more likely.
What Volume Profile reveals
Accumulation zones of institutional investors: zones where buying up or selling out is likely happening
Fair value price band: the zone where the market judges fairness and volume concentrates
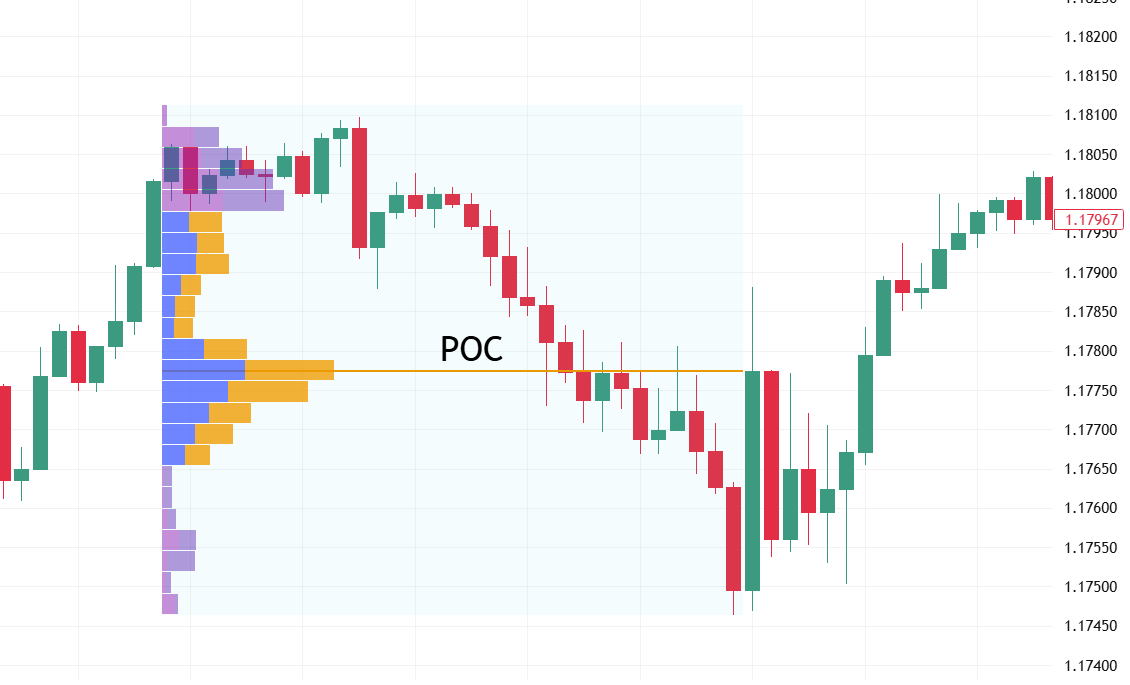
POC (Point of Control): the price where the most trades occurred. The market’s “balancing point”
Smart money behavior patterns: hidden entries, liquidity hunting, signals of price manipulation
? Conclusion: Volume (trading volume) does not lie. Funds movements always leave traces on the chart. And the tool to interpret those traces is Volume Profile.
How to use Volume Profile in TradingView
Currently, TradingView makes Volume Profile easily accessible and free to use.
It is a charting platform widely supported by both beginners and advanced users.
✅ Basic usage:
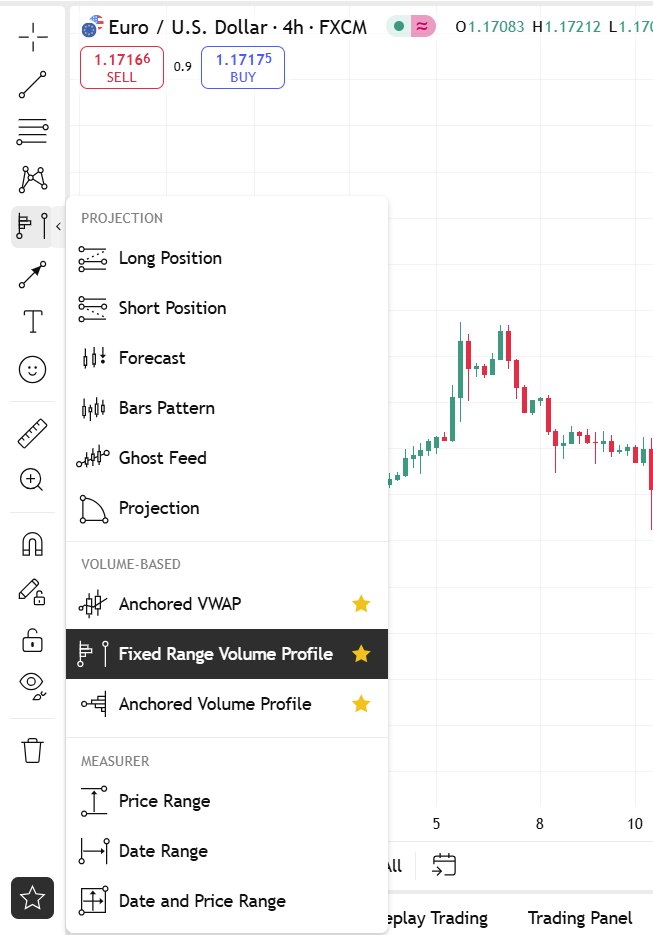
Open a chart on TradingView (e.g., EUR/USD)
From the top menu, click “Indicators”.
Search and select “Fixed Range Volume Profile”.
Drag to select the period on the chart to display Volume Profile for that range
? Quick tip:
Prices where the Profile appears thick indicate high volume concentration and are likely of interest to institutions.
Conversely, thinner areas indicate lower liquidity and are more prone to breakouts
✅ Summary
Volume Profile is not just a technical indicator.
This is a “gap in the market” to interpret the actions of large funds.
While indicators like RSI or MACD react to price, Volume Profile reveals the underlying cause—the flow of funds.
If you want to understand the market’s essence deeply, start by learning how to read Volume Profile.
With TradingView, anyone can easily learn with a free account.
? In the next blog, we will delve into one particularly important concept within Volume Profile: “POC (Point of Control)” in detail.
That is the center point where demand and supply balance becomes visible.
Stay tuned!