

Should I include this chart? — A record of the “gap” discerned by the rules 【Issue 24】
Will you include this chart?
— A Record of the “Chasm” That You Can See Through with Rules【 Issue No. 24 】
【July 7, 2025
Late London to early New York | Verification Report of the Sky's Chasm Logic
⸻
?Verification Overview
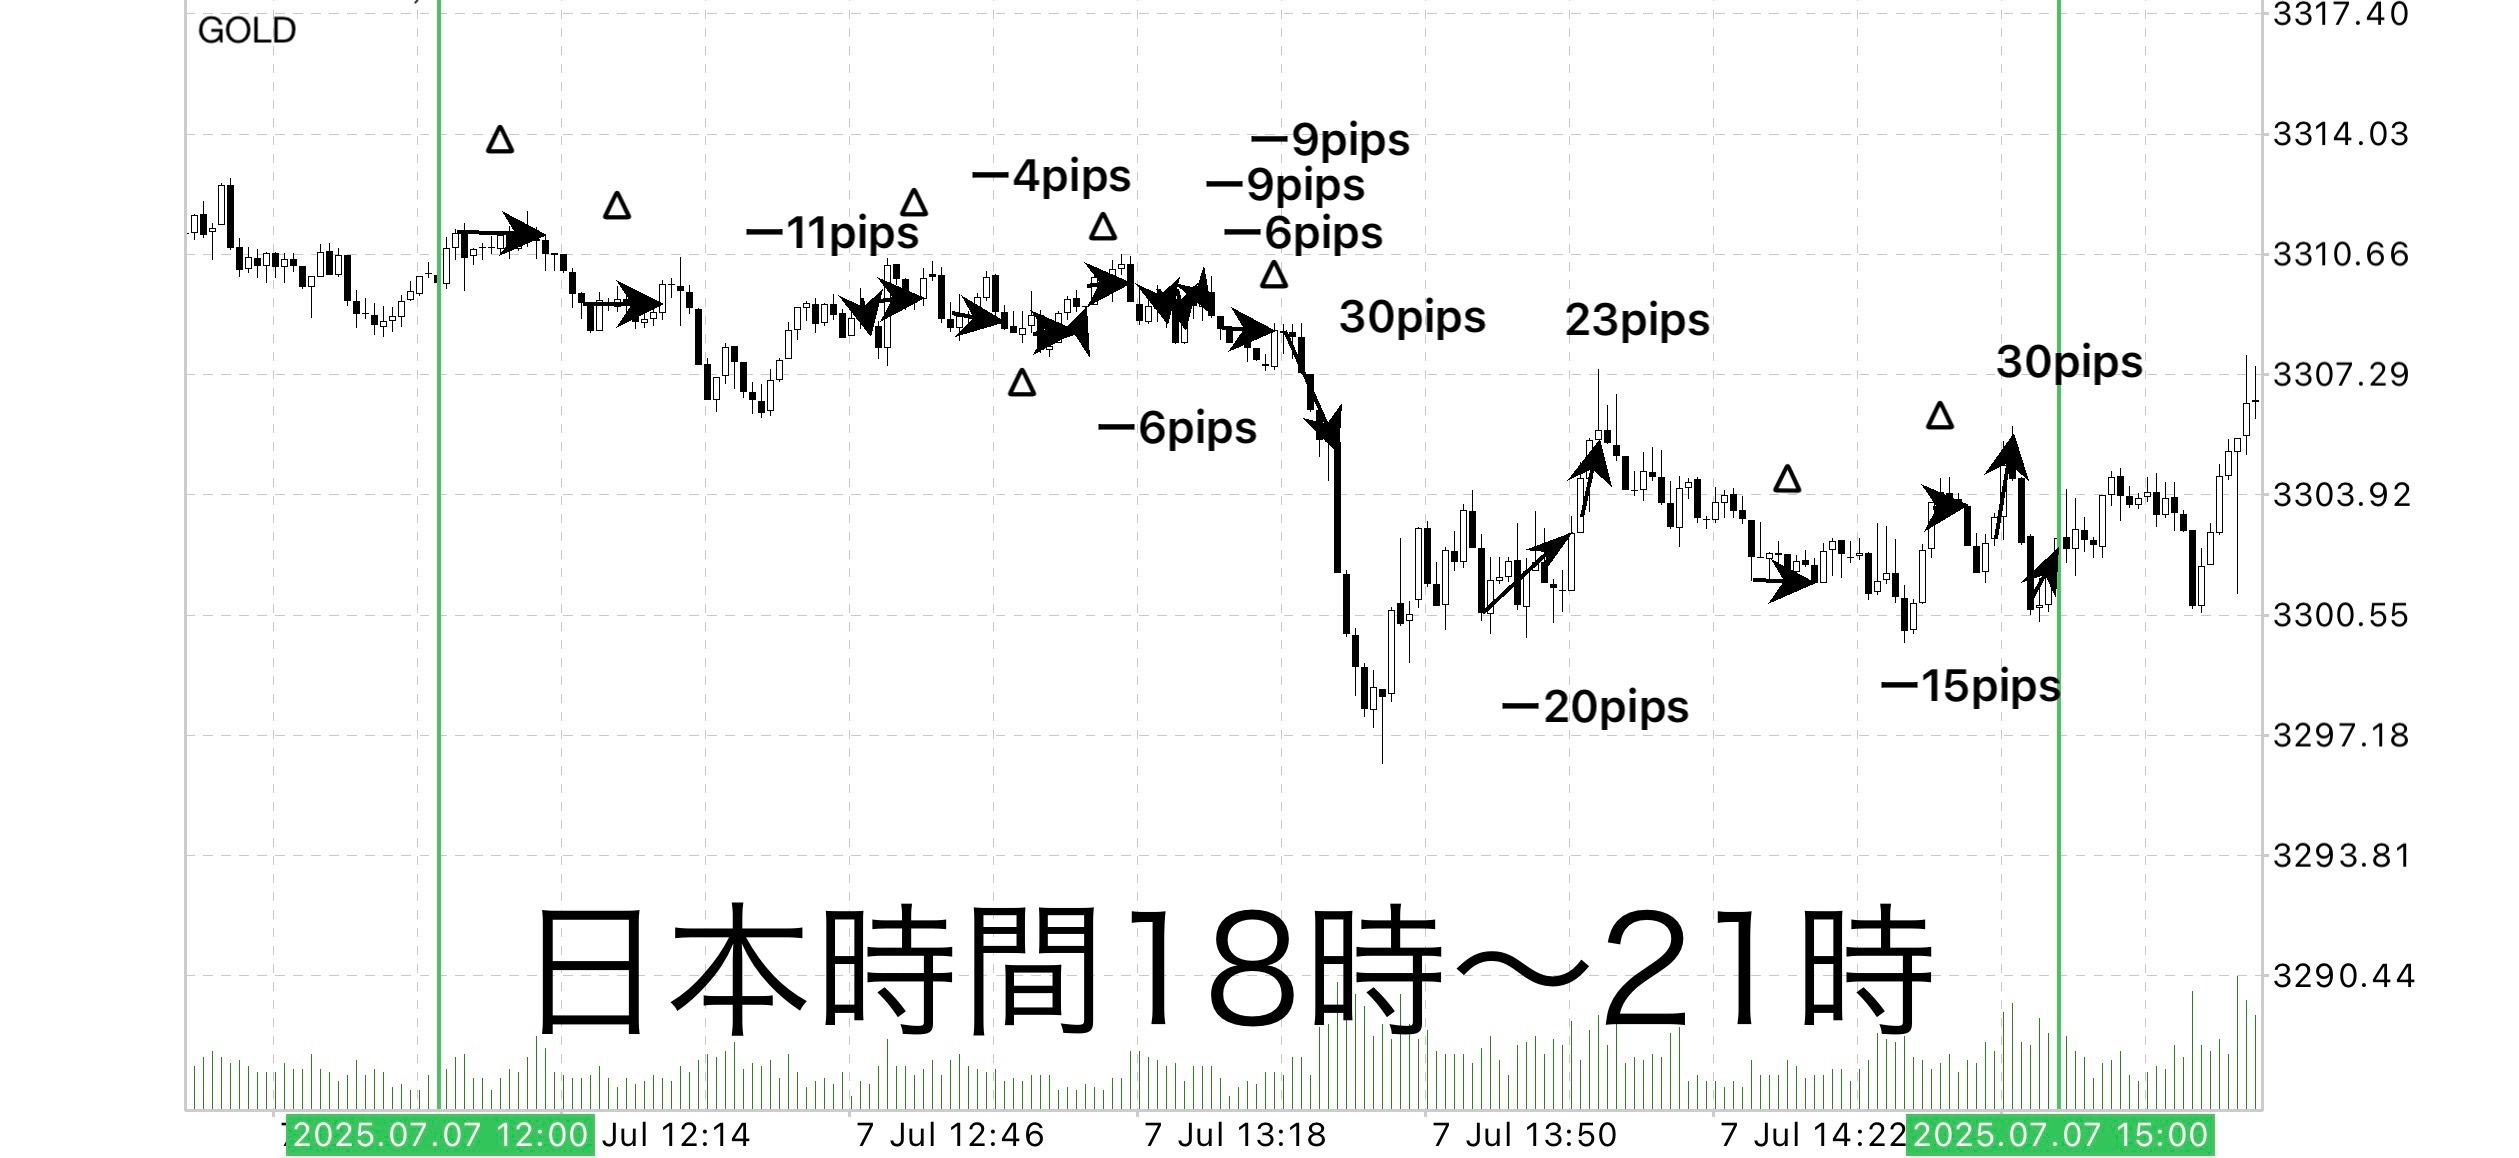
This time, the verification targeted the 3-hour window from 18:00 to 21:00, which corresponds to late London to early New York time, using GOLD (XAU/USD) on a 1-minute chart.
Entries are based on the “Sky's Chasm” logic and follow a breakout-style structure to automatically capture opportunities. Note that this time actual entries were not made; we are testing what the results would have been if the logic had operated as intended.
⸻
?Trade Result Summary (GOLD / July 7, 18:00–21:00)
• Total trades: 19
• Take profits: 3
• Breakeven/adjusted close (including small profits): 8
• Stop losses: 8
• Total gained pips: +83 pips
• Total lost pips: -80 pips
• Net profit: +3 pips
• Win rate (Take profit ÷ Number of trades): approx. 15.7%
• Profit Factor (PF): approx. 1.04
→1 lot: approximately +4,350 JPY/0.1 lot: approximately +435 JPY
?Market Structure and Difficulty
That day, GOLD experienced extremely high noise and a lack of clear direction.
In particular, from 18:00 to mid-session, there were frequent small up-and-down moves, with a “false break and pullback” pattern repeating.
As clearly shown on the chart,
• Trades ended at the breakeven price
• Stop losses of -11 pips or -15 pips
and so on, with moves that shook small amounts repeatedly, making it extremely rare to ride a trend and profit in one go.
Nevertheless, during the mid-session downwave (-20 pips → +23 pips → -15 pips) and a near-end surge of +30 pips, there were faint instances where momentum continued after a breakout.
⸻
?Key Market Insight
What stood out in this verification was the following market conditions:
①Break attempts in a range
What looks like a trend at first often ends up as small movements within a range between recent highs and lows, with entries prone to quick reversals.
②Many wicks = lack of direction
Long upper and lower wicks on candles indicate hesitation among participants and make directional certainty difficult. The time period of this test showed exactly that kind of price action repeatedly.
③Return moves after a move in one direction
A -20 pips drop followed by a +23 pips rise, then a +30 pips move, suggests a behavior where large players switch positions in bulk.
In such a pattern, if you don’t understand the structure by zone, the risk of getting caught in short-term “counter-trend” moves increases.
⸻
?Role of EA: Make decisions without hesitation
Entrances and stop-losses can be entrusted to an EA (automated trading), where speed is required, allowing it to excel in such reactive moments.
In particular,
• Entry immediately when a clear line is broken
• If movement goes in the opposite direction, close the position with predefined conditions
These sequences are executed with “mechanical precision” that is hard to achieve with discretionary trading.
However, profit-taking points often remain advantaged for discretionary trading, so it is important to maintain flexibility and adjust to market conditions.
⸻
✅Summary
• Even with frequent “false breaks,” we could defend the position by acting according to the rules
• Even when the trend isn’t clear, the EA’s immediacy minimizes losses
• Understanding the overall market structure (zones and wave formation) is the most important
• Even a small gain of +3 pips demonstrates an edge by staying positive in this environment
____
◻️ For those who want automatic entries via EA
A tool that implements this logic as an EA is being considered for distribution as a review bonus.
If you are considering a purchase, please feel free to contact us.
If you are interested in Sky's Chasm, you can join our online community
Join the Online Community Here

Specific trade logic cannot be explained inside the online community, but
you can participate in a “Chart Review Community” that uses the Sky's Chasm.
• If you send a chart image you are curious about,
you will receive feedback with explanations like, “In this scene, how should I have judged?”
“Where was the entry/exit point?” and feedback with rule-based decision examples.
• Past charts for specific time periods are also OK.
We will respond in the order we can within time limits.
To those who have become interested in Sky's Chasm
Build a foundation to judge with rules without hesitation in short-term trading —
That is the core philosophy of Sky's Chasm.

? Free teaching materials here:
▶︎Download “Path to the Chasm”
In “Path to the Chasm,” you can see in what situations you can actually trade,
and the criteria for judgment is explained more clearly.
Additionally, it covers specific entry points and zone selection that could not be fully conveyed on the Sky's Chasm sales page,
with diagrams and case-by-case explanations.
Even beginners will find it easy to reproduce, so
If you’re curious, please make use of it as well.
⸻
If you’re interested, please first receive the free material “Path to the Chasm.”
From there, your first step in the Chasm begins.
? When you’re unsure about “Should I enter this chart?”
We hope it helps you switch to thinking in terms of rules rather than impressions.
Sky's Chasm

https://www.gogojungle.co.jp/tools/ebooks/64393?via=toppage_recentViewed